2013 has been another big year for SuccessFactors WorkforceAnalytics. Notable enhancements and new features included cross domain reporting and new charts library with Online Report Designer, and of course Headlines.
Our November release included numerous updates and enhancements for reporting and analytics. I wanted to highlight just three of the many enhancements included in this release around Online Report Designer.
If you are not familiar with Online Report Designer, I encourage you check us out. I think you will be very impressed with the capabilities and above all, with the user experience. Online Report Designer provides a user-friendly and powerful set of tools, designed especially for the cloud, which enables anyone in your organization to build or customize reports and dashboards and share the results with others.
Online Report Designer is available across the SuccessFactors HCM suite with Employee Central for reporting of your core HR transactional data, with Platform for creating reports based on transactional data in your various SuccessFactors Talent Management modules, and with Workforce Analytics. The power and flexibility in Online Report Designer enables you to:
- Choose from a library of standard components and charts to create your page layouts
- Format with images, text and custom color palettes
- Drag and drop to edit joins between tables
- Create pivot tables and charts with subtotals
- Define date parameters, such as ‘as of date’ or date range
- Re-label fields and enhance column formatting
- Concatenate fields, and transpose rows to columns
- Include calculated and aggregated columns
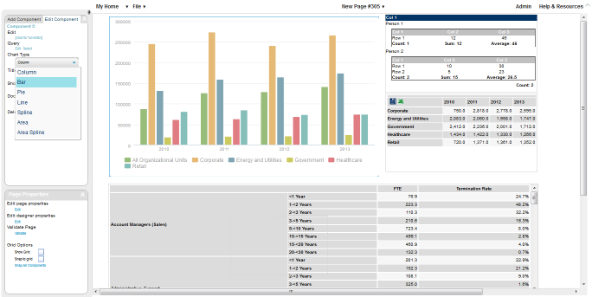
Figure 1 – Example of building a report with Online Report Designer
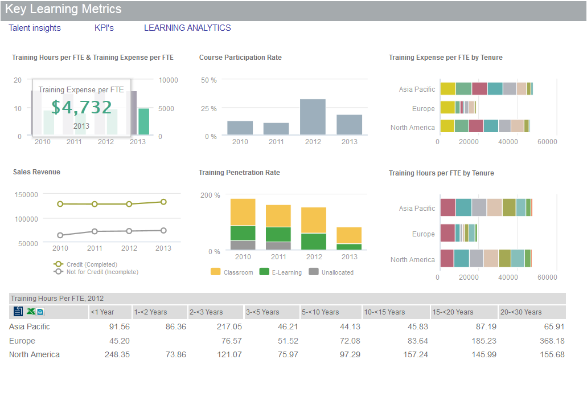
Figure2 – Example of a dashboard built with Online Report Designer
Users of Employee Central, Talent Management with Platform, and Workforce Analytics can all equally benefit from these new enhancements to Online Report Designer:
Report Sharing Based on Dynamic Criteria
Online Report Designer has always had robust capabilities for scheduling and distribution of reports, including:
- Ability to distribute reports via email, FTP, or to run offline.
- Ability to output reports to PDF, Word, PowerPoint and Excel file formats. Excel format is certainly important for those that wish to make data available for offline analysis.
In this release the distribution capability is enhanced to allow further refinement in determining who will receive reports. You will now have the ability to share reports with individual users or with groups of users according to user attribute criteria, such as department, division, location, RBP role, or Manager/Non-Manager/HR Manager role.

Figure3 – Report Sharing
New Charting Export Capability
In the August 2013 release, Workforce Analytics customers received access to enhanced reporting capabilities with an extended charts library. Charts, graphs and dashboards come alive with the advent of HighCharts library. HighCharts provides animated, modern and beautiful look and feel to charts and dashboards presented in input measure and results pages for a visually pleasing user experience.
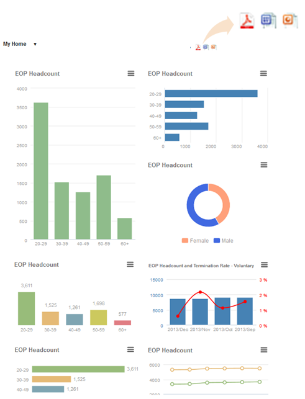
Figure4 – Ability to Export Reports and Dashboards
In the November release, output to PDF, Microsoft Word and Microsoft PowerPoint is supported for these new charting components.
Learning Data in Online Report Designer
The powers of Online Report Designer in SuccessFactors Platform have been extended for application in Learning. Now you can create Learning Management System (LMS) reports using the Online Report Designer, taking advantage of features such as aggregating results in pivot charts and tables, including calculated columns and using If/Then/Else logic, exporting results to PDF, Word, PowerPoint, and Excel, and using Report Distributor to share reports.

Figure 5 – Example of a report from cloud Learning Management Solution (LMS)


