Dashboard 2.0 Reports are visual reports in SuccessFactors. Some of these reports are pre-delivered, while others can be ordered (for a fee). These visual reports have a pretty nice design and can be used as a Tile on the Welcome page as well. The Dashboards are built using an client based (i.e. installed on a PC) tool called YouCalc Dashboard Builder (stand-alone software). SuccessFactors bought the tool some years ago and it seems there are not many people out there, who are familiar with it. It picks up data from an ad hoc report and visualizes it. Unfortunately, as a customer, you cannot build you own reports yet and need a partner (or SuccessFactors) to create these reports and dashboards for you. I’ll cover details of what the YouCalc Dashboard Builder for SuccessFactors can do and how it looks like in this article.
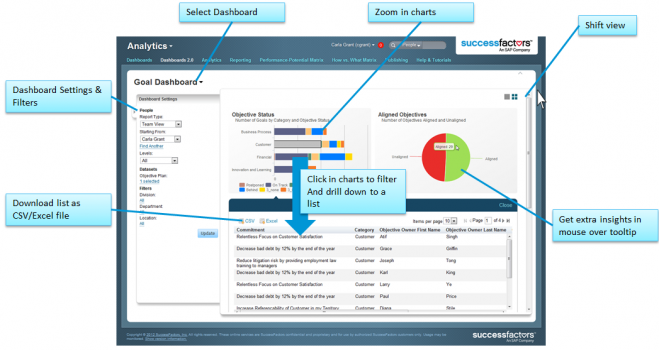
Dashboard 2.0 Example Report in SuccessFactors
General Things for Dashboard 2.0 Reports in SuccessFactors
You can find Dashboard 2.0 Reports in several places in SuccessFactors. They can be shown as a Tile on the welcome page, showing charts and figures in the Reporting Tab, or can be used for support in the Employee Profile (for example, Compensation). The Recruiting module also uses a YouCalc Dashboard Model to show the candidates and requisition overview. Modules which mostly use Dashboard 2.0 Reports are: Goals & Performance, Recruiting, Compensation and Succession.
Dashboard 2.0 Reports are an embedded analytics solution in the SuccessFactors suite. The technology behind them is an in-memory analytics and calculation engine pulling data from the Ad Hoc reporting framework. This allows the dashboards to be fast, interactive and always have data that is 100% up to date (no delay). The Dashboard 2.0 Reports are built by SuccessFactors and partners, and are available as custom dashboards. Again customers can’t build their own Dashboard 2.0, because they usually don’t have access to the software (YouCalc Dashboard Builder) to do so.
To use Dashboards 2.0 Reports you need to activate them in Provisioning (“Dashboards 2.0 (Youcalc) Framework”) and give permission to users via Admin Tools -> Permission Roles (Report Permission -> YouCalc Tiles And Dashboards). Admins should also get the permission to manage Dashboards 2.0 Reports (Manage Dashboards / Reports -> YouCalc Tiles And Dashboards). Keep in mind that you also have YouCalc options to check for other modules in Provisioning if you want to use them.
Note: There might be customer-specific configuration that prohibits the standard dashboard from working out of the box. SuccessFactors don’t guarantee that all widgets in the standard dashboards work for every configuration. Before you use a standard report make sure you uses all standard fields which are required for this report. We recommend customers talk with their implementation partner, if they want to use standard Dashboard 2.0.
Functionality & Features of Dashboard 2.0 Reports in SuccessFactors
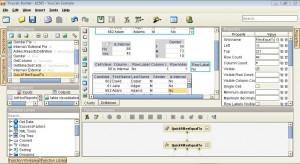
YouCalc Dashboard Builder Overview
I don’t know of any BI software I could compare to YouCalc so far. It looks and works really different as you will see in the picture “YouCalc Dashboard Builder Overview”. The Tool suggests that it can work with data provided by WebServices (REST), CSV’s and several sources from SuccessFactors (AdHoc Reports, AdHoc Report Definition, Recruiting, Workforce Analytics and so on), but in all cases I saw it was working with data from SuccessFactors. You cannot write your own SQL Queries or drag and drop different fields together to pull data from the Instance. The data is pulled from an Ad Hoc report definition, which you import into YouCalc before building the Dashboard and if you upload the YouCalc model later into your instances, SuccessFactors will know where to get the data from (obviously from an Ad Hoc report, so it is important to always keep that report!).
The YouCalc Dashboard Builder has tons of functionalities (see picture “Functions in YouCalc”). Most of the customers will never see the software which creates Dashboard 2.0 Reports. That’s why I want to give you a brief overview of what YouCalc looks like, to give you some ideas about what it can build, as well as some of its limits.
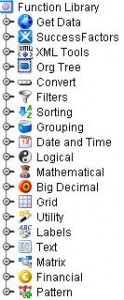
Functions in YouCalc
First of all you need to have an ad hoc report from your SuccessFactors Instance you want to run the Dashboard 2.0 Report in. Export the ad hoc report in CSV and the report definition. That will be the basic data you will work in the YouCalc Dashboard Builder. Now, you are able to build or set-up the data for charts or tables as you wish. It is sometimes really tricky to extract and combine data, because you have a wide range of functionalities you have to learn first.
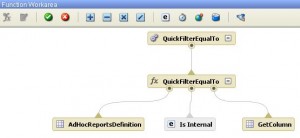
Functional Area in YouCalc
The Functional Area (see picture “Functional Area in YouCalc”) in YouCalc is hard to understand at the beginning, but after some days of training, practise and testing you will get familiar with the tool.
You are not able to see the visualisation in YouCalc itself, but if you click the button “preview” on the top you will be redirected to your standard web browser and can see your results (see picture “YouCalc Preview”);
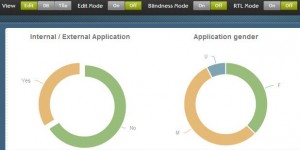
YouCalc Preview
though you still need to set up properties and functions of your chart, table or text in YouCalc.
Tip: You have the option to change positions in the preview as well as seen the Dashboard 2.0 Report in a Dashboard mode or as a Tile.
What you see in picture “Dashboard 2.0 – YouCalc Example”: I have activated several features in the dashboard. If you hover over the pie chart you will see how many candidates (by number and in percent) are external or internal applicants. What you don’t see is that I made the pie chart selectable (tell me if you think a video demo would be useful).
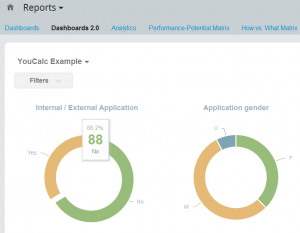
Dashboard 2.0 – YouCalc Example
That means if you click one section of the chart it will drill-down to the details of the data behind. Under the chart there will be a pop-up that shows a table with details for all candidates (internal or external) with their full name and Candidate ID. If you wanted to you also could make the individual candidate clickable. That means for internal candidates you can directly jump to that employee, who applies for a new position. That’s what makes YouCalc so valuable for all requirements, where you need to drill down for more information.
I hope you just get some ideas what is possible with the YouCald Dashboard Builder and Dashboards 2.0 Reports in SuccessFactors. If you have further questions just contact us or write a comment below.
Note for SAP Partners: The last version of YouCalc Dashboard Builder can be downloaded from the JAM Group “youcalc”. You won’t find that piece of software in the world wide web and it is not permitted to shared the tool with clients or 3rd parties.
Pros & Cons of Dashboard 2.0 Reports in SuccessFactors
As with all things, Dashboard 2.0 Reports in SuccessFactors has its pros and cons. In some cases it would make sense to use another reporting solution, such as one mentioned in my series of reporting articles, or another I will write about later on. It is maybe not as powerful in terms of visualisation as the Workforce Analytics module, but it is a great way to get the most important data (KPI’s) visible for everybody. Also because you can use more than ad hoc Report to present your solution. In the first article we already talked about the flexibility and level of visualisation in SuccessFactors. Dashboard 2.0 Reports are one of the best solution in terms of how we get data visualised in a nice and intuitive matter.
Advantages
+ highly configurable
+ nice design and layout
+ wide range of functionality
+ used as classic dashboard or tile
+ pulls live data with good performance
+ data can be drilled down to detail level
+ able to use more than one ad hoc Report
Disadvantages
– content limited to ad hoc repots & available domains
– limited cross domain reporting (same as in ad hoc reporting)
– requires a lot training and testing
– external tool, which is only accessible by SF and SAP Partner
This Article is part of a series in “HR Reporting and Analytics in SuccessFactors”
HR Reporting and Analytics in SuccessFactors – Part 1
Standard & Ad Hoc Reporting in SuccessFactors – Part 2
Visual Reporting with BIRT Templates in SuccessFactors – Part 4


