Now a days client has plenty of choices to select Analytical tools as per there business requirements and budget. Cloud being most popular option most of clients are preferring cloud solutions so that they don’t need to invest time in maintaining environments and installations.
With Wide adaption of SAP intelligent Enterprise SAP has introduce Business Application studio as a part of BTP as next generation for Web IDE. Developed for efficient development for business applications like Fiori, SAP Mobile Services, SAP Cloud Business Applications, SAP Fiori Elements, SAP S4HANA Extensions, Modelling and modelling work flows etc.
SAP Business Application Studio is an SAP Business Technology Platform service in the Cloud Foundry environment. It is built on open-source and leading industry standards and supports a modular approach to developing different kinds of apps.
To Model all these applications SAP offers Dev spaces which are like isolated virtual machines in the cloud. Each Dev space contains table tools and pre installed runtime sets which help in save time to setup dev environment, required 0 installation and maintenance.
Even though there are multiple Reporting tools available in SAP and Non SAP space like SAC, Power BI , tableu etc Fiori is mostly choose for embedded analytics reporting if client does not want to invest on additional tools and wanted to have unified view for reporting requirements. Even though Fiori has limitations in Reporting, using Analytical List pages lot of reporting requirements can be met. Using ALP provides ability to create an analytical dashboard with KPIs, charts, tables and also a drill-down navigation to a detail page.
ALP can be created using Manager KPI and Reports in Fiori applications but in case of any customizations and special requirement it might not work as expected. So business application studio can be used in such cases to customise Fiori apps. Report design can be divided between front end and back end. Here CDS is backend and Fiori is front end. Front end report design can be done in BAS (previously Web IDE) but it needs lot of customised coding in Java/XML etc but it is recommend to push maximum possible coding in CDS including Fiori front end design which can be achieved by UI annotations. Minimum code is required in BAS or very specific front end design which is not possible with CDS.
I will take an example to design and build ALP using CDS UI Annotations and Business Application Studio
ALP Report design has 3 sections
- Page Title
- Page Header
- Page Content
Page Title – Here can define page header and KPI’s
Below is sample CDS code to define Header using UI annotations in CDS
@UI: {
headerInfo: {
typeName: 'Report Title',
typeNamePlural: 'Report Title',
title: {
value: 'Report Title'
},
description: { value: 'Report Title' }
}
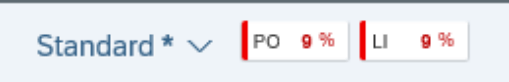
}This section also contains KPI tags and further can drill down to KPI Cards once you click on KPI which can further show some overview charts (if required). You can define these KPI and even highlight based on colours which can be defined by CDS annotations. In BAS just need to call KPI Indicators (which will be explained in BAS steps)
For KPI define below variants for in CDS view
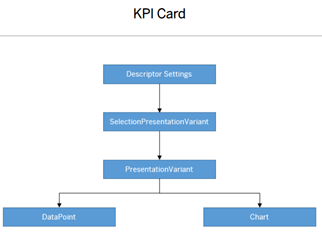
First define SelectionPresentationVariant then PresentationVariant and then you can define Datapoint or Chart as per your requirement. In my case I will define just Data Point.
As I have 2 KPI’s I have to define 2 Qualifiers for KPI. ALP looks for SelectionPresentationQualifier if not found it looks for Presentation qualifier so it is better to define it in CDS and select it BAS
@UI.presentationVariant: [{
       qualifier: 'KPIPOQualifier',
       text: 'KPI: KPIPOQualifier',
       visualizations: [{
           type: #AS_DATAPOINT,
           qualifier: 'KPIPOQualifier'
                        }]
                        },
        {
       qualifier: 'KPILineQualifier',
       text: 'KPI: KPILineQualifier',
       visualizations: [{
         type: #AS_DATAPOINT,
         qualifier: 'KPILineQualifier'
         }]
      }
Once you define SelectionPresentationQualifier in this step you have to define name of presentatiovariantqualifier as well as selection variant qualifiers name. In the next step we will define presentationvariant qualifiers where we can define Data point or chart with qualifier name
Next step is to define SelectionVariant qualifier
@UI.selectionVariant: [{
     qualifier: 'KPIPOQualifier',
     text: 'Default'
        },
        {
       qualifier: 'KPILineQualifier',
       text: 'Default'
        },
                ]
UI Annotations are defined above CDS view definition. How CDS will know which field is data point so inside define View section of CDS you need to define data point as below
@UI: {
dataPoint: {
title: 'PO',
valueFormat.numberOfFractionalDigits: 0,
minimumValue: 0,
maximumValue: 100,
criticalityCalculation: {
improvementDirection: #MAXIMIZE,
deviationRangeLowValue: 70,
toleranceRangeLowValue: 84
}
}
}
@AnalyticsDetails.query.axis: #COLUMNS
@AnalyticsDetails.query.decimals: 0
@EndUserText.label: 'KPIPOQualifier'
@AnalyticsDetails.query.formula: 'NDIV0( NODIM( $projection.KPI) / NODIM( $projection.Total))*HundredPercent '
1 as KPIPOQualifier,

@UI: {
dataPoint: {
title: 'LI',
valueFormat.numberOfFractionalDigits: 0,
minimumValue: 0,
maximumValue: 100,
criticalityCalculation: {
improvementDirection: #MAXIMIZE,
deviationRangeLowValue: 70,
toleranceRangeLowValue: 84
}
}
}

@AnalyticsDetails.query.axis: #COLUMNS
@AnalyticsDetails.query.decimals: 0
@EndUserText.label: 'KPILineQualifier'
@AnalyticsDetails.query.formula: 'NDIV0( NODIM( $projection.KPILi) / NODIM( $projection.TotalLine))*HundredPercent'
1 as KPILineQualifier
Page Header
ALP has 2 types of filters Compact Filter and Visual Filters. To define Compact filter you need to just define @UI.SelectionFields annotation
To define Visual filters need to define PresentationVariant and charts in CDS first and call those qualifiers in BAS
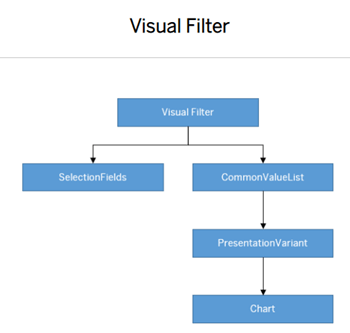
There are 3 visual filters in this example
Define filter qualifiers in PresentationVariant and visualization will be chart
@UI.presentationVariant: [{ {
qualifier: 'FilterMiss',
text: 'Filter: Miss',
visualizations: [{
type: #AS_CHART,
qualifier: 'ChartMiss'
}]
},
{
qualifier: 'FilterTime',
text: 'Filter: Time',
visualizations: [{
type: #AS_CHART,
qualifier: 'ChartTime'
}]
}, {
qualifier: 'FilterContract',
text: 'Filter: Contract',
visualizations: [{
type: #AS_CHART,
qualifier: 'ChartContract'
}]
},
Now define Dimension and measures used in the charts and type of chart in @UI.Chart annotation
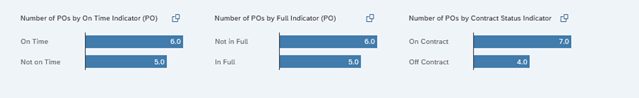
@UI.chart: [{
qualifier: 'ChartMiss',
chartType: #BAR,
dimensions: [ 'OnTimePO' ],
measures: [ 'CountPO' ],
dimensionAttributes: [{
dimension: 'OnTimePO',
role: #CATEGORY
}],
measureAttributes: [{
measure: 'CountPO',
role: #AXIS_1
}]
},
{
qualifier: 'ChartTime',
chartType: #BAR,
dimensions: [ 'FullIndicator' ],
measures: [ 'CountPO' ],
dimensionAttributes: [{
dimension: 'FullIndicator',
role: #CATEGORY
}],
measureAttributes: [{
measure: 'CountPO',
role: #AXIS_1
}]
},
{
qualifier: 'ChartContract',
chartType: #BAR,
dimensions: [ 'Status' ],
measures: [ 'CountPO' ],
dimensionAttributes: [{
dimension: 'Status',
role: #CATEGORY
}],
measureAttributes: [{
measure: 'CountPO',
role: #AXIS_1
}]
},Page Content
Page content has 2 sections chart and table. In this chart only or table only view also available. Need to define below variants for chart and tables
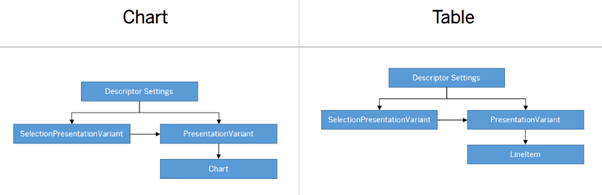
Below is main chart for which needs to define PresentationVariant and then Chart annotations
For Content chart define qualifier under @UI.selectionPresentationVariant to call PresentationVariant and SelectionVariant qualifiers
{
qualifier: 'Default',
presentationVariantQualifier: 'Default',
selectionVariantQualifier: 'Default'
}
And define chart as type and chart qualifier in @UI.presentationVariant
{
qualifier: 'Default',    //Qualifier for ALP content chart section (chart above)
visualizations: [{
type: #AS_CHART,
qualifier: 'ChartDefault'
}]
}
]
Below will define chart dimensions and measures using @UI.Chart
qualifier: 'ChartDefault',
chartType:#COLUMN,
dimensions: [ 'YearMonth' ],
measures: [ 'PO','Line','MissPer'],
dimensionAttributes: [{
dimension: 'YearMonth',
role: #CATEGORY
}],
measureAttributes: [{
measure: 'MissPer',
role: #AXIS_2
},
{
measure: 'Line',
role: #AXIS_1
},
{
measure: 'PO',
role: #AXIS_1
}
]
}
]For Table just need to define LineItem in CDS
@UI.lineItem.position: 10
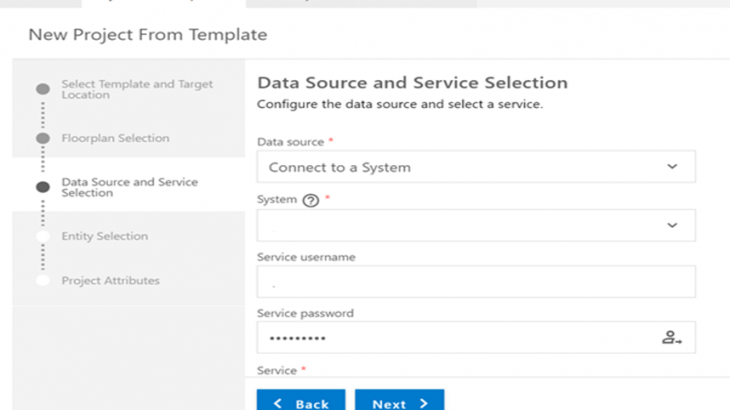
Purchase Order IDAfter defining variants in CDS you need to call these qualifiers in BAS. Before doing that you need to create a Project in BAS.
Open BAS URL and login to Space and click on Project From template
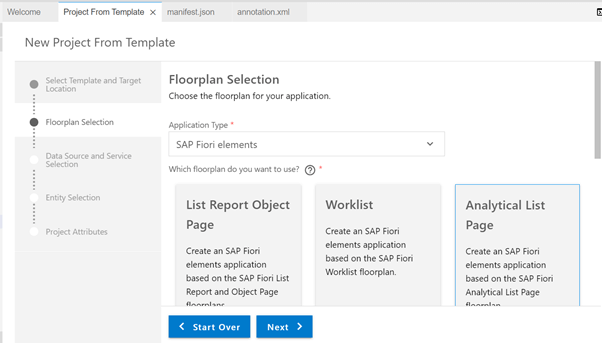
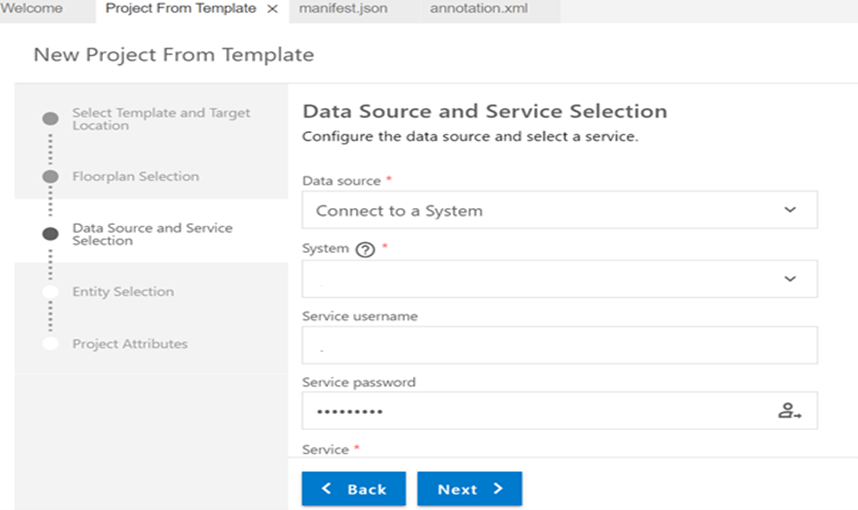
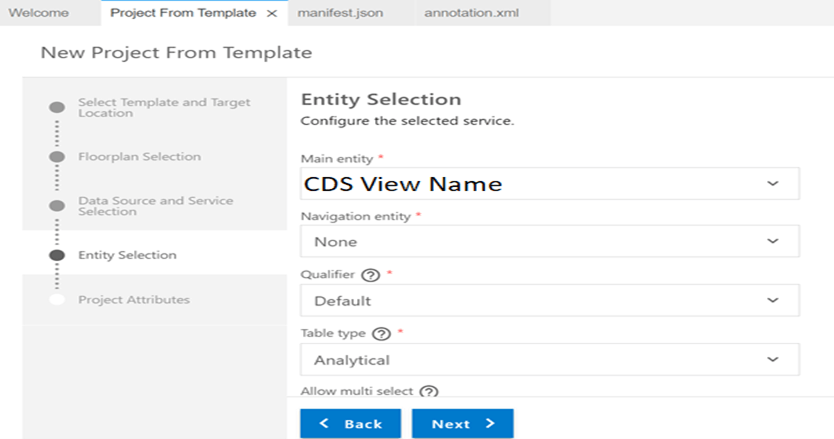
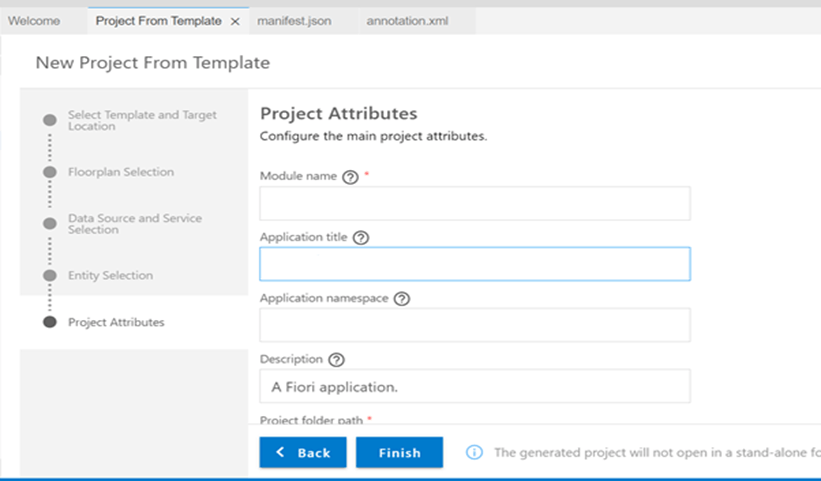
Define name of App and Click on Finish
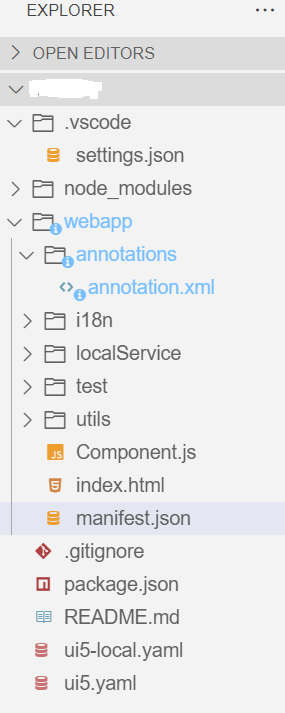
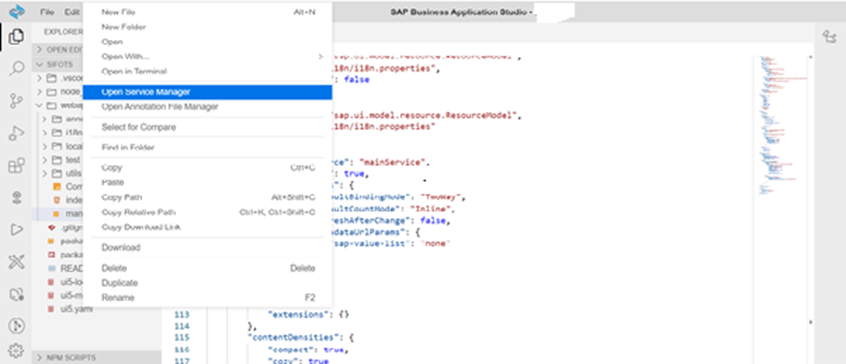
Once project is created in BAS . you need to open workspace and Project then in editor will get web app files like Annotations.xml and Manifest.json files . In these files you need to call various qualifiers and define some code
Now the KPI’s defined in CDS UI annotations need to be called in BAS. Open Manifest.json file and search KeyPerformanceIndicators
"keyPerformanceIndicators": {
"POQualifier": {
"model": "kpiModel",
"entitySet": "CDS View NAME", // Name of CDS view
"qualifier": "POQualifier"
},
"LineQualifier": {
"model": "kpiModel",
"entitySet": "CDS View NAME", // Name of CDS view
"qualifier": "LineQualifier"
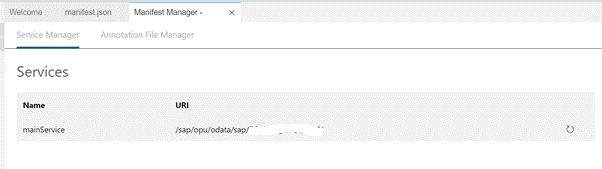
}Do not forget to refresh mainService
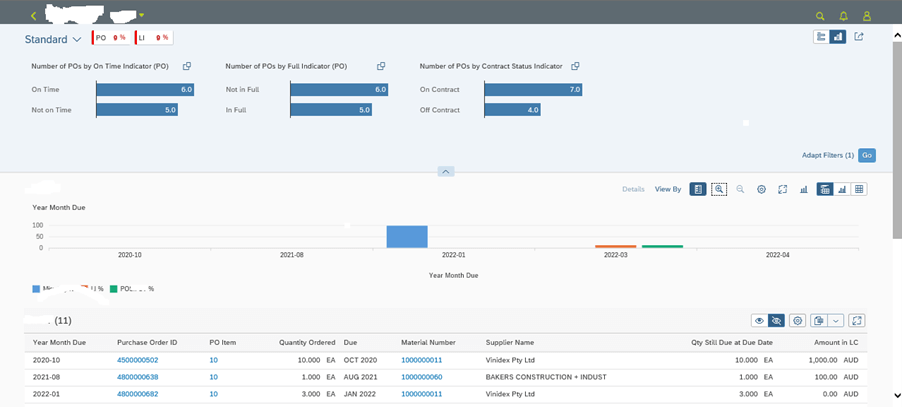
In Preview Application now KPI tags will be added
Check Annotation.xml file in BAS and update field details
<edmx:Edmx xmlns:edmx="http://docs.oasis-open.org/odata/ns/edmx" Version="4.0">
<edmx:Reference Uri="https://sap.github.io/odata-vocabularies/vocabularies/Common.xml">
<edmx:Include Namespace="com.sap.vocabularies.Common.v1" Alias="Common" />
</edmx:Reference>
<edmx:Reference Uri="https://sap.github.io/odata-vocabularies/vocabularies/UI.xml">
<edmx:Include Namespace="com.sap.vocabularies.UI.v1" Alias="UI" />
</edmx:Reference>
<edmx:Reference Uri="https://sap.github.io/odata-vocabularies/vocabularies/Communication.xml">
<edmx:Include Namespace="com.sap.vocabularies.Communication.v1" Alias="Communication" />
</edmx:Reference>
<edmx:Reference Uri="/sap/opu/odata/sap/CDS View Name/$metadata">
<edmx:Include Namespace=" CDS View Name " Alias="SAP" />
</edmx:Reference>
<edmx:DataServices>
<Schema xmlns="http://docs.oasis-open.org/odata/ns/edm" Namespace="com.xx.ri11.xxxx">
<Annotations Target="SAP. CDS View NameType">
<Annotation Term="UI.SelectionFields">
<Collection>
<!-- remove/comment CreationDate or DateRangeCustomFilter.fragment.xml won't work!
<PropertyPath>CreationDate</PropertyPath> -->
<PropertyPath>Supplier</PropertyPath>
<PropertyPath>OnTimePO</PropertyPath>
<PropertyPath>FullIndicator</PropertyPath>
<PropertyPath>Status</PropertyPath>
<PropertyPath>MatGroup</PropertyPath>
</Collection>
</Annotation>
<Annotation Term="UI.KPI" Qualifier="POQualifier">
<Record>
<PropertyValue Property="DataPoint" Path="@UI.DataPoint#KPIPOQualifier" />
<PropertyValue Property="SelectionVariant" Path="@UI.SelectionVariant#KPIPOQualifier" />
<PropertyValue Property="ID" String="POQualifier" />
<PropertyValue Property="Detail">
<Record Type="UI.KPIDetailType">
<PropertyValue Property="SemanticObject" String="test" />
<PropertyValue Property="Action" String="test" />
<PropertyValue Property="DefaultPresentationVariant" Path="@UI.PresentationVariant#KPIPOQualifier" />
</Record>
</PropertyValue>
</Record>
</Annotation>
<Annotation Term="UI.KPI" Qualifier="LineQualifier">
<Record>
<PropertyValue Property="DataPoint" Path="@UI.DataPoint#KPILineQualifier" />
<PropertyValue Property="SelectionVariant" Path="@UI.SelectionVariant#KPILineQualifier" />
<PropertyValue Property="ID" String="LineQualifier" />
<PropertyValue Property="Detail">
<Record Type="UI.KPIDetailType">
<PropertyValue Property="DefaultPresentationVariant" Path="@UI.PresentationVariant#KPILineQualifier" />
</Record>
</PropertyValue>
</Record>
</Annotation>
</Annotations>
<Annotations Target="SAP. CDS View Name Type/Status">
<!-- Annotation WITHOUT QUALIFIER for Compact Filter, supplied by Backend(CDS) already-->
<!-- Annotation WITH QUALIFIER for Visual Filter -->
<Annotation Term="Common.ValueList" Qualifier="ChartMiss">
<Record Type="Common.ValueListType">
<PropertyValue Property="CollectionPath" String=" CDS View Name " />
<PropertyValue Property="PresentationVariantQualifier" String="FilterContract" />
<PropertyValue Property="Parameters">
<Collection>
<Record Type="Common.ValueListParameterInOut">
<PropertyValue Property="LocalDataProperty" PropertyPath="Status" />
<PropertyValue Property="ValueListProperty" String="Status" />
</Record>
</Collection>
</PropertyValue>
</Record>
</Annotation>
</Annotations>
<Annotations Target="SAP. CDS View Name Type/OnTimePO">
<!-- Annotation WITHOUT QUALIFIER for Compact Filter, , supplied by Backend(CDS) already -->
<!-- Annotation WITH QUALIFIER for Visual Filter -->
<Annotation Term="Common.ValueList" Qualifier="ChartMiss">
<Record Type="Common.ValueListType">
<PropertyValue Property="CollectionPath" String=" CDS View Name " />
<PropertyValue Property="PresentationVariantQualifier" String="FilterMiss" />
<PropertyValue Property="Parameters">
<Collection>
<Record Type="Common.ValueListParameterInOut">
<PropertyValue Property="LocalDataProperty" PropertyPath="OnTimePO" />
<PropertyValue Property="ValueListProperty" String="CountPO" />
</Record>
</Collection>
</PropertyValue>
</Record>
</Annotation>
</Annotations>
<Annotations Target="SAP. CDS View Name Type/FullIndicator">
<Annotation Term="Common.ValueList" Qualifier="ChartTime">
<Record Type="Common.ValueListType">
<PropertyValue Property="CollectionPath" String=" CDS View Name " />
<PropertyValue Property="PresentationVariantQualifier" String="FilterTime" />
<PropertyValue Property="Parameters">
<Collection>
<Record Type="Common.ValueListParameterInOut">
<PropertyValue Property="LocalDataProperty" PropertyPath="FullIndicator" />
<PropertyValue Property="ValueListProperty" String="CountPO" />
</Record>
</Collection>
</PropertyValue>
</Record>
</Annotation>
</Annotations>
</Schema>
</edmx:DataServices>
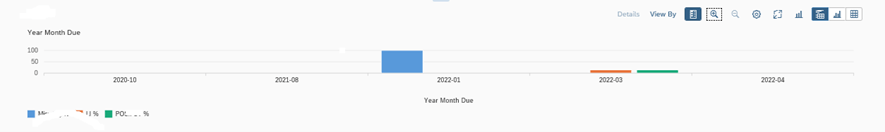
</edmx:Edmx>Finally once you run the ALP app from preview you will get below output

This BAS code can be downloaded and published on cloud and can be added as Fiori tile for end user.


