In a dynamic landscape dominated by data-driven decision-making, monitoring your performance is crucial. And if you learn how to strengthen data management practices with respect to your performance, your business is going to thrive and avoid pitfalls. When it comes to SAP Analytics Cloud (SAC), ensuring peak performance isn’t just a matter of preference—it’s a strategic necessity. In this blog, we delve into the significance of SAC performance analysis, exploring its benefits and why it’s a critical aspect of maximizing the potential of your analytics platform.
Understanding SAC Performance Analysis
Performance analysis in SAC encompasses an array of metrics, including stability, speed, scalability, and responsiveness. Essentially, it’s about how efficiently the platform handles workloads, from loading dashboards to executing queries.
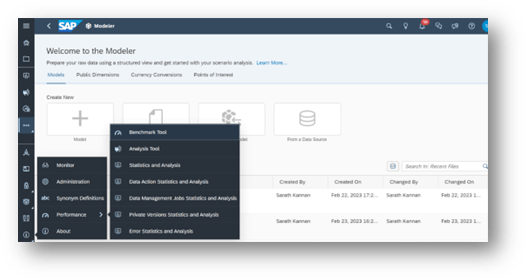
You can access it by, Choose System > Performance
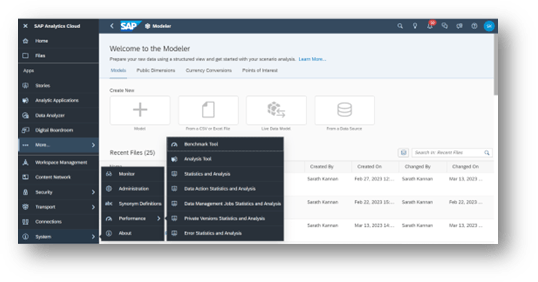
And there are some tools that can help you with the whole performance analysis paradigm. Let’s discuss them.
Measurement Tool
The Measurement Tool within SAC serves as a compass for gauging your system’s performance. By assessing factors like client time, network latency, and SAC responsiveness, it provides valuable insights into areas that demand improvement. The normalized scores generated by the Measurement tool offer a Measurement against best practices, guiding optimization efforts effectively.
The Measurement Tool tab consists of two Performance tests which are Client test and Network test.
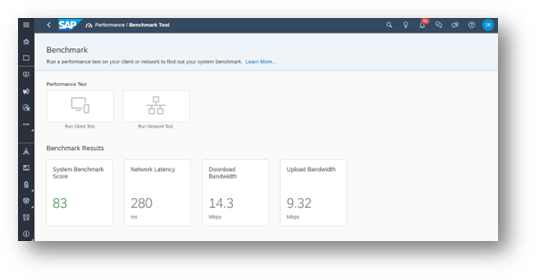
(The above test is done in our internal system where Client score is 83 and Network latency is 280ms.)
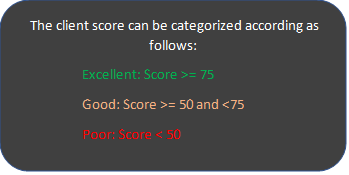
- The client Measurement tool calculates a normalized score that can be compared against best practices.
- Network tests are essential for measuring client latency and bandwidth to the SAP Analytics Cloud Service.
- Both CPU-intensive applications and network performance significantly impact load times for Stories and Analytic Applications.
- It is crucial to be mindful of these factors to ensure optimal system performance.
Performance Analysis Tool
SAC’s Performance Analysis Tool revolutionizes the way administrators monitor system performance. Gone are the days of grappling with complex tools and manual data interpretation. This tool automates the collection and storage of performance information, empowering administrators to identify and resolve issues swiftly. With features like Page Load Time and Widget Drilldown, administrators can pinpoint bottlenecks and optimize performance at a granular level.
To begin using the tool, you can narrow down your search criteria by specifying a combination
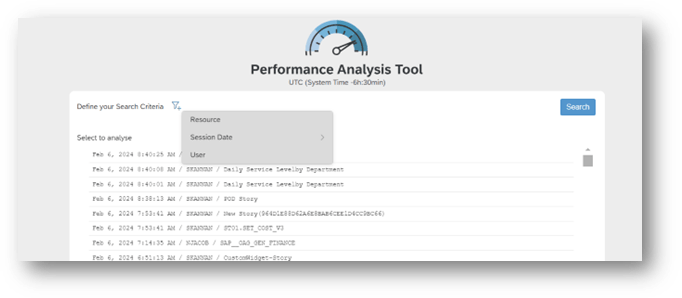
of Date, Resource, and/or User.
- we have a selected a Resource and chosen a story
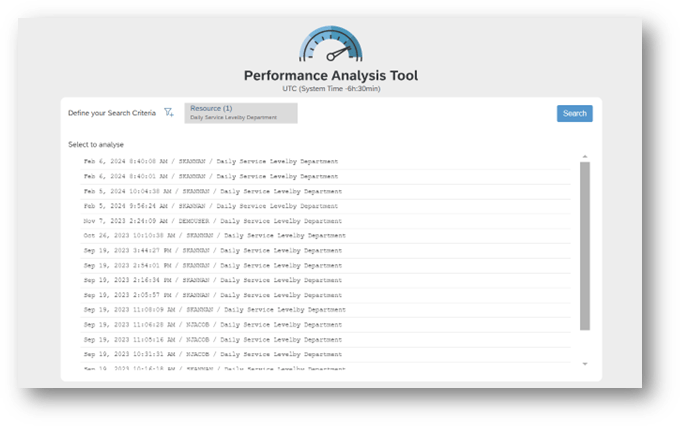
- We have used the below story for demonstrating Performance analysis tool
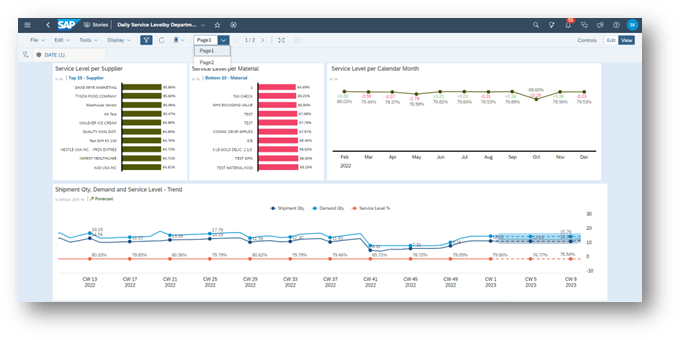
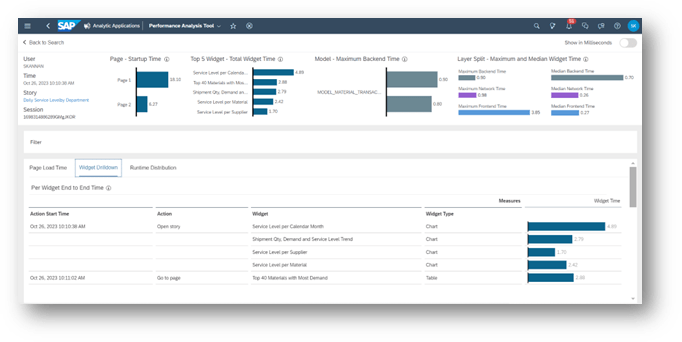
- Upon selecting the Story that we want to analyze; we have presented with the initial view of Performance analysis tool.
- The tool calculates the time at which pages, widgets, and model but no specific methods are there to control load time.
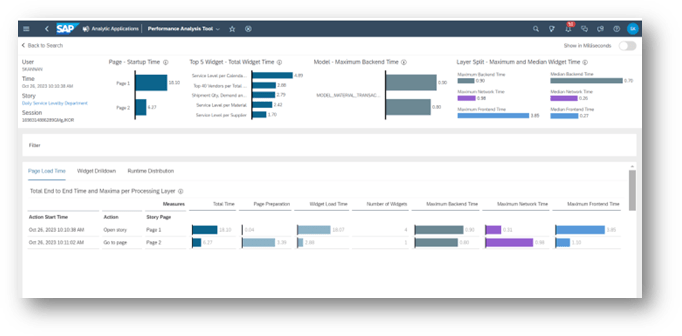
Page Load Time
- It’s mainly used to dig deeper into the story by looking at widgets, models, and pages. It gives a list of items sorted by how long they take to load, starting with the slowest.
- It displays time for Pages in a deeper level like page preparation time. Maximum/Minimum backend time etc.
Widget Drilldown
- It is used to drill down the widget wise measure’s which is used to calculate Widget time, Network time and Backend time like shown in the below image
- When clicking any particular widget or action it pops up a certain window that displays the front-end time, connected Model and Backend Request.
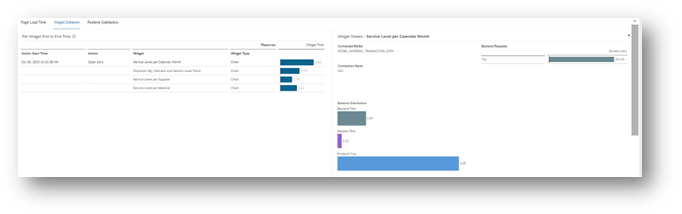
- If any particular widget is selected it changes the below graph which calculates Median backend time, Median Network time, Median Frontend Time.
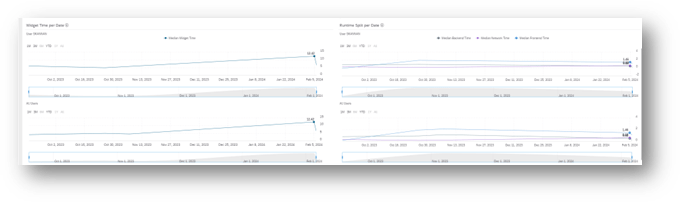
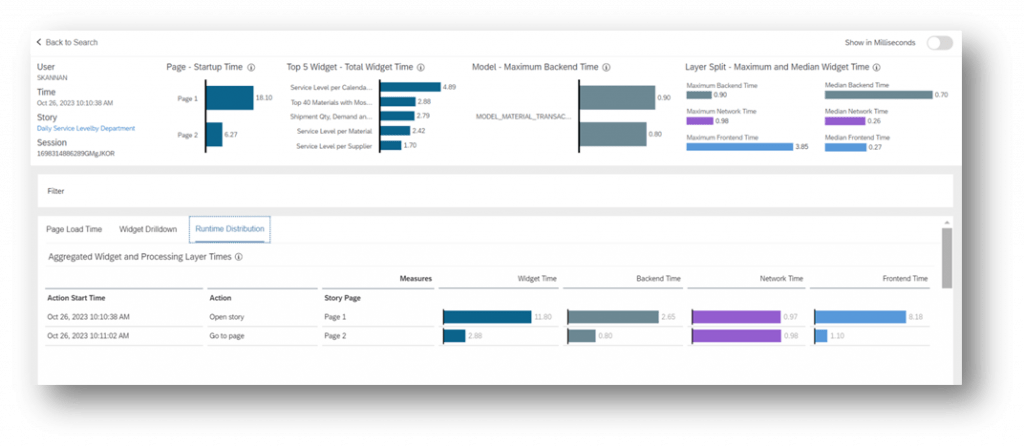
Runtime Distribution
- Below image shows the runtime distribution. It displays time for widget, backend, network, frontend.
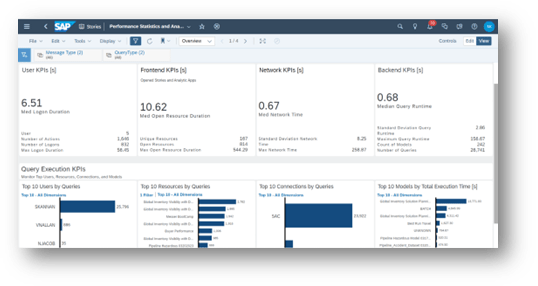
Unveiling Insights with Statistics and Analysis
The Statistics and Analysis tool in SAC bridges the gap between technical backend operations and user-facing frontend experiences. By providing comprehensive statistical analysis, it offers a holistic view of system performance. From backend query execution times to frontend load times, this tool equips administrators with the insights needed to fine-tune performance across the board.
- The Overview Page displays KPIs for Number of Logons, Frontend and Backend Kpi’s as well as Top 10 Users by Logon Time and Top 10 Stories by Load Time.
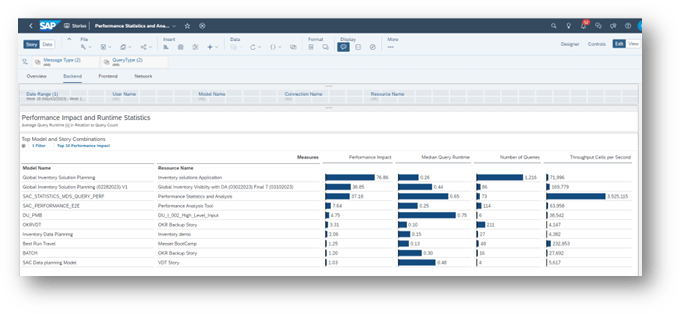
- In SAP Analytics Cloud, a model can be used in multiple stories. Sometimes, the model itself works fine, but when combined with a specific story, it can cause performance issues. We identify these combinations that have the most impact on the backend system. This helps us understand which specific combinations of models and stories might be causing slowdowns or other problems in the system.
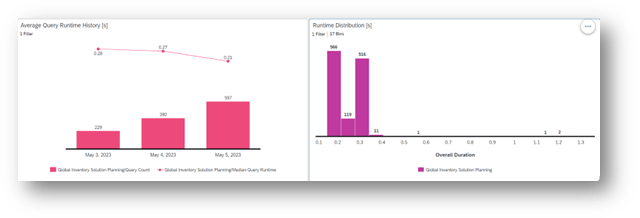
- We use this charts to see how quickly query get answers and how many times they have run over time. We also check where the time goes in the process of running this query. This helps us understand how well the query are doing and if they’re getting faster or slower over time
The Importance of SAC Performance Analysis
In today’s data-centric landscape, SAC performance analysis isn’t just a nicety—it’s a necessity. Here’s why:
- Optimized Efficiency: By identifying and rectifying performance bottlenecks, SAC performance analysis streamlines operations, ensuring optimal efficiency.
- Enhanced User Experience: A responsive and stable SAC platform translates to a seamless user experience, fostering user adoption and satisfaction.
- Cost Savings: Proactive performance analysis helps mitigate the risk of system downtime and inefficiencies, ultimately resulting in cost savings for organizations.
- Data-Driven Decision Making: With SAC performing at its peak, organizations can trust the accuracy and timeliness of the insights derived, facilitating informed decision-making.
- Competitive Advantage: Leveraging SAC performance analysis to continuously optimize the platform provides organizations with a competitive edge, enabling them to stay ahead in today’s dynamic business landscape.
In conclusion, SAC performance analysis isn’t just a technical endeavor—it’s a strategic imperative. By harnessing the power of performance analysis tools, organizations can unlock the full potential of SAC, driving innovation, efficiency, and success.
So, embark on the journey of SAC performance analysis today, and witness firsthand the transformative impact it can have on your organization’s analytical capabilities and bottom line.


