The SAP HANA supportability toolset provides a consolidated set of tools for performance analysis and troubleshooting.
The tool is available as an extension for Microsoft Visual Studio Code and includes a range of reports that can be used for online and offline analysis.
Key Value
Simple
The tool integrates SAP HANA database knowledge from SAP notes and SAP HANA database experts.
User could analyze HANA Database related issue much easier.
Consolidate
The tool supports both online analysis and offline analysis. User could do analysis based on monitoring views, statistics tables which needs database access and also based on trace logs which doesn’t need database access.
The tool utilizes all the information available for analysis purpose.
Analysis Flow
User could use the tool starting from pin pointing issue to root cause analysis, all steps in one tool.
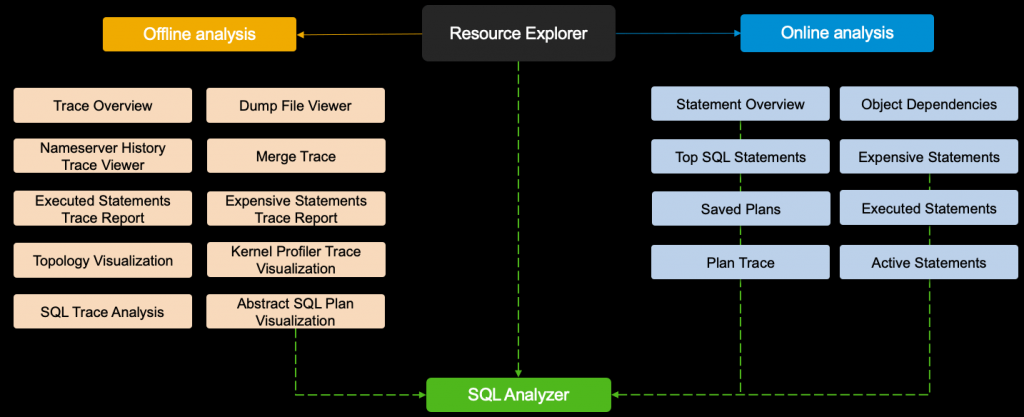
Feature Summary
An overview of the tools and features available is shown below:
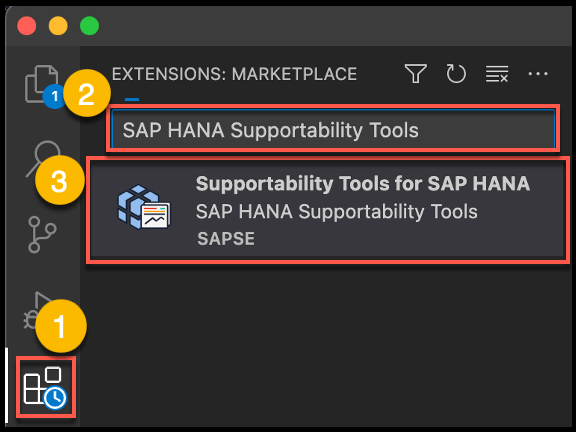
How to Install
The SAP HANA supportability tools need to be installed as an extension in Microsoft Visual Studio Code.
Getting Started
Create a Work Folder
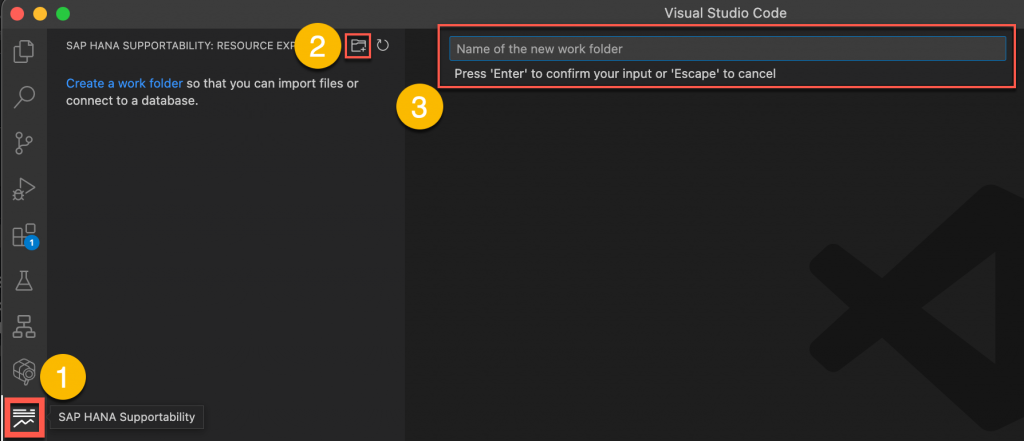
To work in offline analysis mode, you require at least one work folder to be able to import your folders and files. In the Resource Explorer, create a work folder and then import a folder or file, for example, a full system information dump (FSID) file.
1. Create a folder
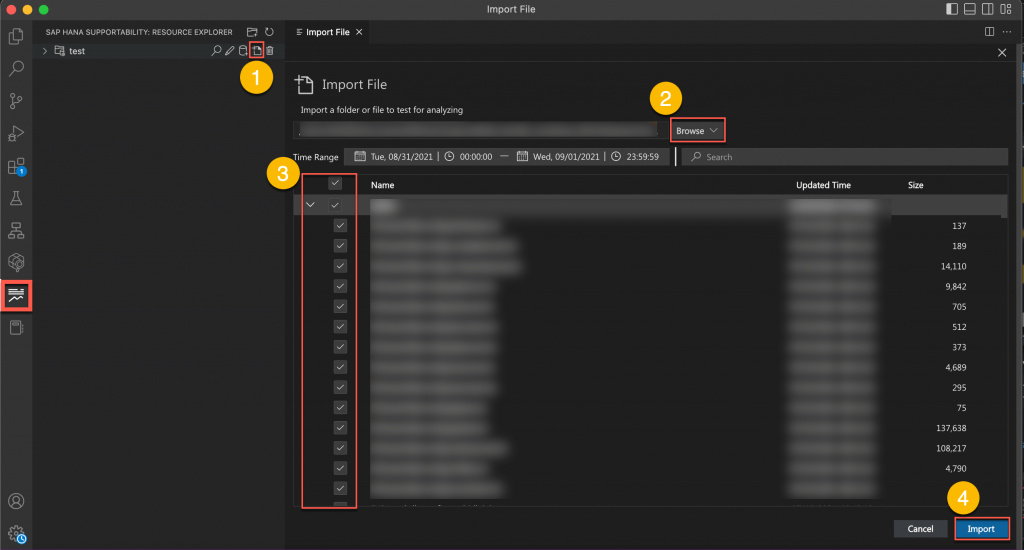
2. Import file to the created “test” folder
Connect a Work Folder to an SAP HANA Database
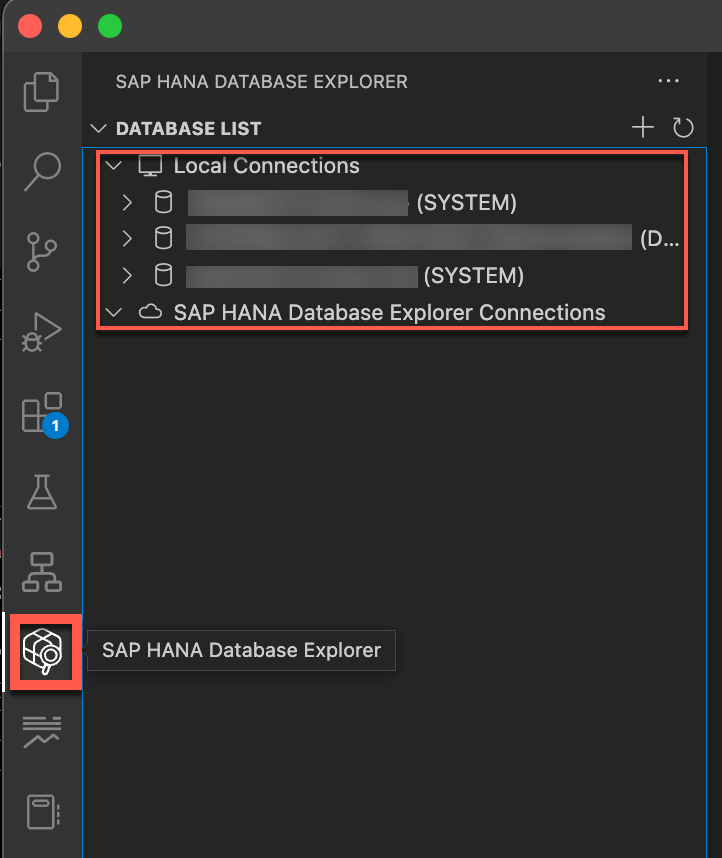
To use the online features in the SAP HANA supportability tools, you must connect a work folder to an SAP HANA system. You can use the SAP HANA Database Explorer extension to manage a list of database connections.
You can manage and use connections as follows:
1. In the SAP HANA Database Explorer extension, manage a list of database connections.
2. In the SAP HANA supportability tools, connect a work folder to an SAP HANA database by selecting one of the defined connections from the database list.
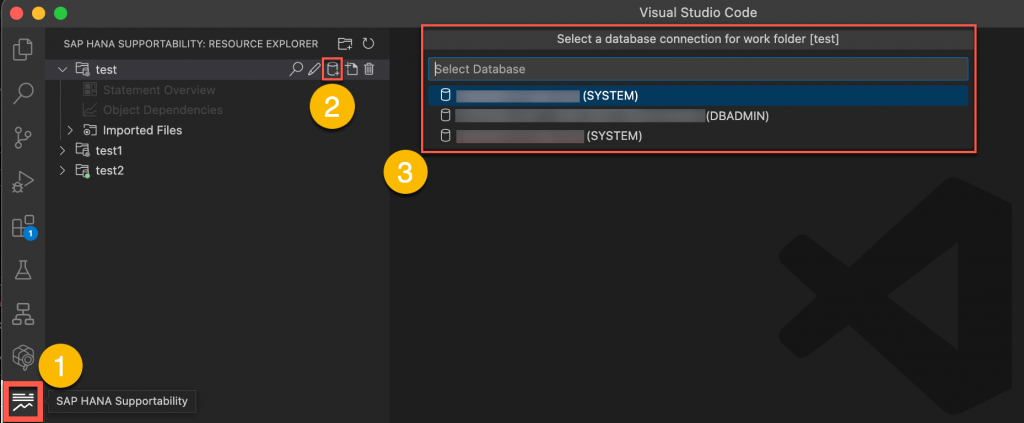
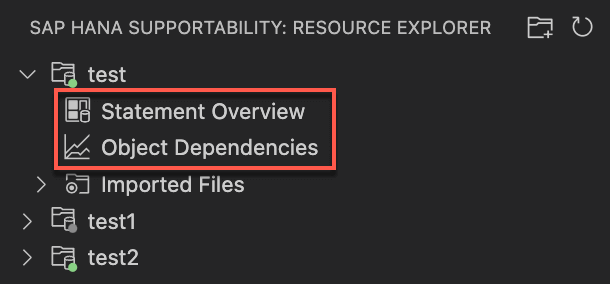
3. Statement Overview page and Object Dependencies page are enabled after connecting to a SAP HANA database
Here’s a short demonstration of create a work folder, import files to work folder and connect to a work folder to a SAP HANA database:
Welcome Page
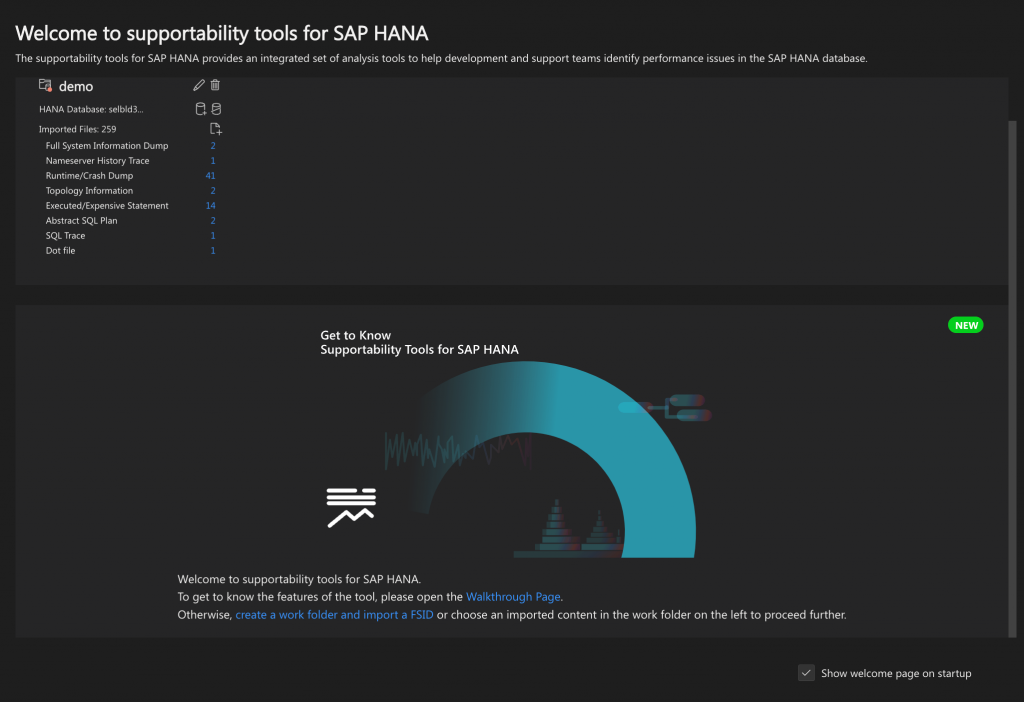
The welcome page provides you with an overview of your work folders and allows you to access the walkthrough page to quickly learn the tool’s features and functionalities.
The welcome page is displayed when you open the supportability tools for SAP HANA or enter welcome in View Command Palette and select Supportability tools for SAP HANA: Show Welcome Page.
The welcome page dashboard is composed of two main sections:
Work Folders
Your individual work folders are listed as cards.
Get to Know the Supportability Tools for SAP HANA
Select Walkthrough Page to get an overview of the features available in the tool. The walkthroughs let you become familiar with the different functions and easily navigate through the tool.
Online Analysis
Statement Overview
The statement overview provides the most relevant and important information about the top SQL statements in the database. The results of the individual reports are presented in a visualized form, making it easier to identify critical statements and determine the source of a problem.
Starting from the top SQL statements, the reports let you navigate down into the specific statement details. You can customize the time range and you can select various key figures for the analysis.
The following reports are available, each shown on a separate tab:
- Top SQL
- Expensive Statements
- Executed Statements
- Active Statements
- Plan Trace
- Plan Stability
The statement overview is only available in online mode, that is, when the work folder is connected to an SAP HANA database. For more information, see Connect a Work Folder to a Database.
Top SQL
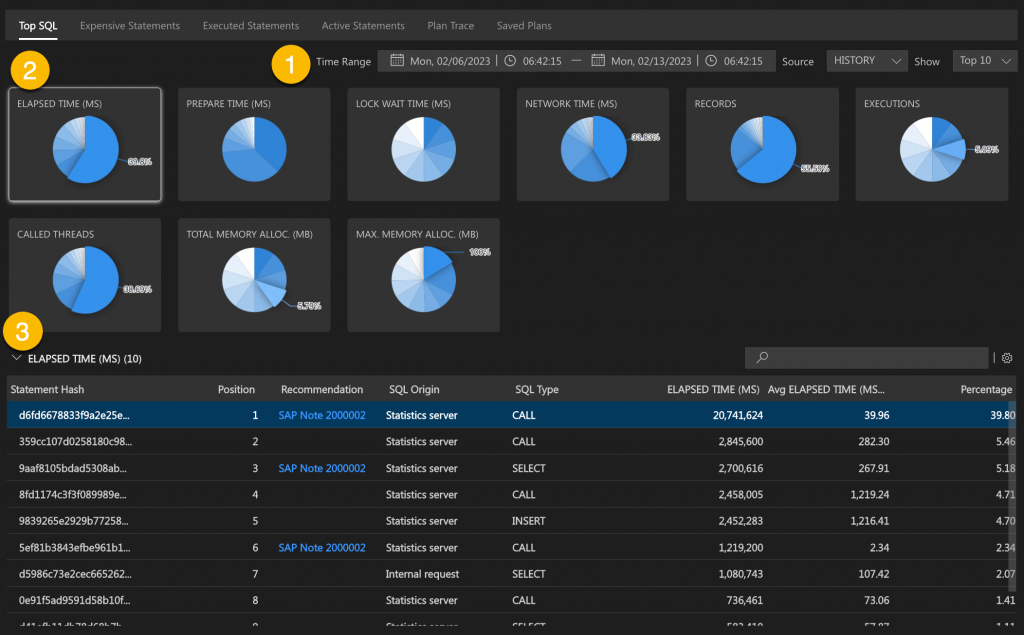
The Top SQL page lets you analyze the most critical SQL statements running in the database. The report lists the top SQL statements in terms of different key figures, such as elapsed time, number of executions, or memory consumption.
- In the toolbar of the Top SQL statement page, select the time range, in the Source dropdown list, select a source depending on whether the SQL statement issues are in the past or present, in the Show dropdown list, specify a Top N selection.
- Use the pie chart to select a KPI.
- The selected KPI filters the data of the TOP N rows and displays the resulting dataset as a table.
You can select a row in the table to display details about the selected statement in the specific sections below.
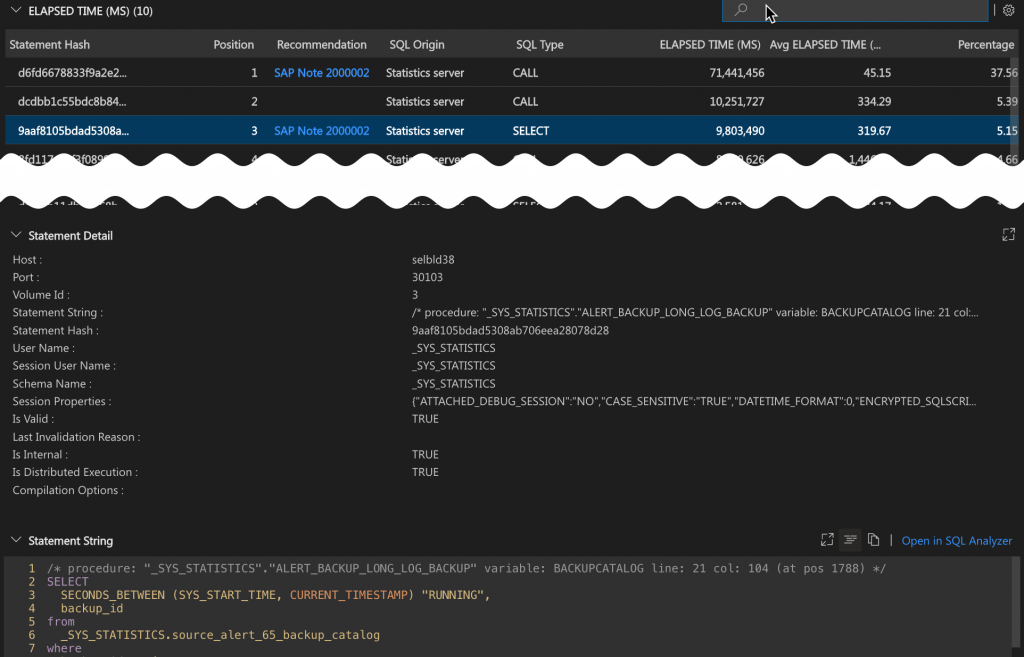
Statement Detail
In this section, review the detailed information about the selected statement. The source of the data is the system view SYS.M_SQL_PLAN_CACHE.
Statement String
In this section, review the full statement string of the selected statement. Click Open in SQL Analyzer to visualize the SQL statement from the current cached plan in the SQL analyzer.
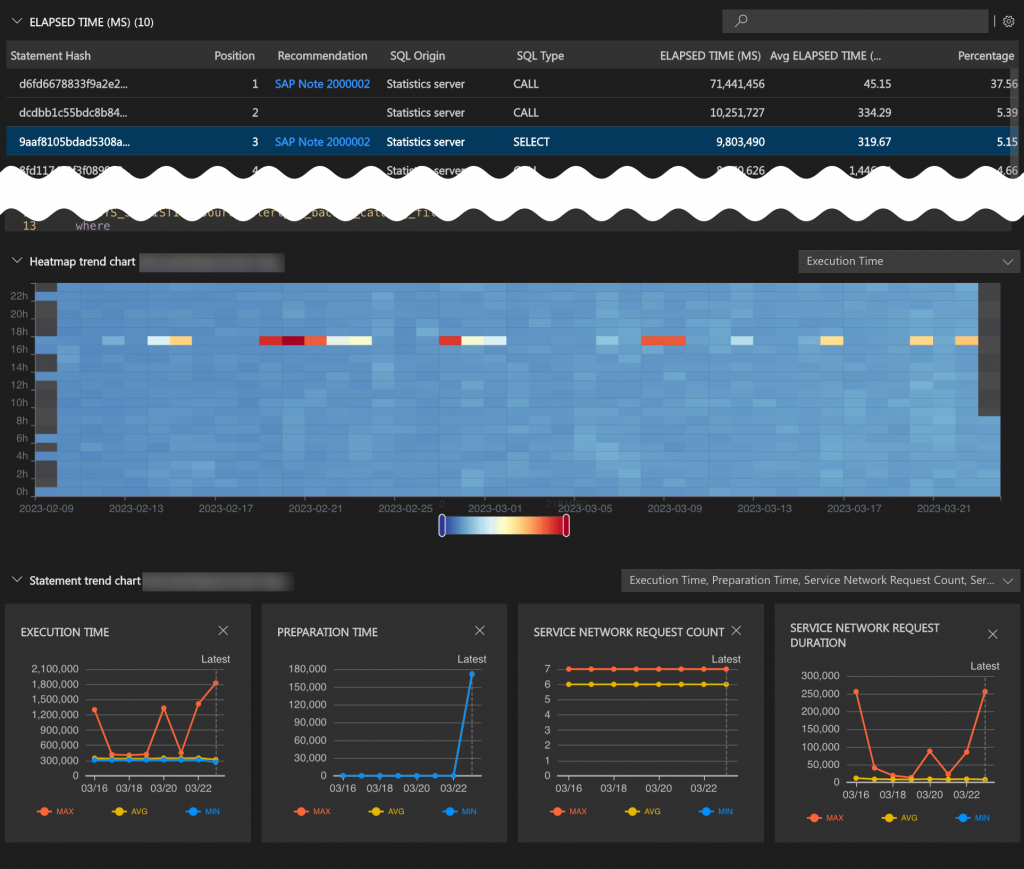
Heatmap trend chart
In this section, view the heatmap trend chart of the selected statement. The historical plan cache statistics are taken from the _SYS_STATISTICS.HOST_SQL_PLAN_CACHE view.
Statement trend chart
In this section, view the plan cache history of the selected statement for the last 7 days. By default, the following charts are displayed: Execution time, Preparation Time, Service Network Request Count, and Service Network Request Duration. The trend charts show the minimum, maximum, and average statistics for a predefined set of values.
Object Dependency Visualization
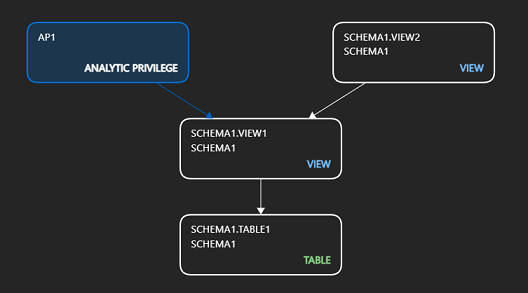
The object dependency viewer provides a visualization of database objects and their object dependency hierarchy, making information otherwise only available in tabular form easier to understand.
The object dependency viewer provides a graph structure showing the object dependency chains of tables, views, and stored procedures. It includes any assigned analytic privileges and provides their details in separate nodes (shown in blue). A simple example is shown below:
The object dependency viewer is only available in online mode, that is, when the work folder is connected to an SAP HANA database. For more information, see Connect a Work Folder to a Database.
You can export an object dependency graph as a DOT file for offline analysis.
Offline Analysis
Trace Overview
The trace overview provides an overview of the imported traces of full system information dump (FSID) files. The report evaluates the current system status information from the dump files and provides the traces in a merged form for each component of the database.
The trace overview provides the following sections:
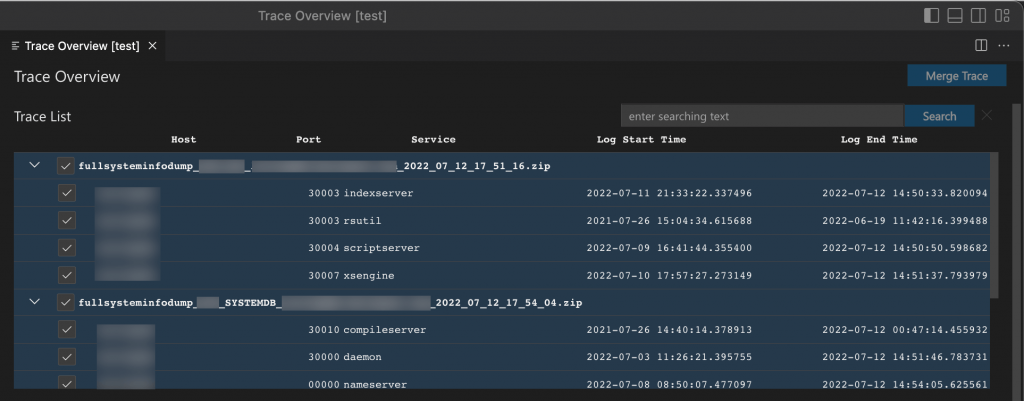
Trace List
The trace list table provides a hierarchical view of the imported FSID (full system information dump) files, listing the imported root and the contained trace information. The imported trace information is provided as a merged form of the traces. The host, port, and service information indicates from where the trace was generated. The log start time and log end time information gives the start and end times of the merged chunks. For example, the index server trace for a certain port has multiple chunks, but the table shows a single row with a start and end time within the entire trace chunk.
One or more traces can be selected in the table to see the occurrences in the component occurrence section or to merge the trace. A keyword-based trace file search can be used to filter the list.
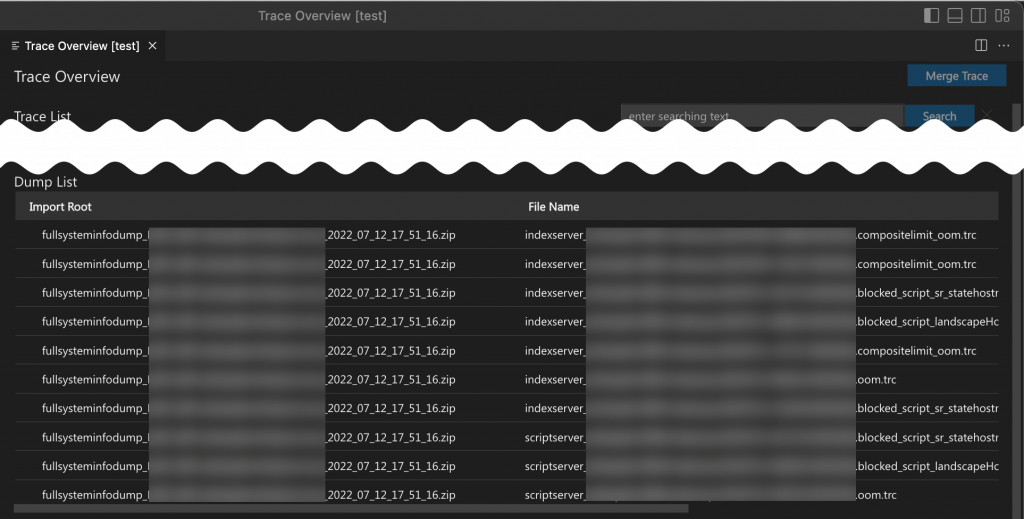
Dump List
This list shows the runtime dumps and crash dumps if dumps exist in the imported FSID files. If there are no dumps, this section is not shown. If dumps exist, the dump files are listed with their generation time and issue type.
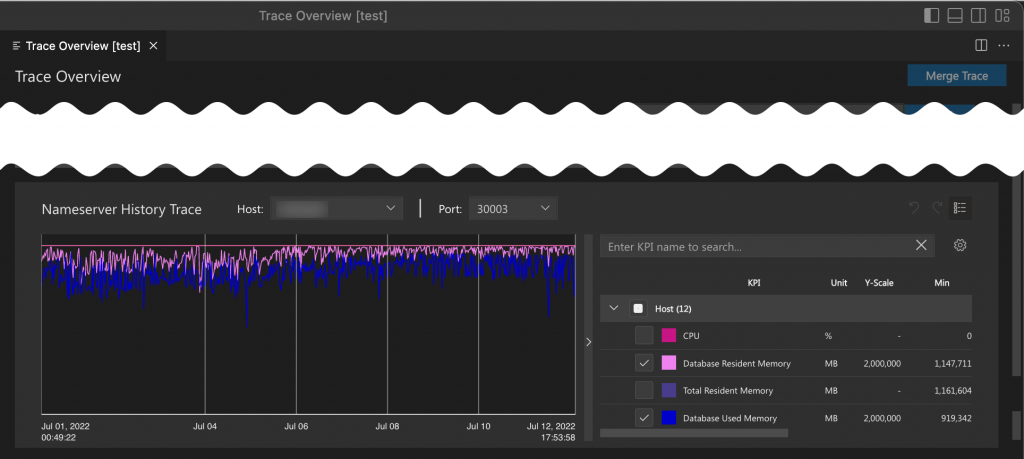
Nameserver History Trace
If the FSID file of a system database has been imported, the nameserver history trace view section visualizes the related nameserver_history.trc file. It can be used to find a suspicious point by narrowing down the time range. The selected time range is synchronized with the component occurrence section.
The contents can also be updated by selecting other hosts or ports. The host dropdown lists all hosts of the imported trace files, and the port dropdown lists all ports of the selected host.
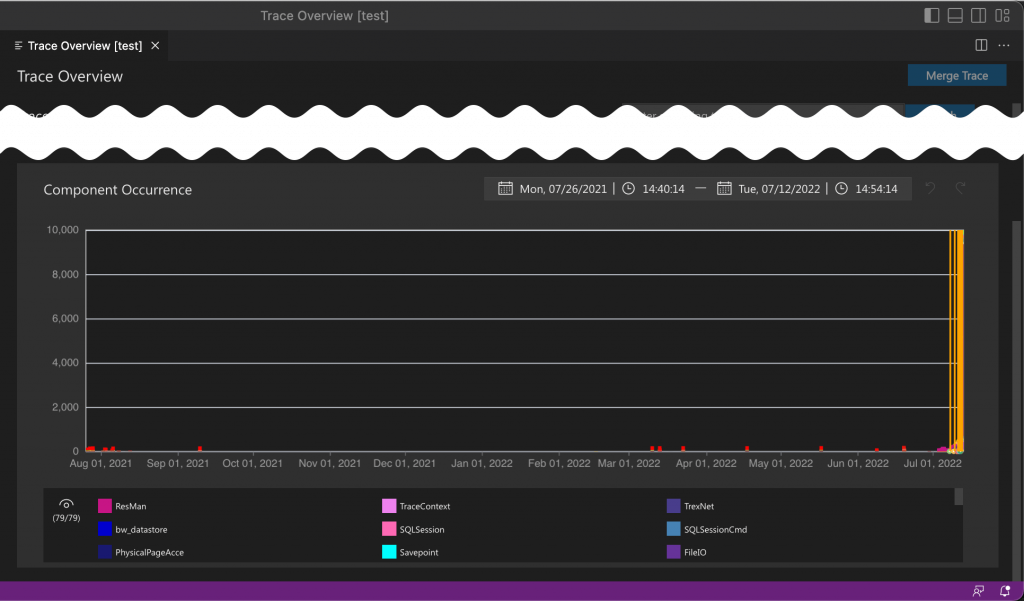
Component Occurrence
A stacked bar chart is used in this section to show how many trace rows were generated by which components during the available time range of the selected traces in the trace list section. The y-axis describes the number of trace rows that come from a specific component. If there are any dumps, the chart provides a vertical indicator (red arrow) showing the dump generation time and its name. A double-click on the indicator opens the dump file viewer for further analysis of the applicable dump file.
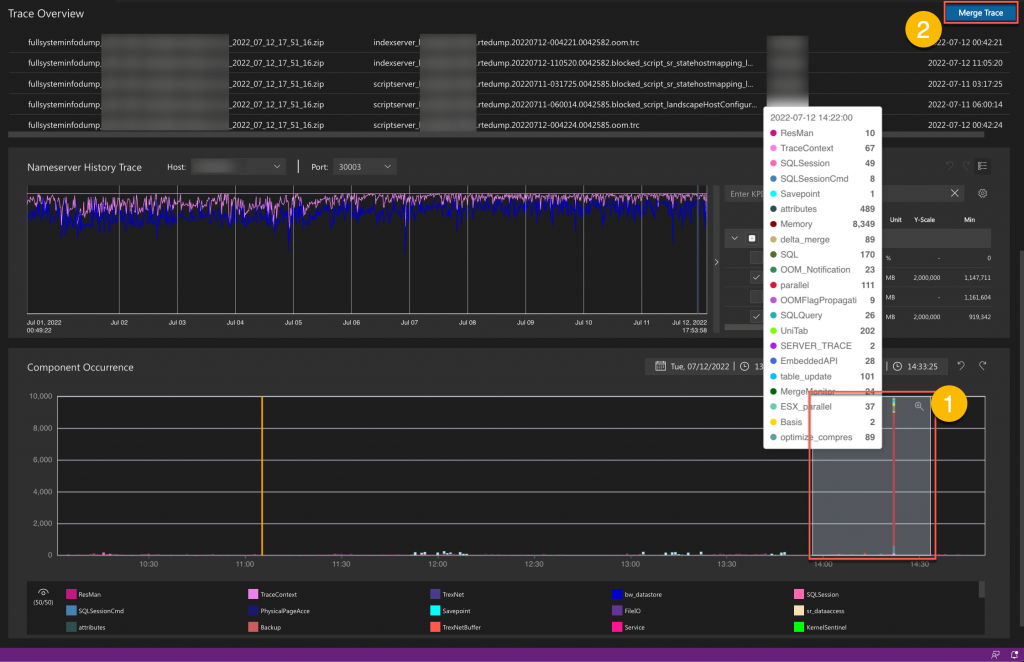
Merge Trace
Optionally use the merge trace feature by selecting traces in the trace list and a certain time range in component occurrence to merge the traces stacked in the selected service level with the given time range.
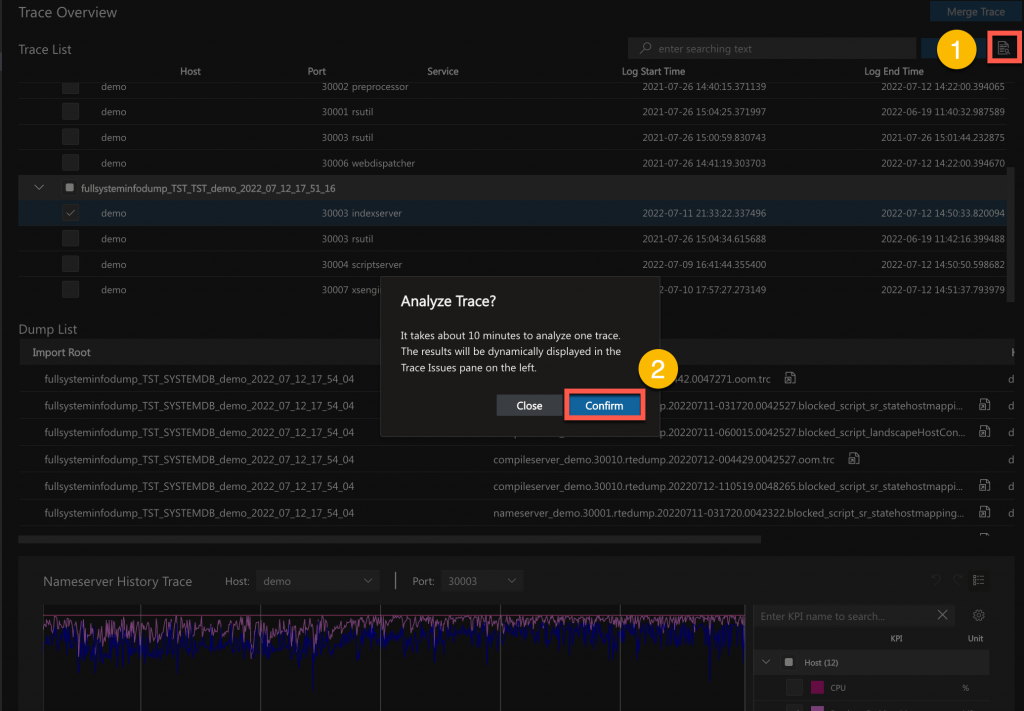
Analyze Trace(automatically detect known issues)
Use the analyze trace feature to automatically detect known issues in trace files documented in SAP note 2380176 FAQ: SAP HANA Database Trace.
- Click Analyze Trace button.
- Click Confirm on the pop up window.
Dump File Viewer
The dump file viewer lets you analyze dump files to help troubleshoot the causes of error situations.
The dump file viewer consists of three tabs, Auto Analysis, Threads and Call Stack, and Statistics Viewer, on which the results of analyzing the FSID (full system information dump) files or runtime dump files appear:
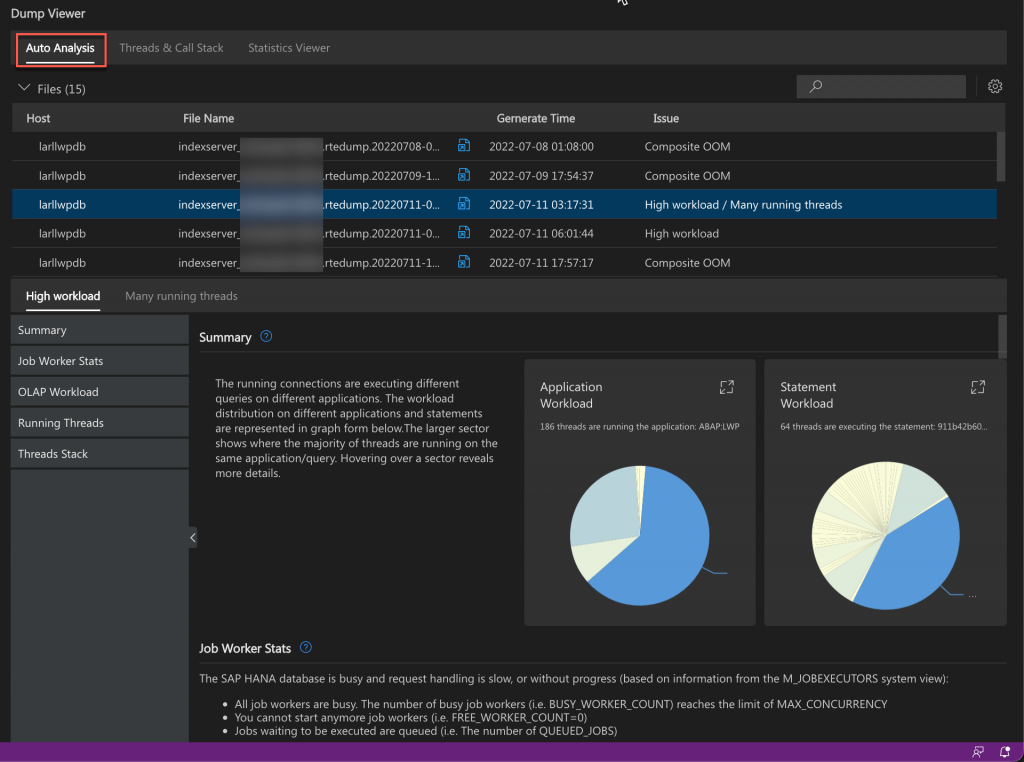
Auto Analysis
The auto analysis report is the most important feature of the dump file viewer. It categorizes the detected issues into one or more of ten different types and provides a type-specific analysis.
The detected issues are categorized as follows:
- OOM
- Composite OOM
- Crash
- Many transactions blocked
- High workload
- Many running threads
- Wait graph
- Savepoint blocked
- Index handle states
- No fatal issue
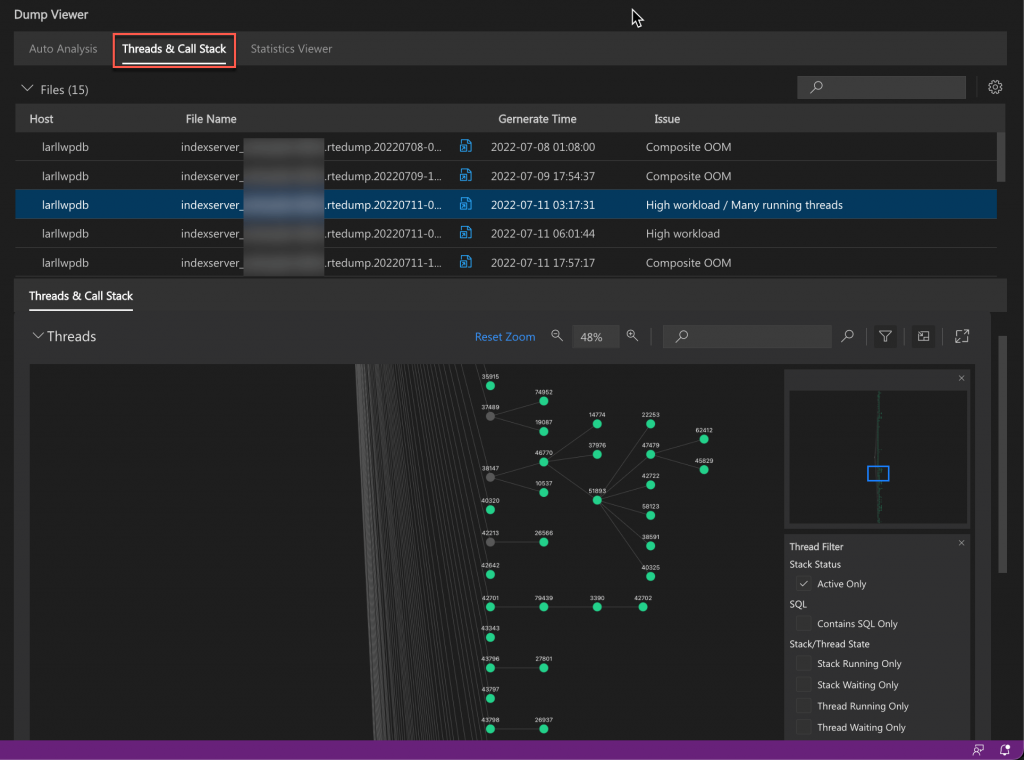
Threads and Call Stack
The threads and call stack report provides information about individual threads and lets you compare the call stacks of a selected thread.
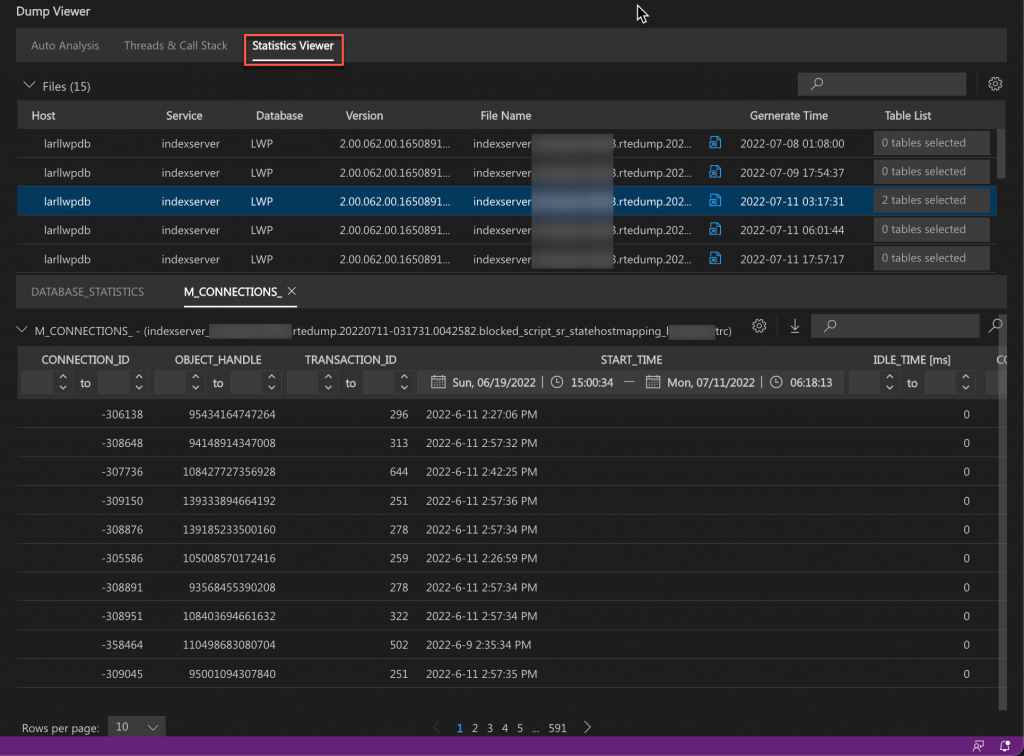
Statistics Viewer
The statistics viewer lets you display the data of the statistics tables associated with the trace files.
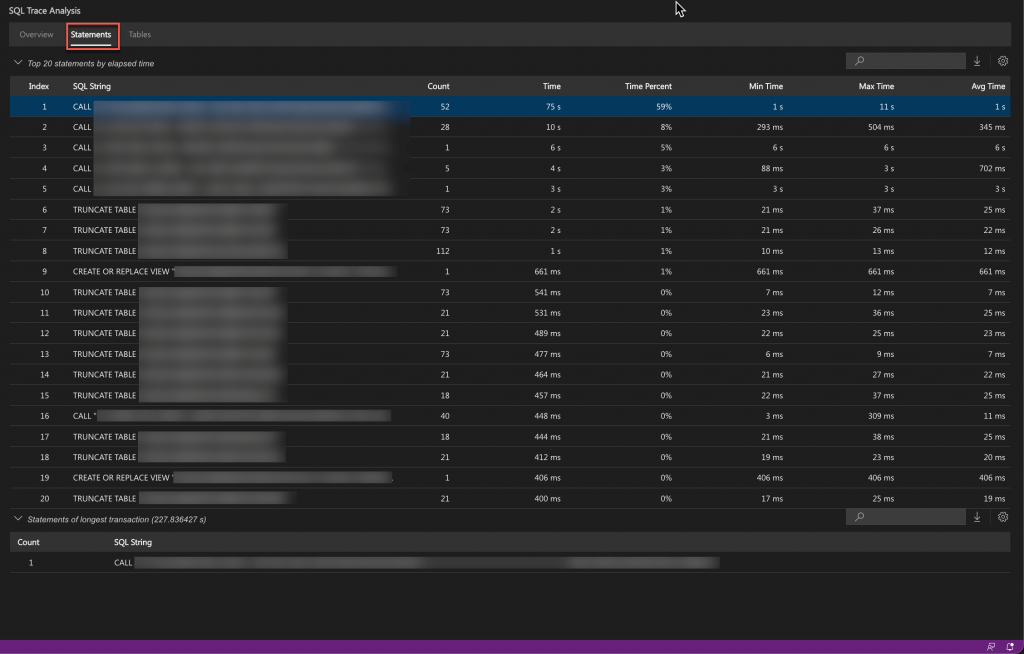
SQL Trace Analysis
The SQL trace visualization report simplifies the analysis of an SQL trace file by providing an overview of the top SQL statements executed in the database. It provides statistics on the different statement types, the executed transactions, as well as the accessed tables.
The SQL trace analysis is a good starting point for understanding executed statements and their potential effects on performance, as well as for identifying potential performance bottlenecks at statement level.
The SQL trace visualization has the following tabs:
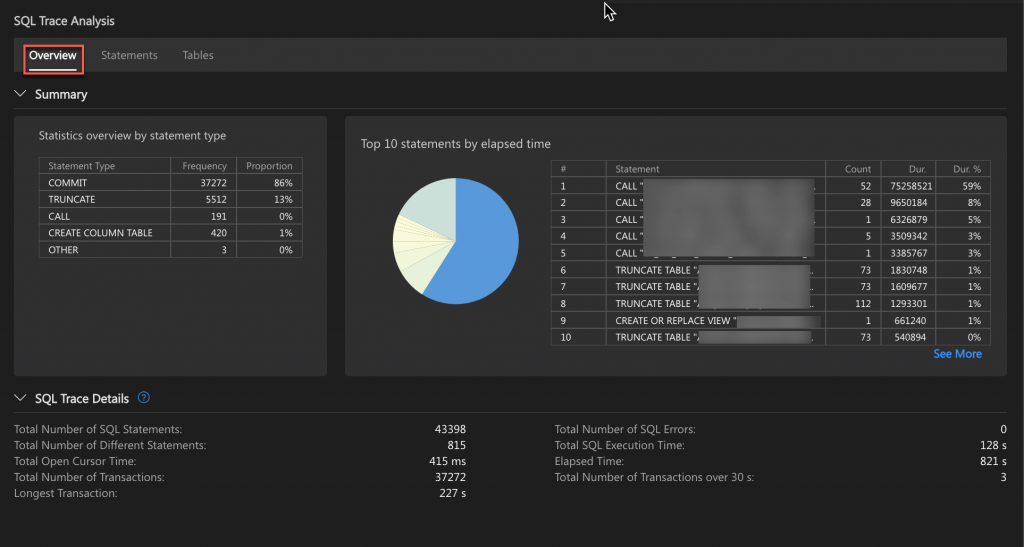
Overview
The Statistics overview by statement type section shows the number and percentage of different SQL statement types.
The Top 10 statements by elapsed time section provides a pie chart and details of the top 10 SQL statements with the longest execution times.
The SQL Trace Details section provides overall information about the SQL trace file. This includes the overall SQL execution time, the number of SQL statements, the number of transactions, longest transaction, and so on
Statements
The Top 20 statements by elapsed time table provides the details of the top 20 SQL statements.
The SQL statements of the longest transaction are shown in the Statements of longest transaction table.
Tables
This section gives the top 10 tables for SELECT, INSERT, and UPDATE statements.
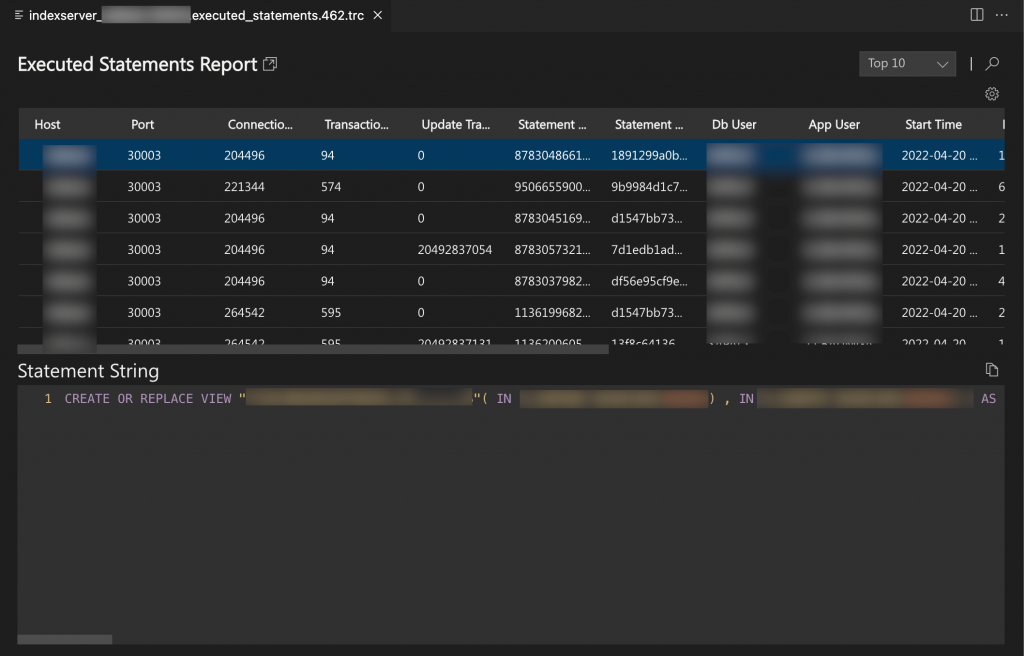
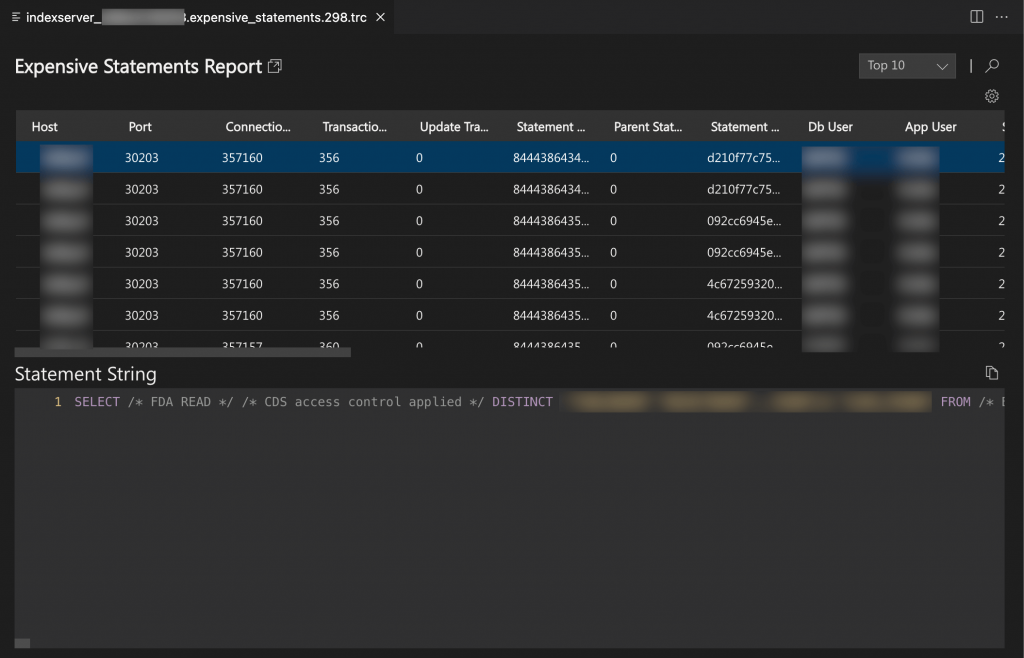
Executed Statements and Expensive Statements Reports
You can use the executed statements and expensive statements reports to analyze the overall SQL load in the system and identify the most expensive statements.
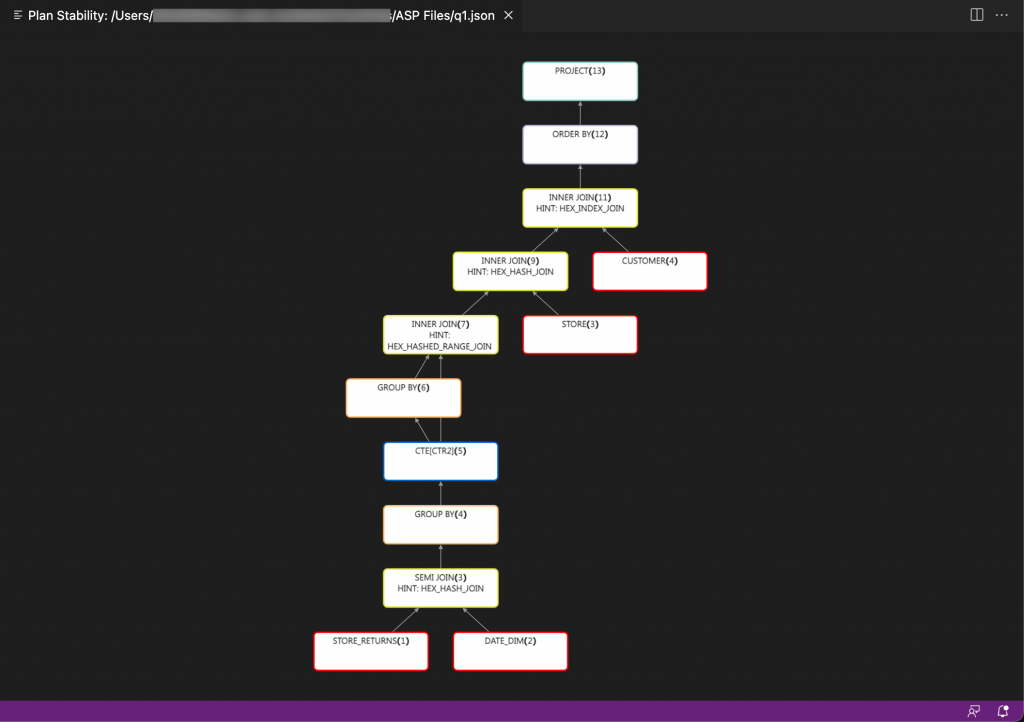
Abstract SQL Plan Visualization
An abstract SQL plan (ASP) can be exported from the SAP HANA database as a JSON file and then imported into the SAP HANA supportability tools and visualized.
An ASP is an abstraction of a query execution plan in JSON format. It is not a complete plan but contains logical plans and physical properties such as join algorithms.
Each node shows the operator name, the unique operator ID in brackets, and any applied hints. Leaf nodes (shown with red borders) represent data sources. For data source nodes, the name of the table and the data source ID are shown instead of the operator name and operator ID. A data source is defined by its database, schema, and table.
Topology Visualization
The topology information contained in a full system information dump (FSID) file can be visualized in a tree-based view. This can make it easier to read and understand difficult and hierarchical topology data while you are investigating an SAP HANA database issue.
The topology visualization comprises the following areas:
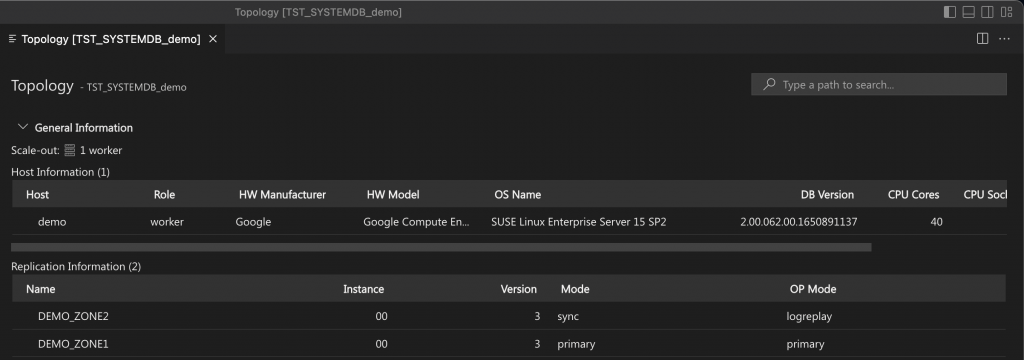
General information
The General Information section provides an overview of the database topology with scale-out, host, and replication information.
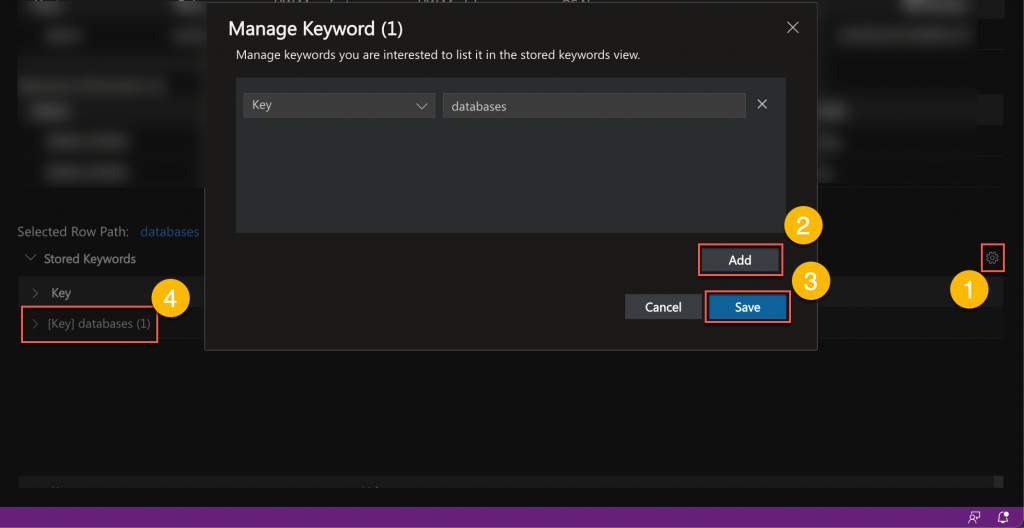
Stored keywords
The Stored Keywords section contains a user-defined list of important keywords or keywords of interest in a dedicated tree table.
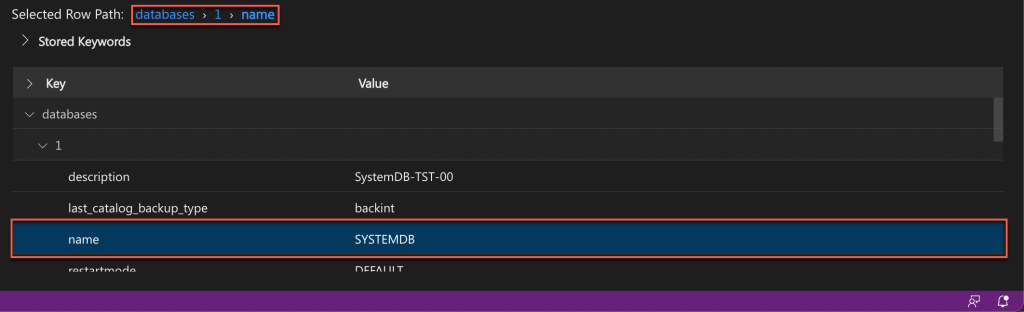
Main tree table area
The main tree table area provides the topology information, listed as key-value pairs, in a hierarchical form based on the original data hierarchy existing in the topology information file. When an entry is selected within the table, the selected row path is updated, giving the path from the root to the selected item.
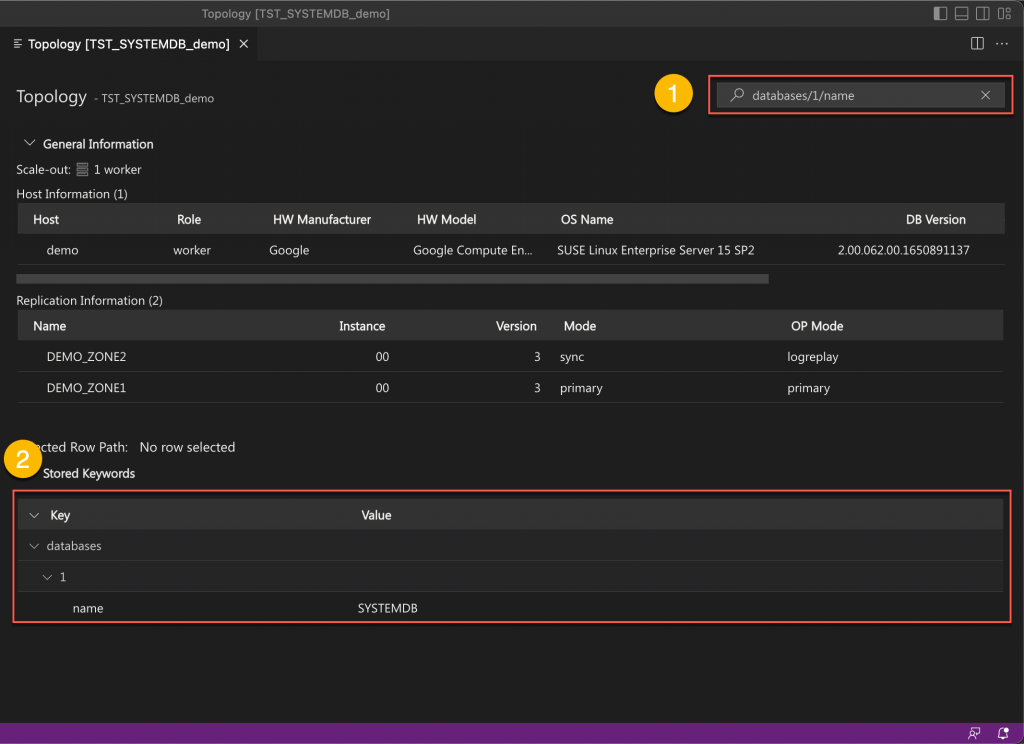
At the top on the right, a global search field allows you to freely search the topology information entries using a path-based expression.
Kernel Profiler Trace Visualization
This report provides a visualization for DOT files generated by the kernel profiler. Kernel profiler trace files are generated in SAP HANA to help performance analysis.
The kernel profiler traces provide information about CPU consumption and wait times of internal processes of the SAP HANA database. The kernel profiler trace is particularly helpful in cases where the system is hanging with high CPU usage, but it is also useful for single query performance issues. The files generated by the kernel profiler contain system-level statistics on the memory allocation of the system and information about which code causes high CPU consumption.
The report page contains the following main sections:
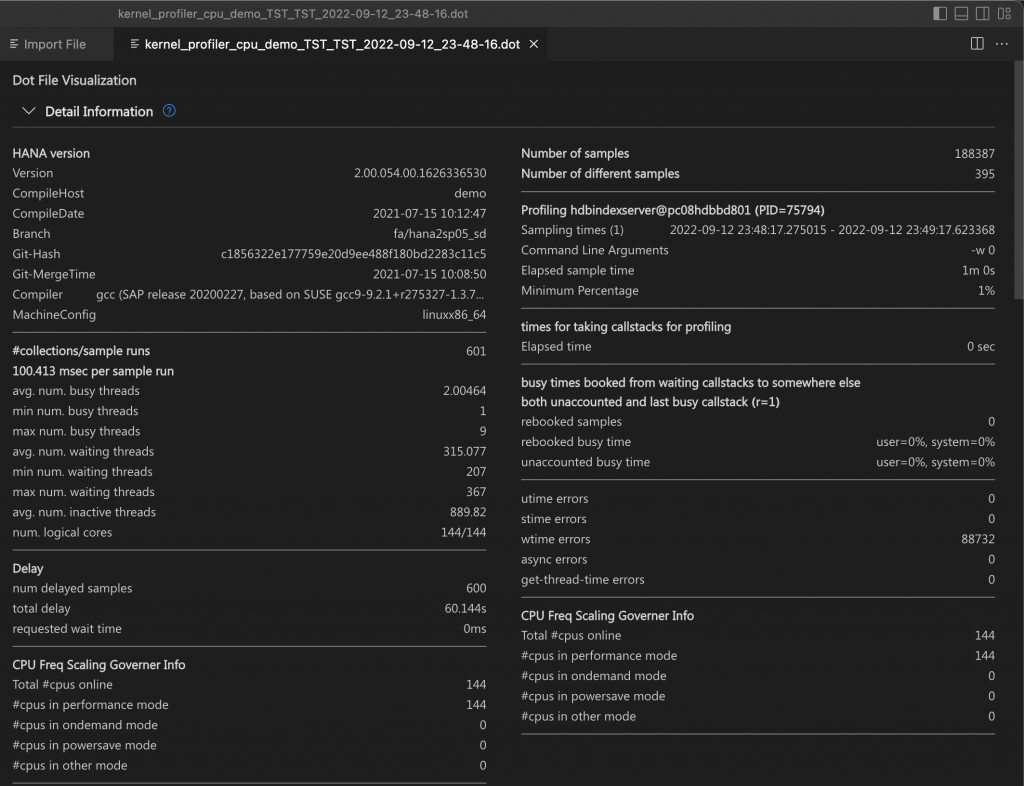
Detail information
This section shows the most important trace information, including SAP HANA database details, information about busy, waiting, and inactive threads in the collections or sample runs, delays and errors, number of samples, sampling times, busy times, and CPU statistics.
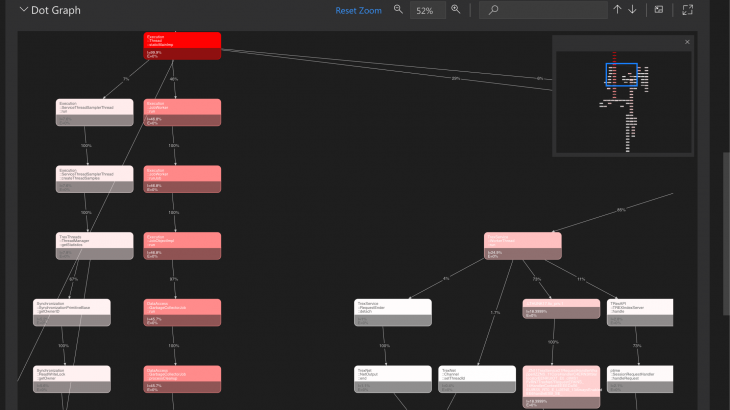
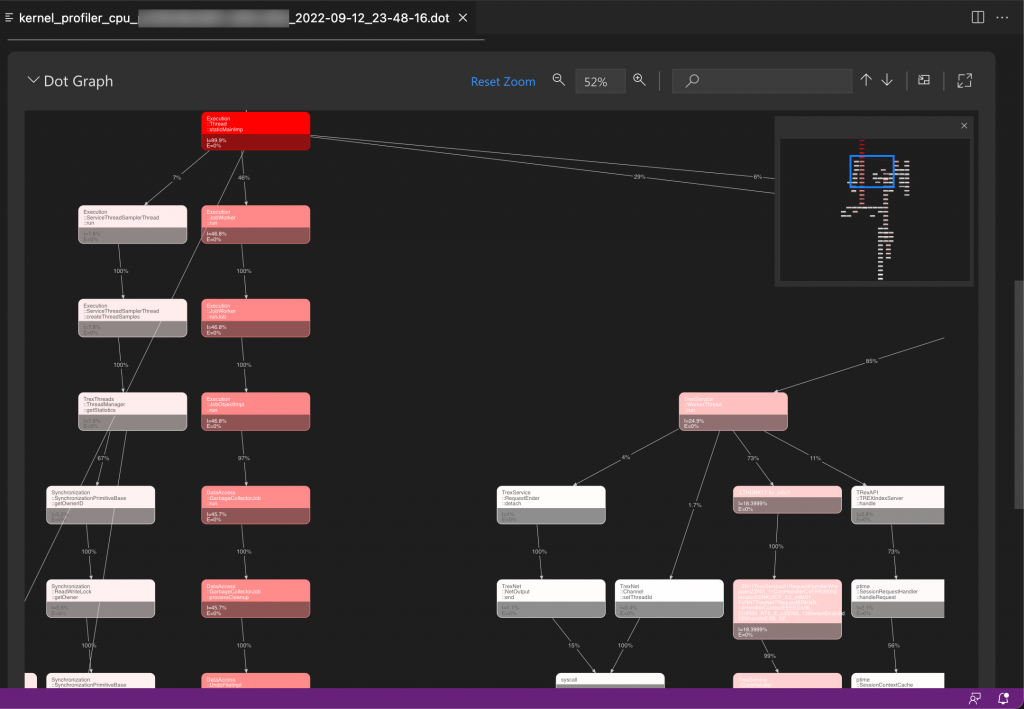
DOT graph
The DOT gaph is a graphical presentation of the call stack hierarchy. It visualizes frequent or expensive execution paths during query processing and provides the following information:
- Name of the function
- CPU or wait time of the function and descendant
- CPU or wait time of just the function (function only time)
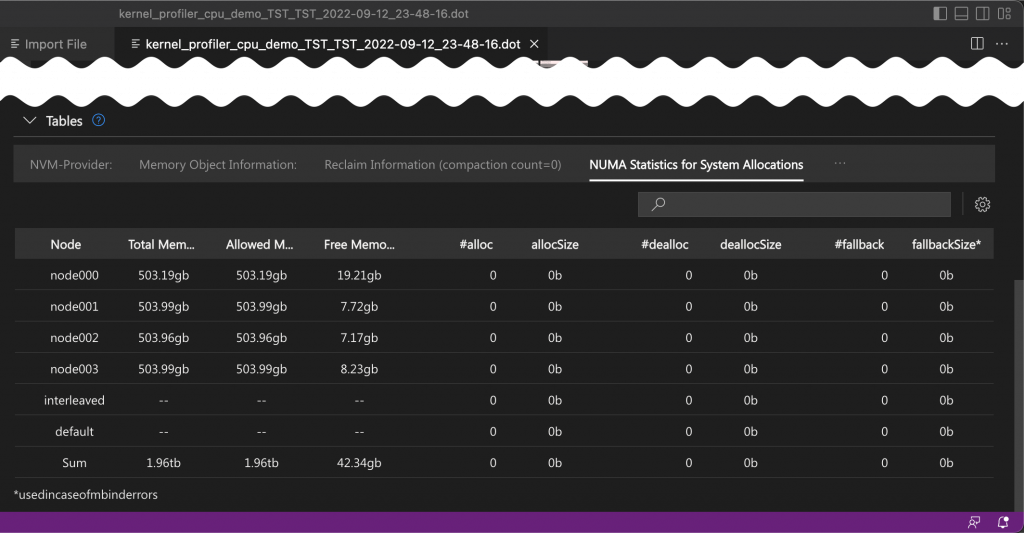
Tables
The tables in this section provide system-level statistics on the memory allocation of the system.