Background:
Last week, I was giving a demo to customer on “Supplier segmentation & evaluation” in area of procurement & sourcing in SAP S/4HANA ( on-premise). While explaining newly introduced feature purchasing categories via SAP FIORI app “Manage Purchasing Categories” , customer raised a very valid question.
Customer question – We have a supplier base of 1 million & some of them are dormant from months, most of them are involved in low business value transactions etc. We really do not know, how best we can cluster suppliers based on available invoice data. With limited IT team bandwidth we cannot perform classification of all 1 million suppliers.
This question motivated me to perform a POC(proof-of-concept) to cluster suppliers based on available Invoice data with the help of ML unsupervised algorithm. It does not make lot of sense to create purchasing categories & perform supplier evaluation on all the suppliers. This POC is additional mechanism to filter non strategic suppliers before actual supplier classification & evaluation.
The idea is to show customer that using ML unsupervised learning algorithm, suppliers can be screened & supplier evaluation can be performed on smaller number of strategic suppliers to save time & effort of purchasing department.
To accomplish this POC, I have written Python code with ML KMeans algorithm to perform clustering of supplier before actual supplier classification & segmentation phase. Coding is done in Jupyter notebook & to understand this POC it is absolutely not necessary to understand python code. I have added code snippet for technical folks. Optional code snippet is added in each step under section “POC Execution”.
Objective:
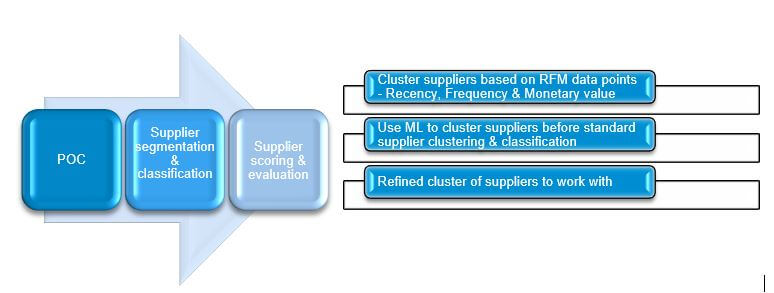
The Aim of this POC is to screen suppliers based on RFM (Recency, Frequency, Monetary Value) parameters before performing actual supplier classification. It is first & basic level of refinement before creating purchasing categories in SAP S/4HANA(on premise) system. Below is more details of RFM methodology.
- R (Recency): Number of days since last invoice raised by supplier to check from how long the supplier is dormant.
Ex – How recent supplier have supplied the material – 50 Days
- F (Frequency): Number of transactions per supplier in given time frame
Ex – How Frequently procurement is done with supplier – 100 invoices raised in given timeframe
- M (Monetary Value) – How much procurement done with supplier in $
Ex – Total 100$ worth of invoices raised by supplier done in given timeframe
Business Value:
- Reduce workload of supplier screening & evaluation team as we get refined list of strategic suppliers after the exercise.
- Identify strategically important suppliers which fall under high RFM cluster. Supplier with recent, high value monetary transactions.
- Improves accuracy of supplier scoring & evaluation phase.
POC Execution:
This problem is a clear candidate of Unsupervised machine learning use case as Output/Label is not predefined & we are expected to Cluster suppliers using ML Algorithm.
Implementation of data science POC from scratch tend to become too technical, I am not denying that but there is equal involvement of functional counterpart in each stage. At each stage I will share important points which a functional expert can drive & discuss with customer.
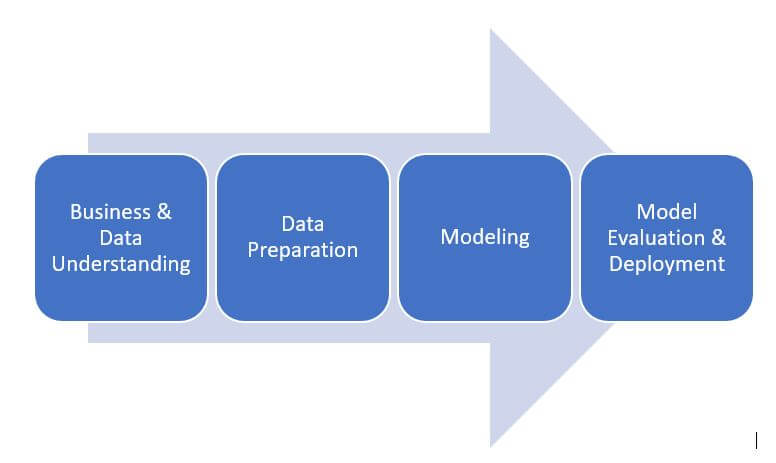
Business & data understanding
Business understanding is shared in section Background & objective of POC.
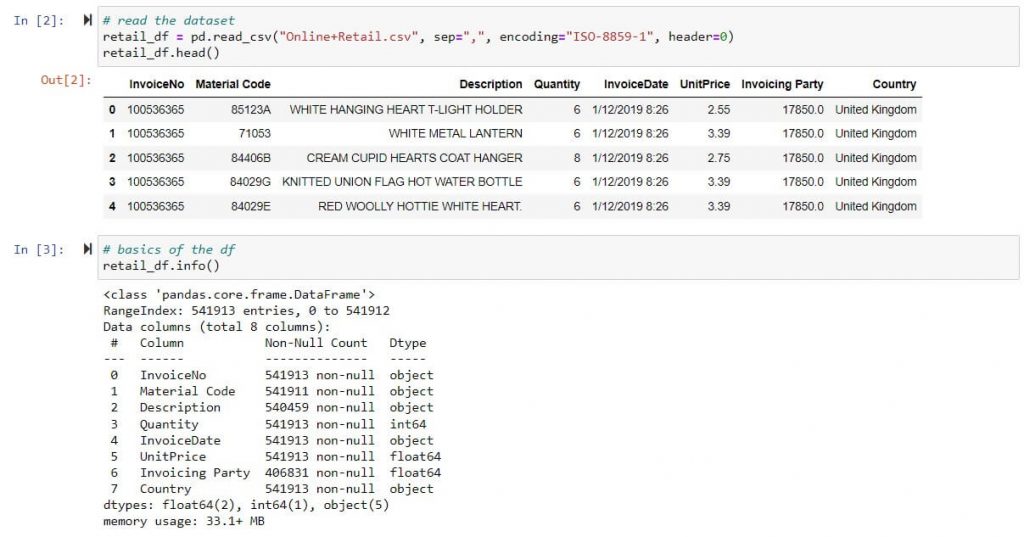
List of 500k Invoice transactions taken from Jan 2019 to Dec 2020, sample Excel data:

Columns :
- InvoiceNo. – Unique invoice number (Under 1 Invoice number multiple material code are invoiced, Hence more than 1 row exist per invoice in dataset)
- Material Code – Material Invoiced
- Invoicing party – Supplier
- Quantity – Invoice quantity of material code invoices at UnitPrice.
- InvoiceDate – invoicing date with timestamp
Optional* – Read excel, check data types & important statistical parameters
Data Preparation
Data preparation is very important step before model building. Following are important questions answered in this step.
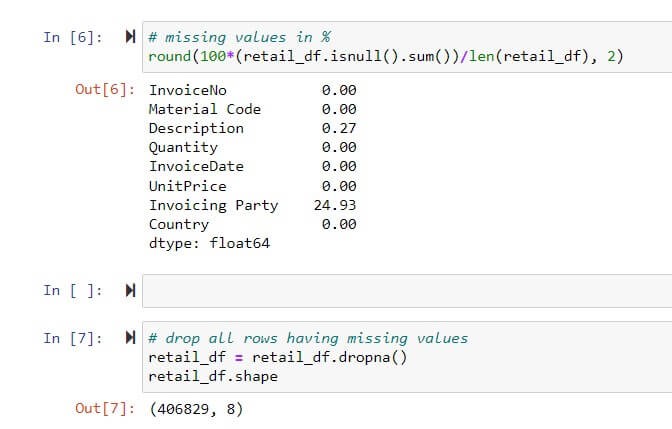
- What to do with missing values in the dataset(Excel in this case) – Ex – Delete or replace missing data with mean/median/mode
Most of the times data may not be complete & is plagued with missing values. Hence functional consultant are expected to discuss missing value issue before model building. It is required to treat missing values in dataset by either deletion of columns or rows with missing values Or by replacing them with statistical mean/mode/median. There are lot of ways of dealing missing values however in this POC we have dropped rows with missing values as there was no scarcity of data.
Functional consultant is expected to discuss treatment of missing values with customer.
Optional* – Code snippet to highlight % of missing values & dropping rows with missing values.
- Drive important features/columns out of existing dataset columns. Ex – Recency, Frequency, Monetary
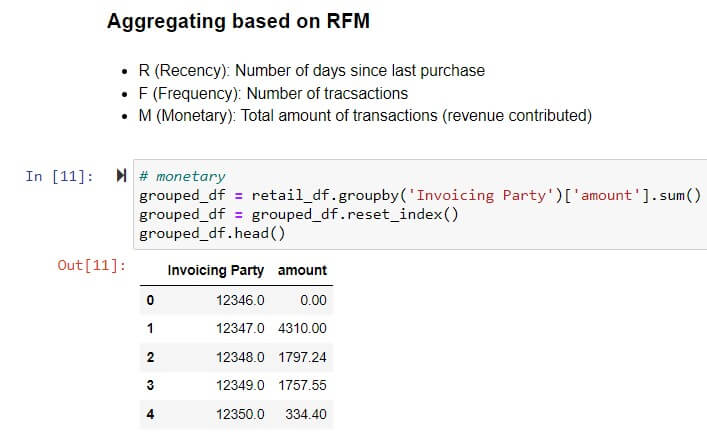
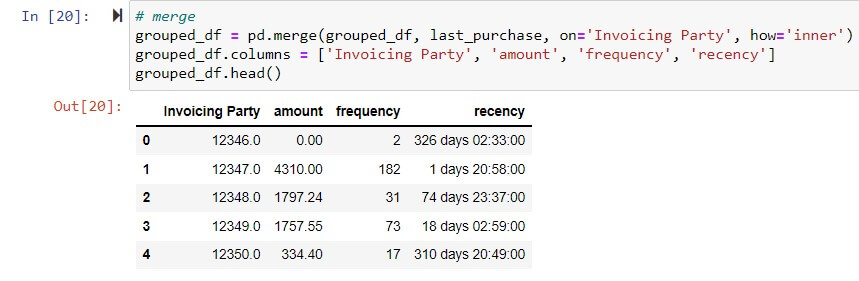
This is very important step as part of data preparation as it involves creation of new features/columns to increase insights in given dataset. To perform supplier clustering on RFM (Recency, Frequency, Monetary ) parameters it is required to create three additional columns (amount, recency & frequency) to depict recency,frequency & monetary value by grouping existing data.
Monetary Value: Total invoice transaction amount per supplier – Group by supplier on Amount field (calculated by multiplying Quantity * Unit Price)
Optional*
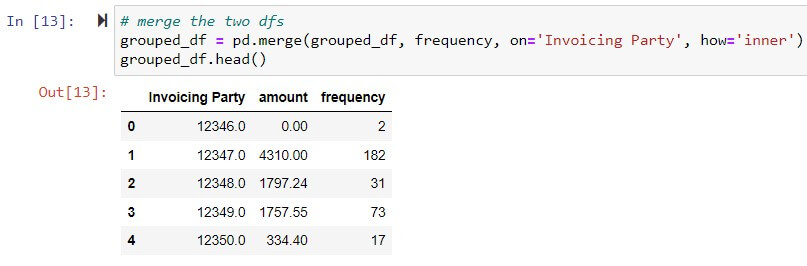
Frequency: Frequency of invoice transaction per supplier – Group by supplier & count transaction per supplier.
Optional*
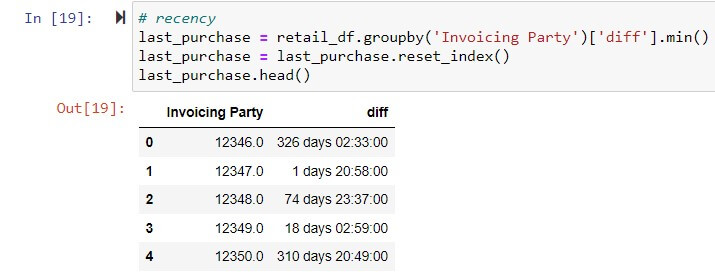
Recency: Last Invoice transaction done by supplier from today in Days.
Optional*
Final dataset prepared based on RFM analysis.
- How outliers are treated ?
Outliers are data points which holds values less & more than lower band & higher band of boxplot. Below is depiction of outliers in statistical terms
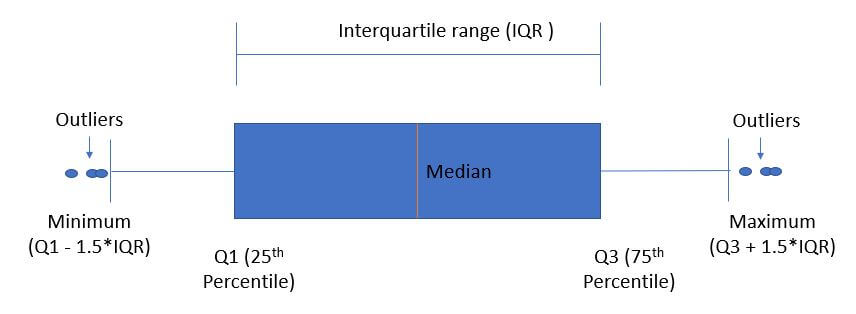
Outliers highly influence clustering of suppliers, Hence treatment of outliers are important before model building & driving new columns.
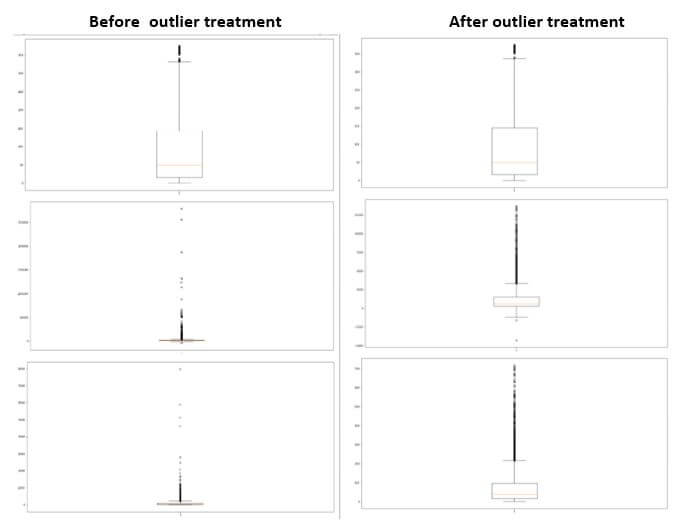
In this POC since ample amount of dataset was available I just deleted outliers present in column Recency, Frequency & Monetary value.
- Share the Insights with customer after exploratory data Analysis.
Ex – Highest number of Tx observed in UK Or Top 10 suppliers with business value
Modeling, evaluation & deployment
Determination is optimum number of clusters precedes model building & evaluation.
There are methods like Silhouette Analysis & elbow curve to determine optimum number of clusters. However, it is always wise to take first feedback from customer on number of clusters. Based on business discussion primarily on customer workload bandwidth, hence customer advised to have 3 clusters.
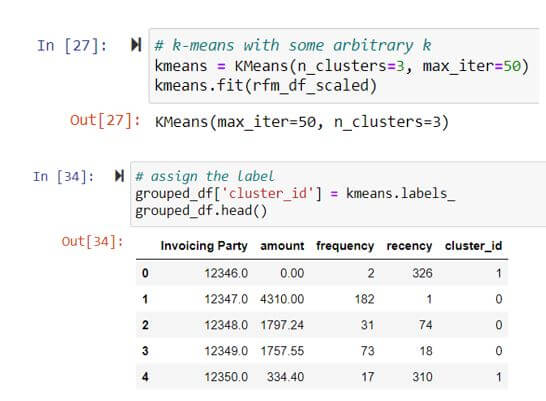
Multiple unsupervised learning algorithms like KMeans, Random forest, Decision tree can be used. Before finalizing algorithms for clustering it is important to understand pros & cons of each of them. Explaining pros & cons of each of them is a huge topic in itself & hence not explained here. For this POC we used KMeans clustering algorithm. Below is the summary
- No. of cluster – 3, tagged as (0,1,2)
- Model employed – Kmeans
- Model learning Iterations – 50
Optional*
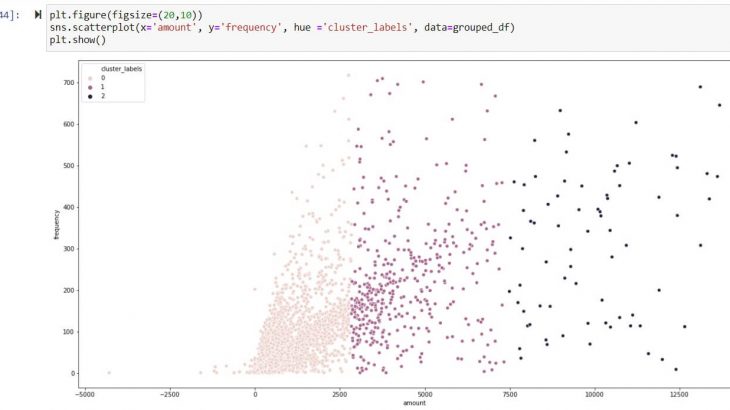
Graphical display of Clusters
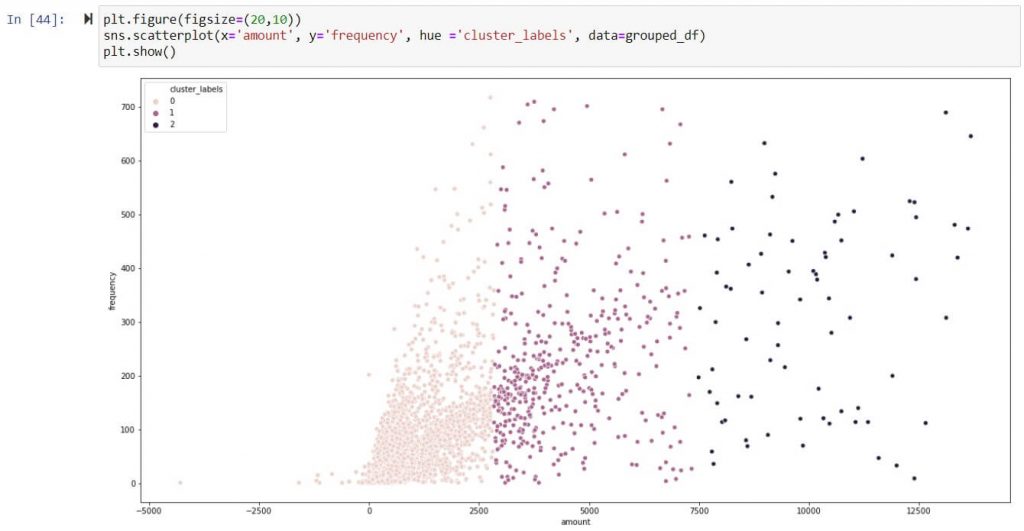
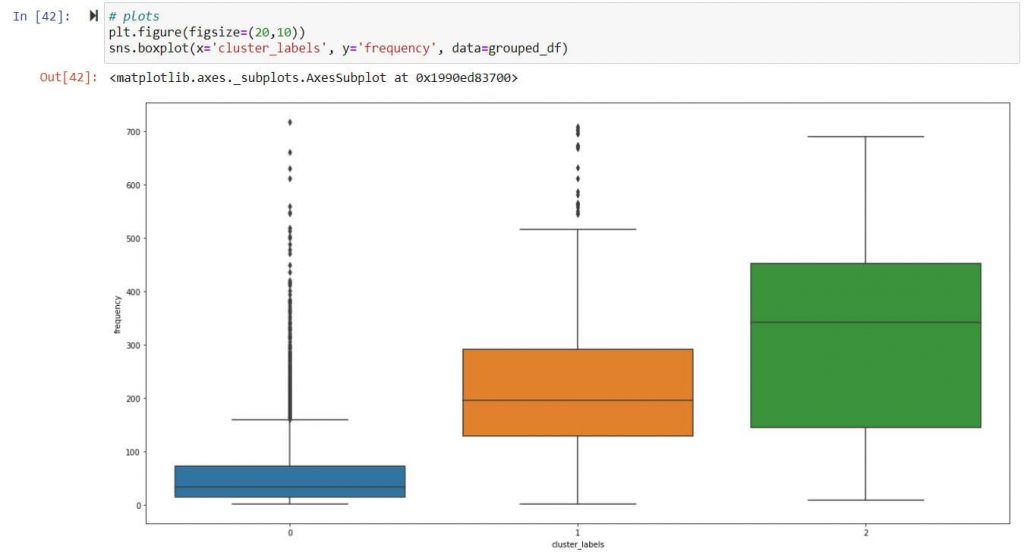
Frequency – Scatter plot of clusters ( 0,1,2)
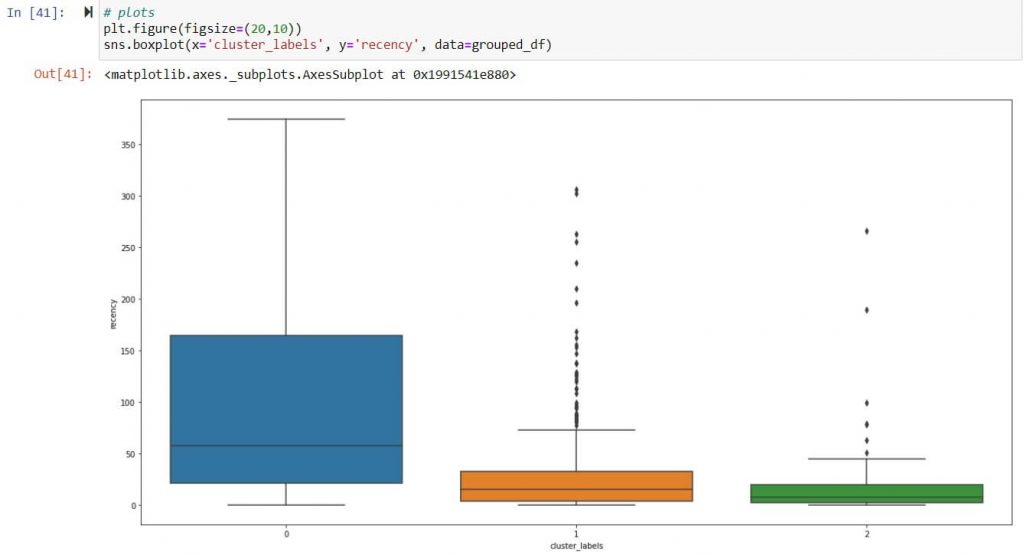
Recency – Scatter plot of clusters ( 0,1,2)
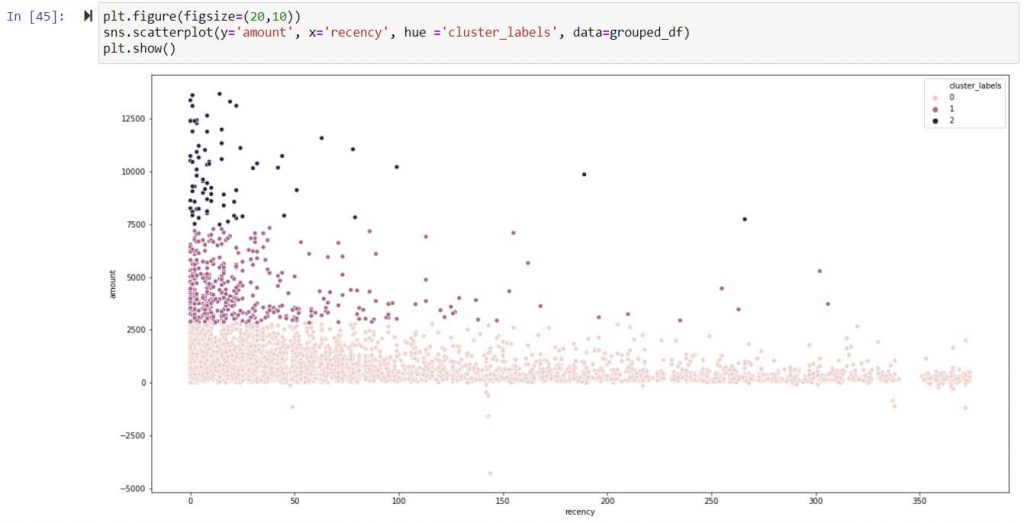

Amount/Monetary Value – Scatter plot of clusters ( 0,1,2)
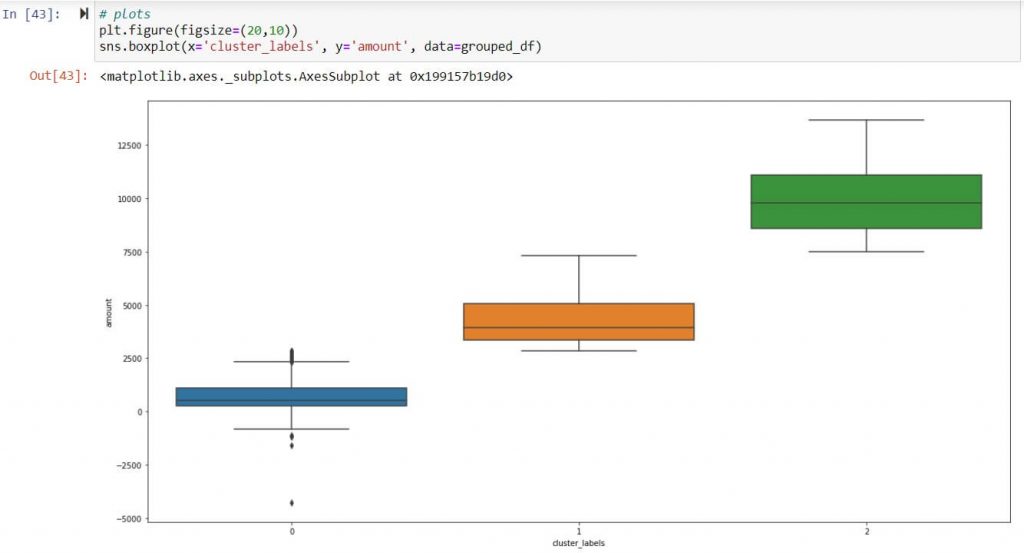
Inference:
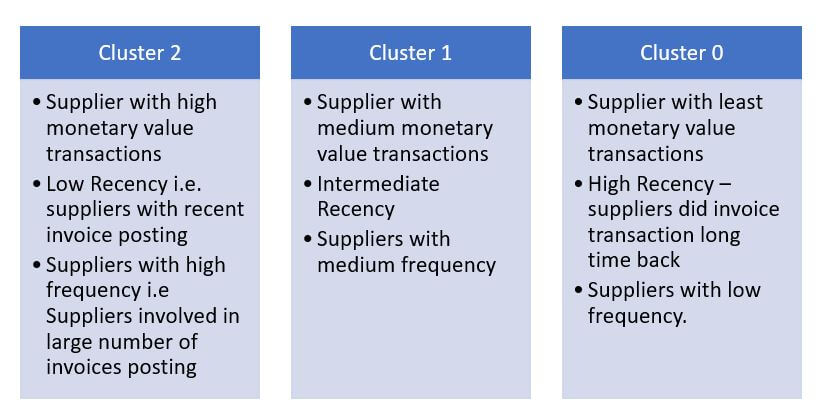
Above inference highlights suppliers tagged under Cluster 2 are strategically important as they exhibit frequent high-volume transaction. Hence suppliers tagged under cluster 2 should be taken in follow on process like supplier classification & evaluation.
Important consideration
- Other unsupervised learning algorithms like RF, DT etc. can be also employed, They may produce similar or even better result however I have not tried them in this POC
- I had taken invoice data for clustering & have not included Credit or Debit Memo for simplicity. However same can included.
- Here customer has guided us on number of clusters considering IT team bandwidth & other business aspects, however 3 or more clusters can be created.
- Number of clusters can also be determined based on Elbow curve or silhouette score.
- Dataset displayed in screen shots are dummy dataset.
- Some of the decisions taken in this proof of concept like deletion of missing values, selection of model etc. varies a lot with dataset, Hence should not be followed as it is.


