
To master any programming language or any framework, the key is to have essential Debugging Skills. If you are an SAPUI5 beginner this post might interest you. Good debugging skills will not only help you to create custom SAPUI5 applications but also help to fix standard Fiori Applications which you will activate on Fiori Launchpad…. and trust me …debugging is easy!
Let’s Start:
This post assumes that you can set up your SAPUI5 project in WebIDE/Eclipse.
You can download the code of the application used in this tutorial and import the Source Code from here https://github.com/imvk001/debugging_ui5_demo.git
SAPUI5 Project Structure:
During this post, we will keep this project structure in mind.
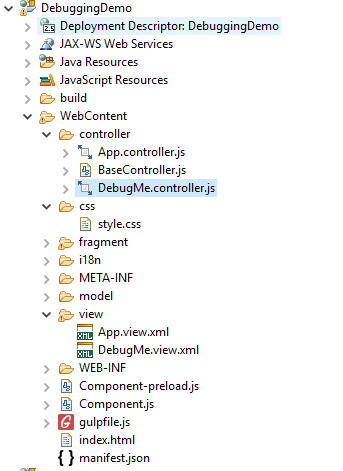
Most of us may not have gulpfile.js, Component-preload.js. You don’t need to worry about those. We’ll understand those some other day. They are not necessary for this post.
Google Chrome dev tools are the best debugging tools available to debug JavaScript, so if you don’t have Google Chrome, download it right away.
https://www.google.com/chrome/browser/desktop/index.html
I’ll try to explain the basic debugging using a test example. This test example will explain how you can debug your app and what various functions are available in chrome dev tool. All you need is to follow the below steps.
To understand basic debugging let’s take a test case where a user will enter values in input fields and will get the sum of the fields when he will click on “Add” button.
This simple App also qualifies to be your first “Hello World” SAPUI5 App. Do not worry if you have not developed any SAPUI5 till now. I will hand hold you.
If you are Fresher in SAPUI5, start here: How to Consume Custom OData in SAPUI5 Application.
To do that let’s add some code in our application.
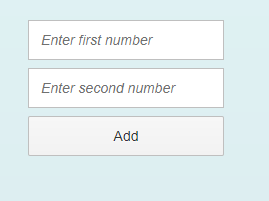
In DebugMe.view.xml : Let’s create two input fields with one button.
| <Input placeholder=”Enter first number” id=”input1″/> <Input placeholder=”Enter second number” id=”input2″/> <Button text=”Add” press=”addTwoNumbers” width=”100%”/> |
Output:
Now, in DebugMe.controller.js let’s write code to get Output when the user clicks on Add button.
Step: Write the following code
addTwoNumbers:function(){
var first=parseInt(this.getView().byId(“input1”).getValue()); // getting value of first Input
var second=parseInt(this.getView().byId(“input2”).getValue()); // getting value of second Input
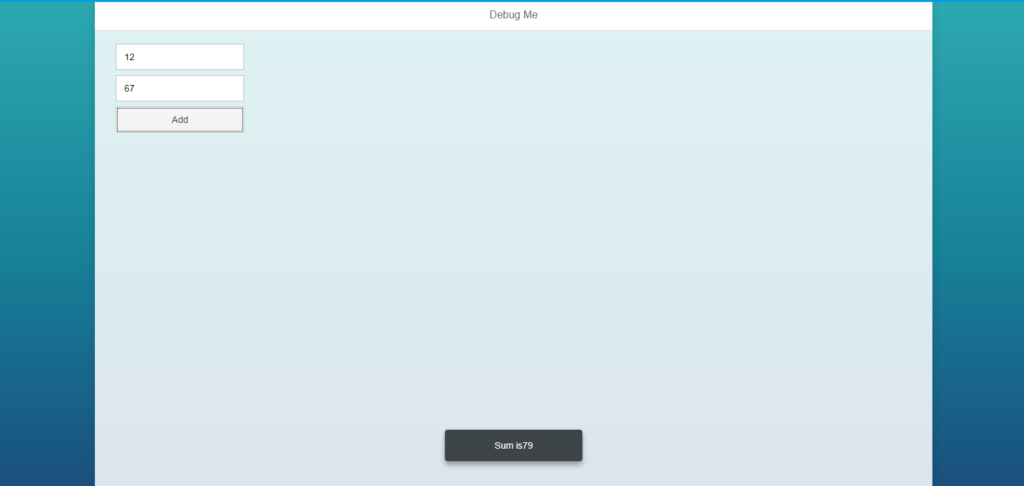
var sum=first+second; MessageToast.show(“Sum is “+sum);
}
Output: When you will enter values and Click on “Add”
Now we have a basic app ready. We are ready to debug.
Step: Run your application in chrome and open chrome debugger.
Two ways to Open Chrome Browser Debugger:
- Hit F12 on the keyboard.
- Right Click->Inspect
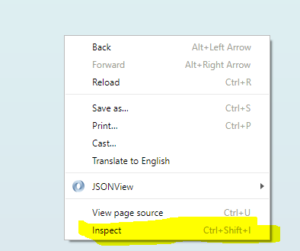
This will open up the Debug Tool Panel of Chrome.
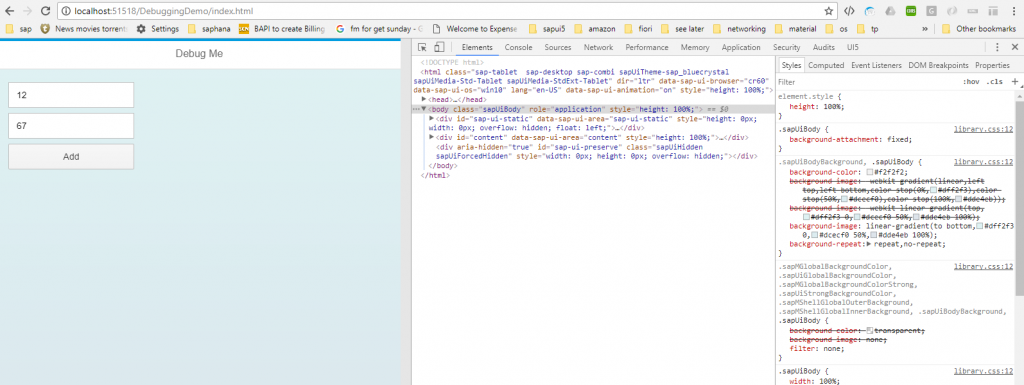
Chrome Debug Tool Panel
Elements: This Panel consists of the SAPUI5 control representation in HTML.
Console: All the messages emitted from the app at runtime appear here and we can manipulate the runtime variables here (we’ll see soon).
Sources: We can view our App sources here and set debugging breakpoints and we can also modify the source code temporarily for testing purpose.
Network: Every source we use in the App get logged in here; it has essential information like how much time the resource took to load and where it came from.
Step: Go to Network Tab and refresh the application Hit F5
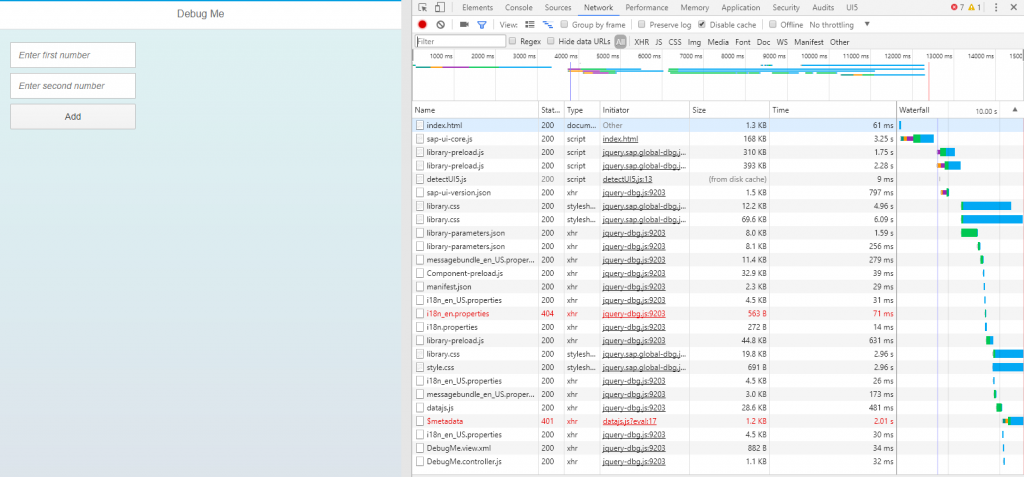
Here you can see all the resources name, type, initiator, size and time. You can check here whether your particular resource/file is loaded or not. When your resource gets loaded successfully you will get 200 in status column and 400 or 500 otherwise.
Setting Breakpoints in code
We can set breakpoints on JS code. Let’s set a breakpoint in our code to check run-time values of the variables.
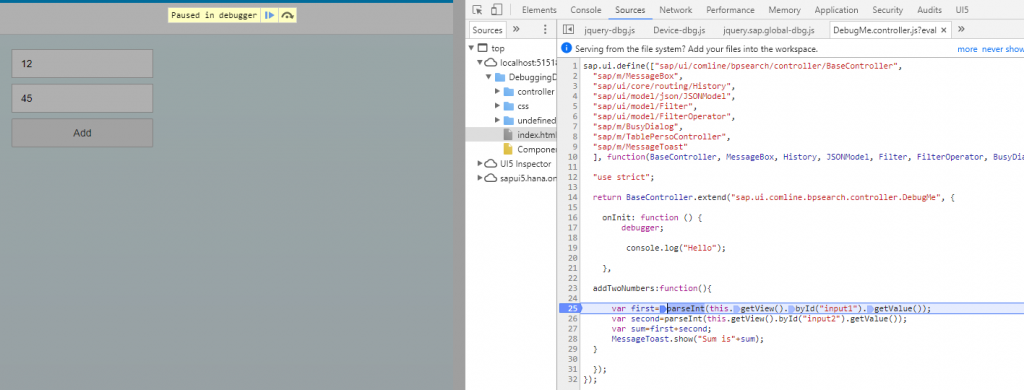
Step: Go to Sources Tab hit CTRL+O enter the name of your controller file and select to open.
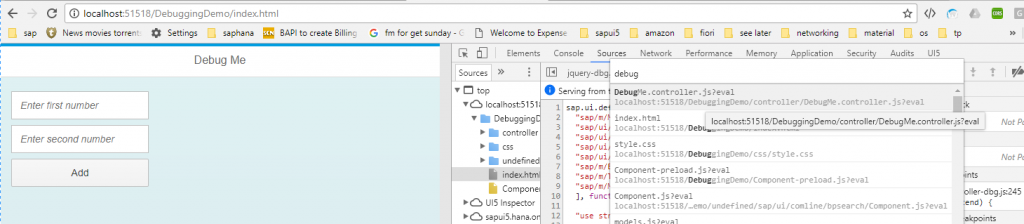
After selecting the file you can view your code.
To pause the execution at a particular line, we will set debugger by clicking on the line number (it will turn blue) in Sources Tab, suppose we need to pause execution when we are getting the value of first Input. Just click on the line number.
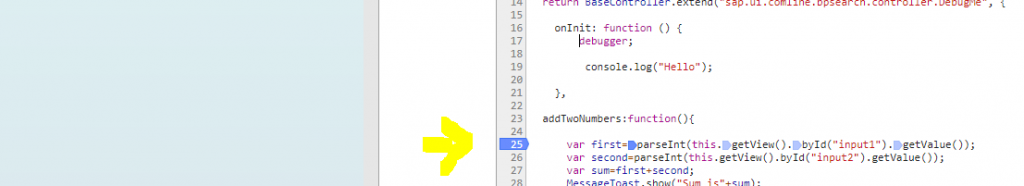
So, now when you will click on “Add” button in your app, it will pause on line number “25”
Step: Hit F10 to execute the present line and move to next line
You can see now, the value of variable first = 12
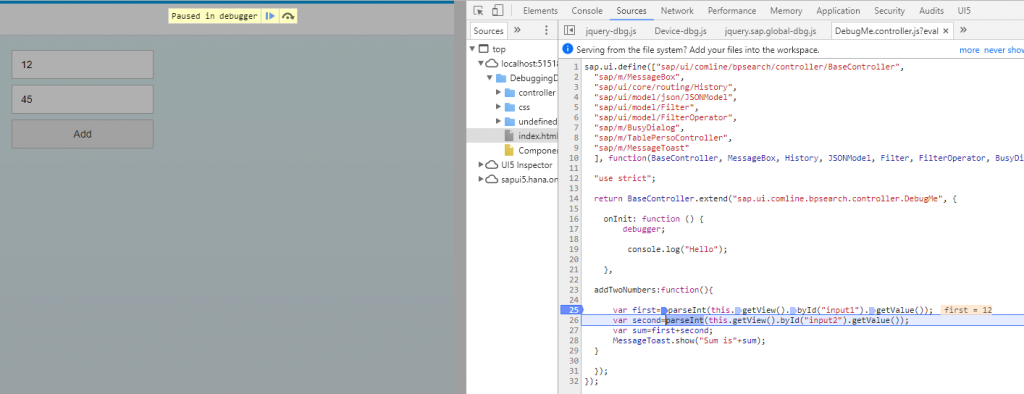
Now you are at next line, i.e. getting the value of the second variable. Let’s stop for a while, don’t worry your application will be paused until you don’t allow it.
The value of the variable can be checked by other ways also like:
1. Just hover your mouse pointer on the variable.
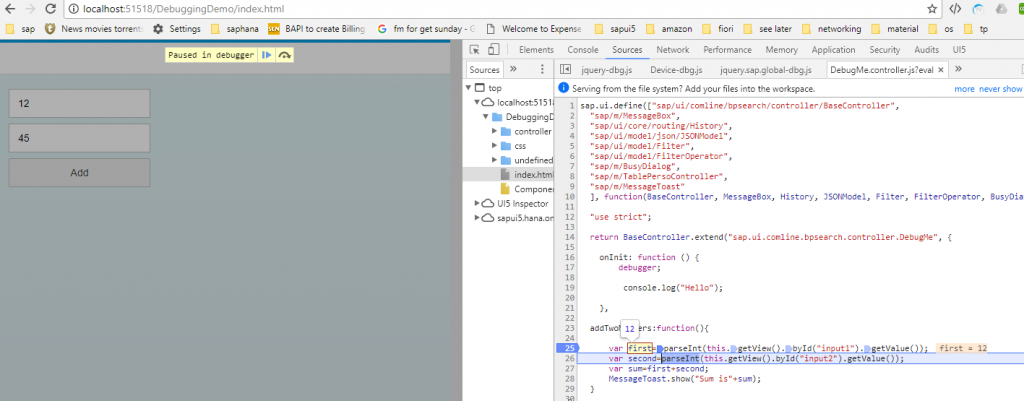
2. Switch to Console Tab and enter the name of the variable
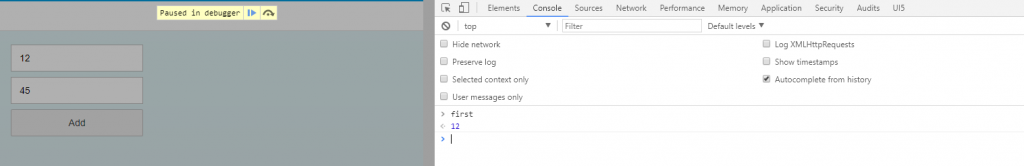
You can perform any JavaScript operation here in the Console Tab. For example:
Value of the variable is “12”. You can change it to any value you want, just write first=45; and press enter, you will change the value of “first” in real time.
Now when you will resume the app execution you will get the total as 45 + value of the second variable, although you still have “12” as the value in the input field on UI.
Also, you can get to know more about UI controls you have used in your app. (We’ll see this later in the post)
To resume the application Hit F8
F8: It is used to jump to one debug breakpoint to another and resume the application execution.
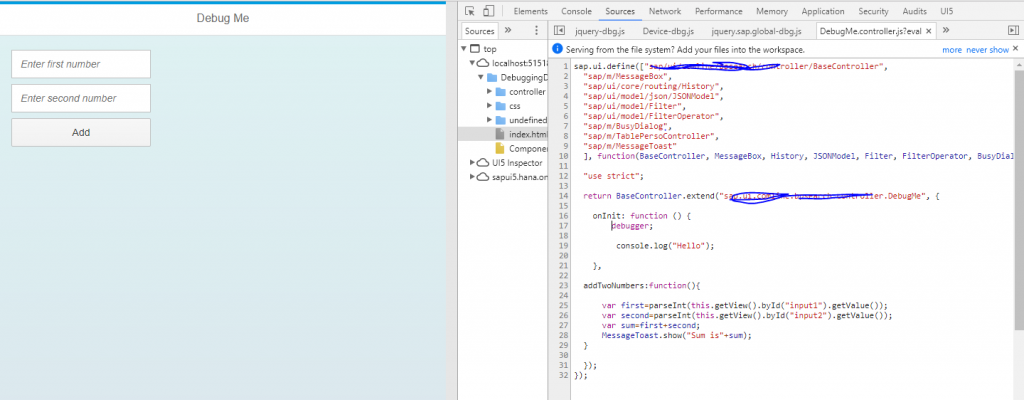
Setting Breakpoint: The hard code way.
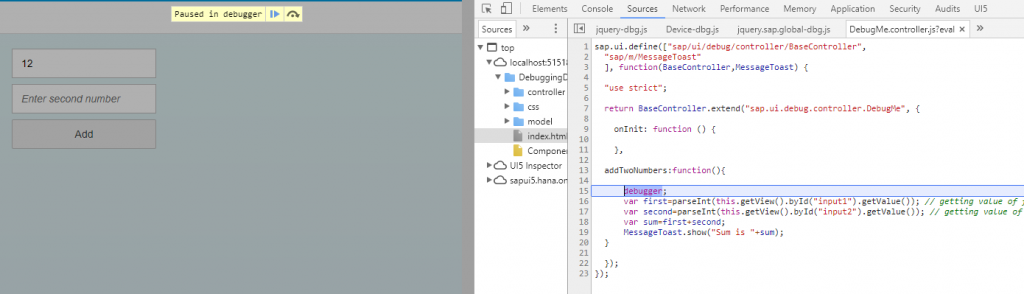
You can also set breakpoints just by simply writing “debugger” in the controller. This will automatically pause your code when your browser is in debugging mode.
For example just write debugger before “first”.
addTwoNumbers:function(){
debugger;
var first=parseInt(this.getView().byId(“input1”).getValue()); // getting value of first Input
var second=parseInt(this.getView().byId(“input2”).getValue()); // getting value of second Input var sum=first+second;
MessageToast.show(“Sum is “+sum); }
And click on Add (Button on your App), you will notice that your code will pause on the line you wrote debugger.
Again we will use the same drill to move to next line i.e. hitting F10 and to resume the application execution hitting F8
Please note: Always remove hardcoded “debugger” when you are done with testing.
Playing with UI
We can also alter UI control properties during debugging, although these changes are temporary they give us the idea what all changes we have to do in our original code to get the desired output.
Step: Run the application and hit F12 and click the icon on top left corner (shown in image)
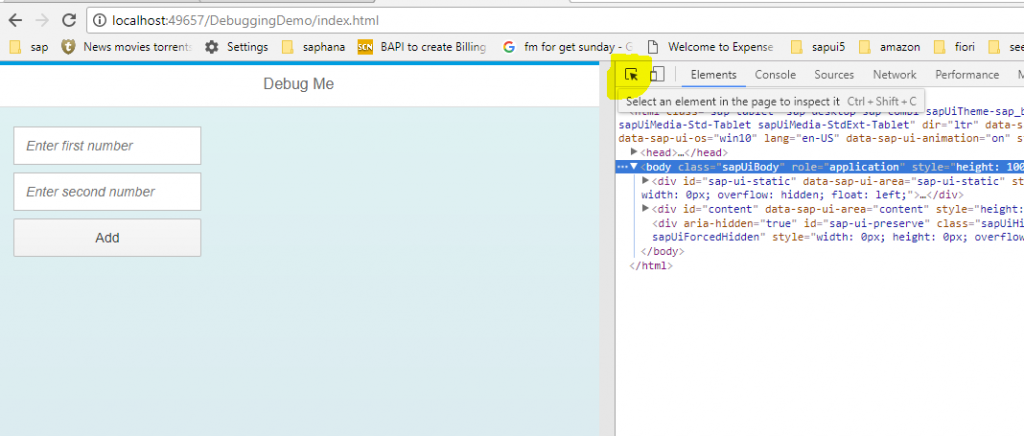
Now, when you hover the mouse pointer on a particular control you will see the in Elements tab showing the selected control. For example, I selected the first Input Box and the Elements are highlighted on the right panel.
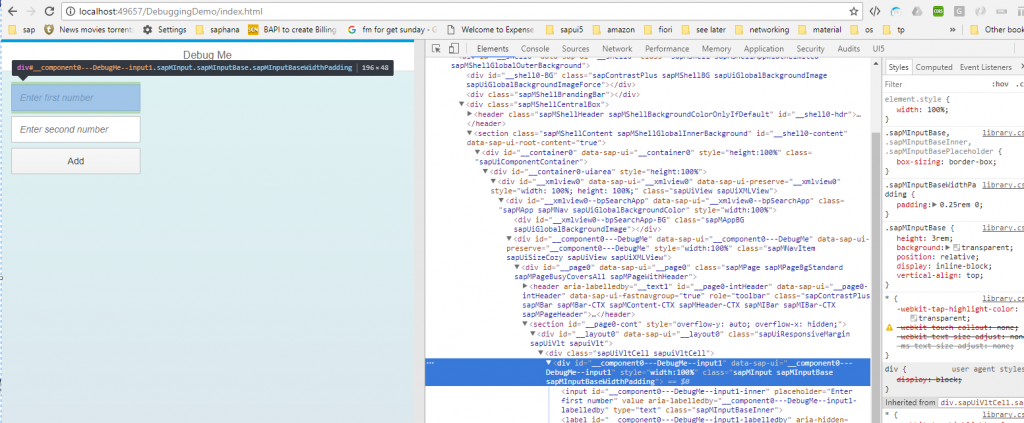
You will see all the properties of the input control we used and you can change the value of the properties on the fly.
Just scroll on the Styles Tab, you will find all the properties and you can enter any values you wish and understand the UI controls.
When you select a control, you will find $0 with your control in element tab.
Step: Switch to Console Tab and enter $0 and press enter
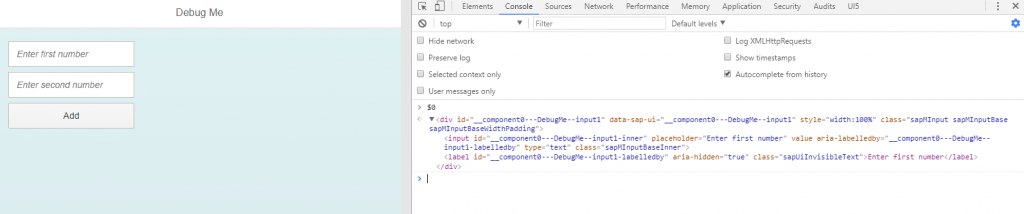
You can see properties of your input control now. But you can do a lot with this “$0”
Enter following in Console
a = sap.ui.getCore().byId($0.id)
With the above line of code, now “a” carries the id of your Control. When you will type a, you will see all the functions available for your control. This way you can be more familiar with the SAPUI5 controls.

Although, I have covered very basic debugging, once you are good with these you can dive deep to understand more about debugging. I just tried to teach you Fishing. Now you can catch any fish you want.


