
SAP Intelligent Real Estate
SAP Intelligent Real Estate is a flexible real estate management solution for the corporate and commercial real estate market that optimizes portfolio performance and occupant experience.
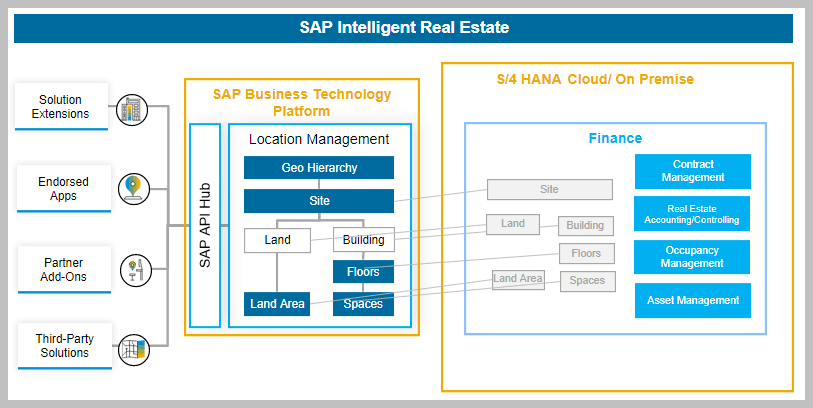
The native integration with SAP S/4HANA and other connected applications allows for streamlined performance of end-to-end real estate business processes in the areas of portfolio, location, space, and contract and lease management. Strategic analytics capabilities are built across products and technologies on top of S/4HANA Cloud for Contract and Lease Management, Finance as well as SAP Cloud for Real Estate on BTP. The dashboard facilitates a sustainable property portfolio management to support better decision-making and drive greater efficiencies.
Highly integrated processes between the architectural view in SAP Cloud for Real Estate and the usage view of properties in SAP S/4HANA Cloud mapped with financial processes provide a new level of transparency and data linkage, harmonized in SAP Data Warehouse Cloud.
SAP provides a comprehensive content package which includes all data models in SAP Data Warehouse Cloud plus the SAP Analytics Cloud dashboard on top of it. It serves for various target groups in the real estate management processes.
This blog is not intended to describe the technical implementation of the solution, but to focus more on the business perspective. What possibilities of evaluation and presentation are given with the content package and how can this content be expanded with the optional data sources and additional information that are available in data sources? Which questions are answered with the dashboard, how can I foresee future trends and forecasts?
Available analytic data sources
With the last release of the DWC/SAC content for 2022 Q4, there is now the third version of the content package for SAP Intelligent Real Estate with new functionality and data sources. The analytic data models in the DWC offers to link and analyze the SAP Intelligent Real Estate Usage data from SAP S/4HANA Cloud together with data from the architecture of the buildings from the SAP Cloud for Real Estate. The following analytic data sources are available in the SAP Data Warehouse Cloud:
- Building Data (SAP Cloud for Real Estate)
Building Hierarchy, Capacity + Workplaces (per Type) + Area Size (Work- and NonWork-Space), Status down to the level of a space - Occupancy Data (S/4HANA Cloud – Intelligent Real Estate)
Area not in use, Area in Use, Area Vacant and Area Occupied on Company Code Level - Financial Cost Data (S/4HANA Cloud – Finance)
Area Information, Cost per Building (operational, capital, administrative, consumption and other cost) based on Company Code (per Cost Center, internal Order, WBS Element) - Financial Actual and Plan Cost (S/4HANA Cloud – Finance)
Actual and planned costs with calculation of the variance, also considering the cost hierarchy based on Company Code - Contract Data (S/4HANA Cloud – Intelligent Real Estate)
Contract Master Data and Cash Flow Information (actual and planed records) based on Company Code
Starting from the current year, the information is provided looking back for the last 3 years and looking ahead for the next 3 years. If a different period is required for the data, this can be adjusted at a central point in the data model in the DWC. All currency amounts such as postings in company code currency or contract terms in condition currency are converted into the global currency of the source system.
All of these data sources can be used separately from each other in different dashboards.
There are two additional analytic data sources available in the Content Package that are currently not used in the predefined Dashboard, but these can easily be integrated if this information is needed:
- Land/Site/Parcel-Information
Information about Land, Land Area, Number of Buildings and Parcels, can be integrated based on Site. - Building Area in Detail
Area based on Component and Sub-Component, Area in total and separated in Workspace- and Non-Workspace-Area, can be integrated based on space level.
Structure of the dashboard
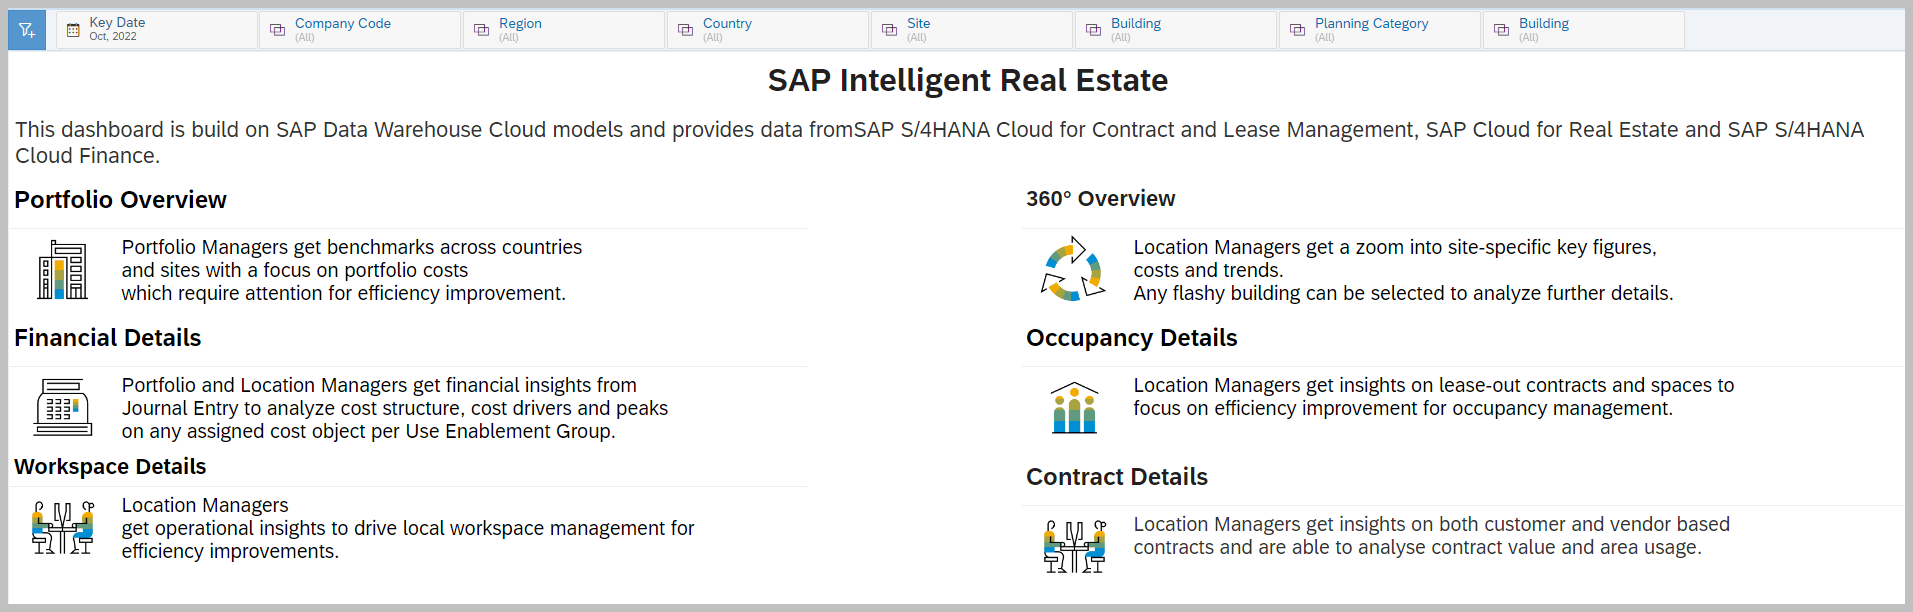
The dashboard provides the information from the source systems on 6 pages. These are structured as follows:
- Portfolio Overview
- 360° Overview
- Financial Details
- Occupancy Details
- Workspace Details
- Contract Details
The selection date (Key Date) can be specified via the story filter. When calling up the dashboard, the system current date is always set, but this can be changed by the user to display data from other time periods. It is also possible to set filters for the company code, region, country, site and building. The filter for the planned costs (planning category) can also be set. These filters affect the entire dashboard. The different pages can also be filtered by specific dimensions, e.g. by cost centers, contract types, etc..
In most charts, the data can be displayed hierarchically using the drill-down function. In addition to the cost hierarchy, there is a geographical hierarchy where you can go from the region to the building and sometimes down to the floor/space. In addition, a time hierarchy is also available.
Below are a few examples of how the data in the dashboard is shown:
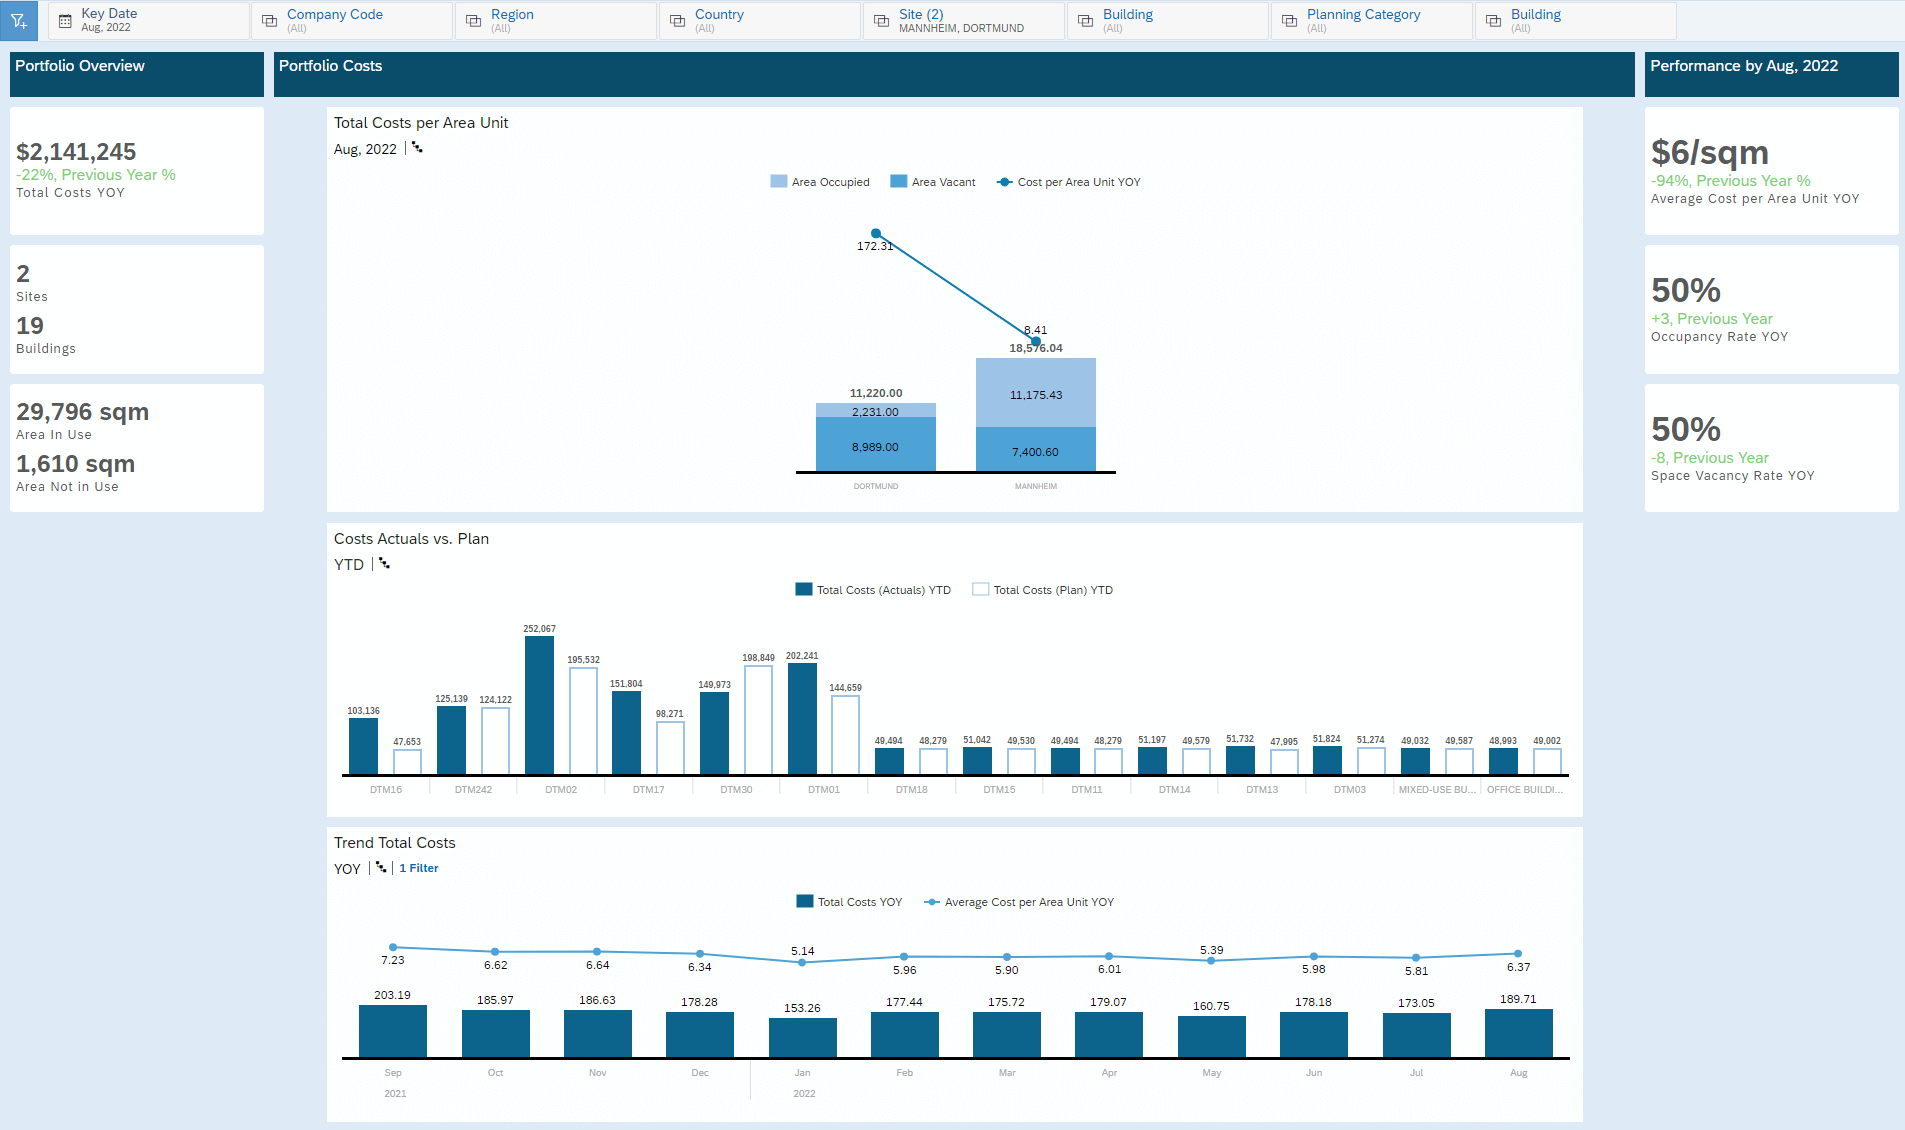
Portfolio Overview
This tab provides information about the area occupied and area vacant along with the KPI Cost per area unit. In addition, the comparison of planned and actual costs year to date is shown. The total costs are shown year over year. The breakdown of the data can be displayed via hierarchy from the region down to the individual building. The KPIs average cost per area unit, occupancy rate and space vacancy rate are determined on average year over year, including the deviation from the previous year’s value. Measures such as area in use/not in use, as well as the number of sites and buildings and the total cost year over year complete the overview.
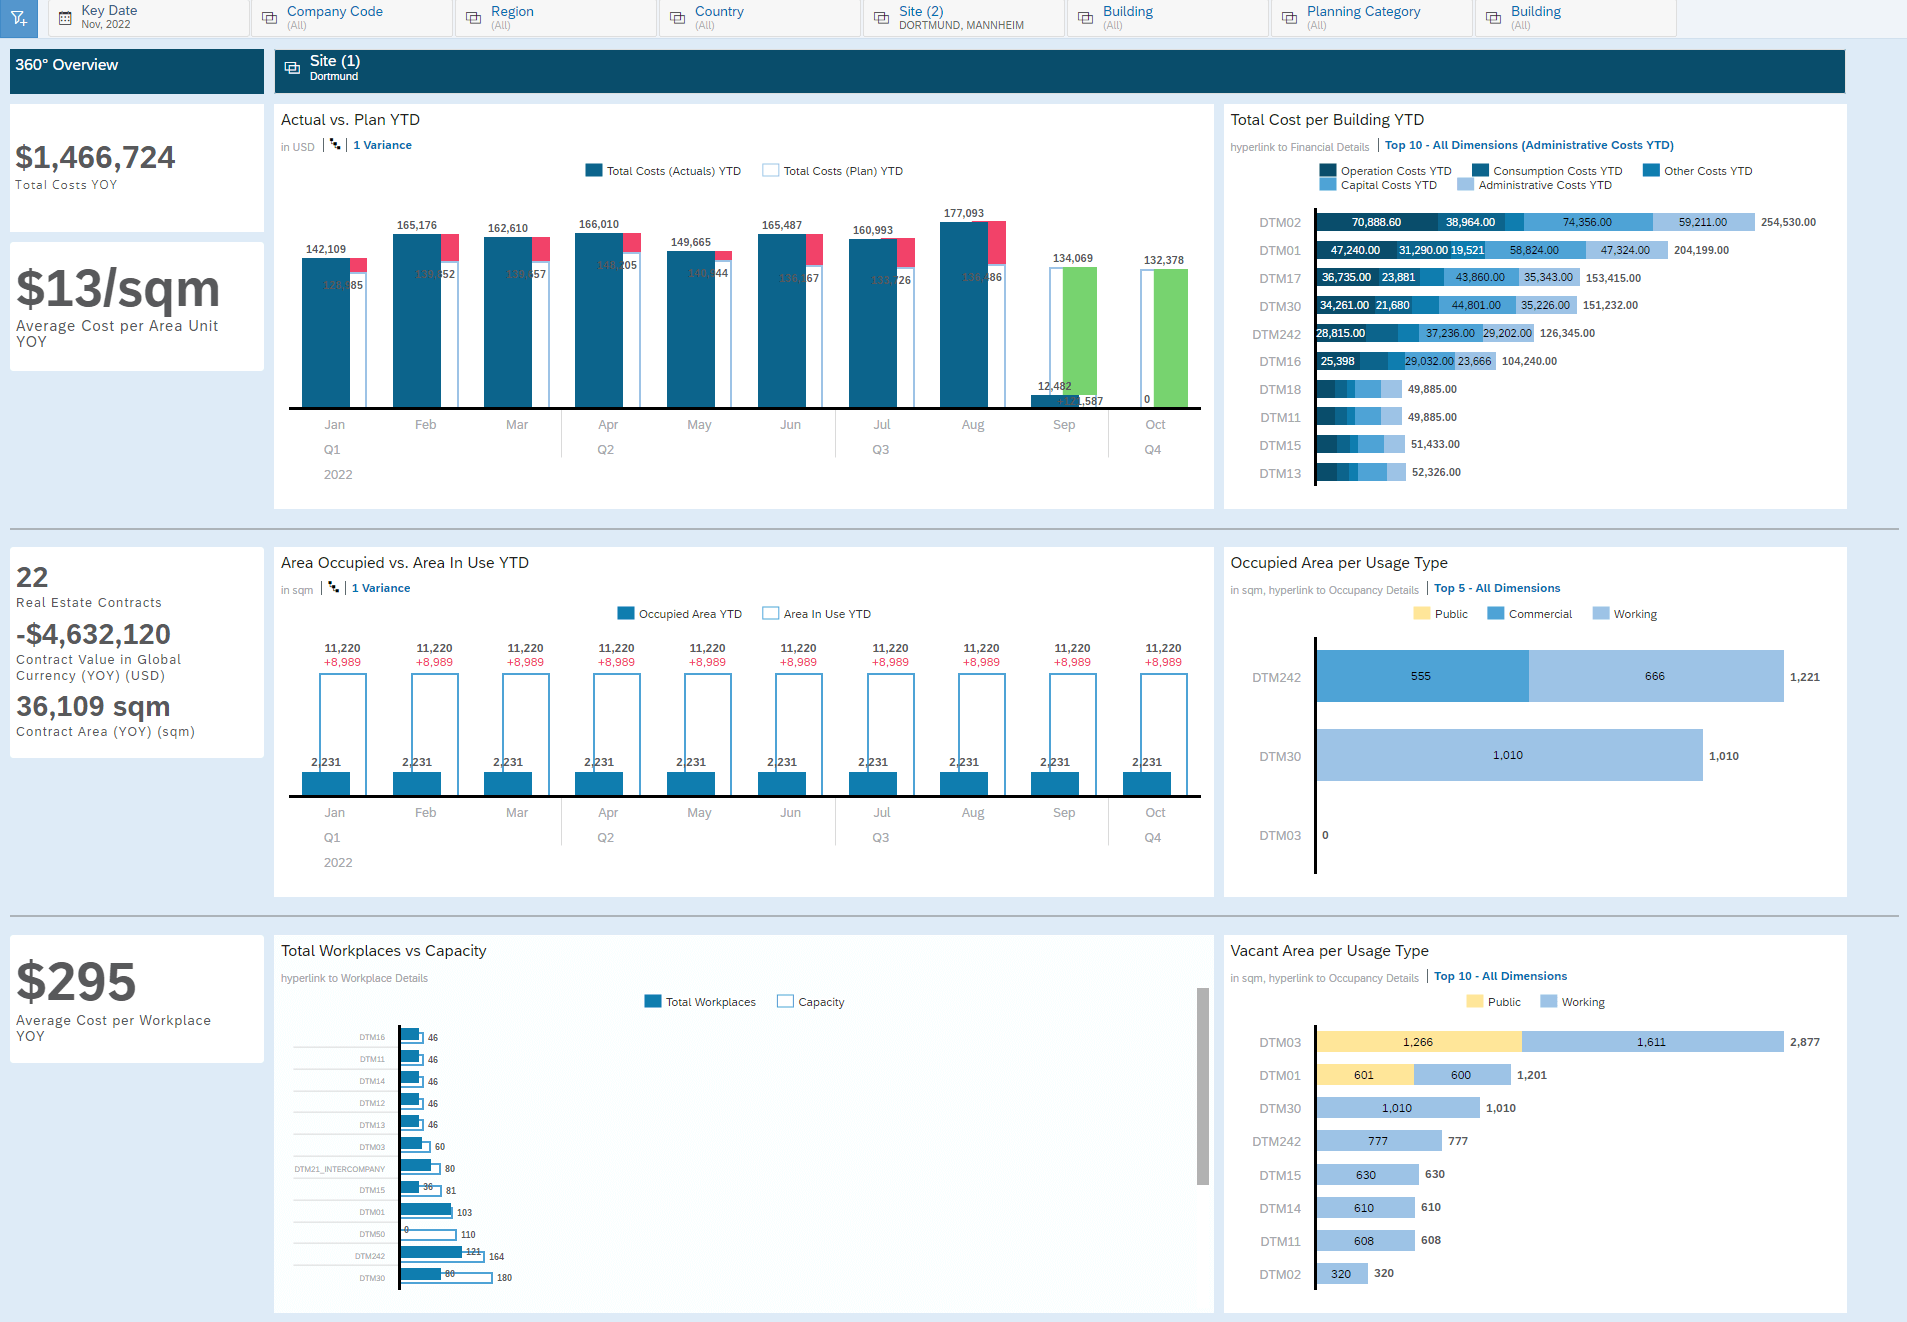
360° Overview
The 360° Overview page always provides the view on one site. In addition to the presentation of the costs (actual and plan) and the cost allocation, information about the utilization of the area (occupied and area in use) for the last year is also shown here.
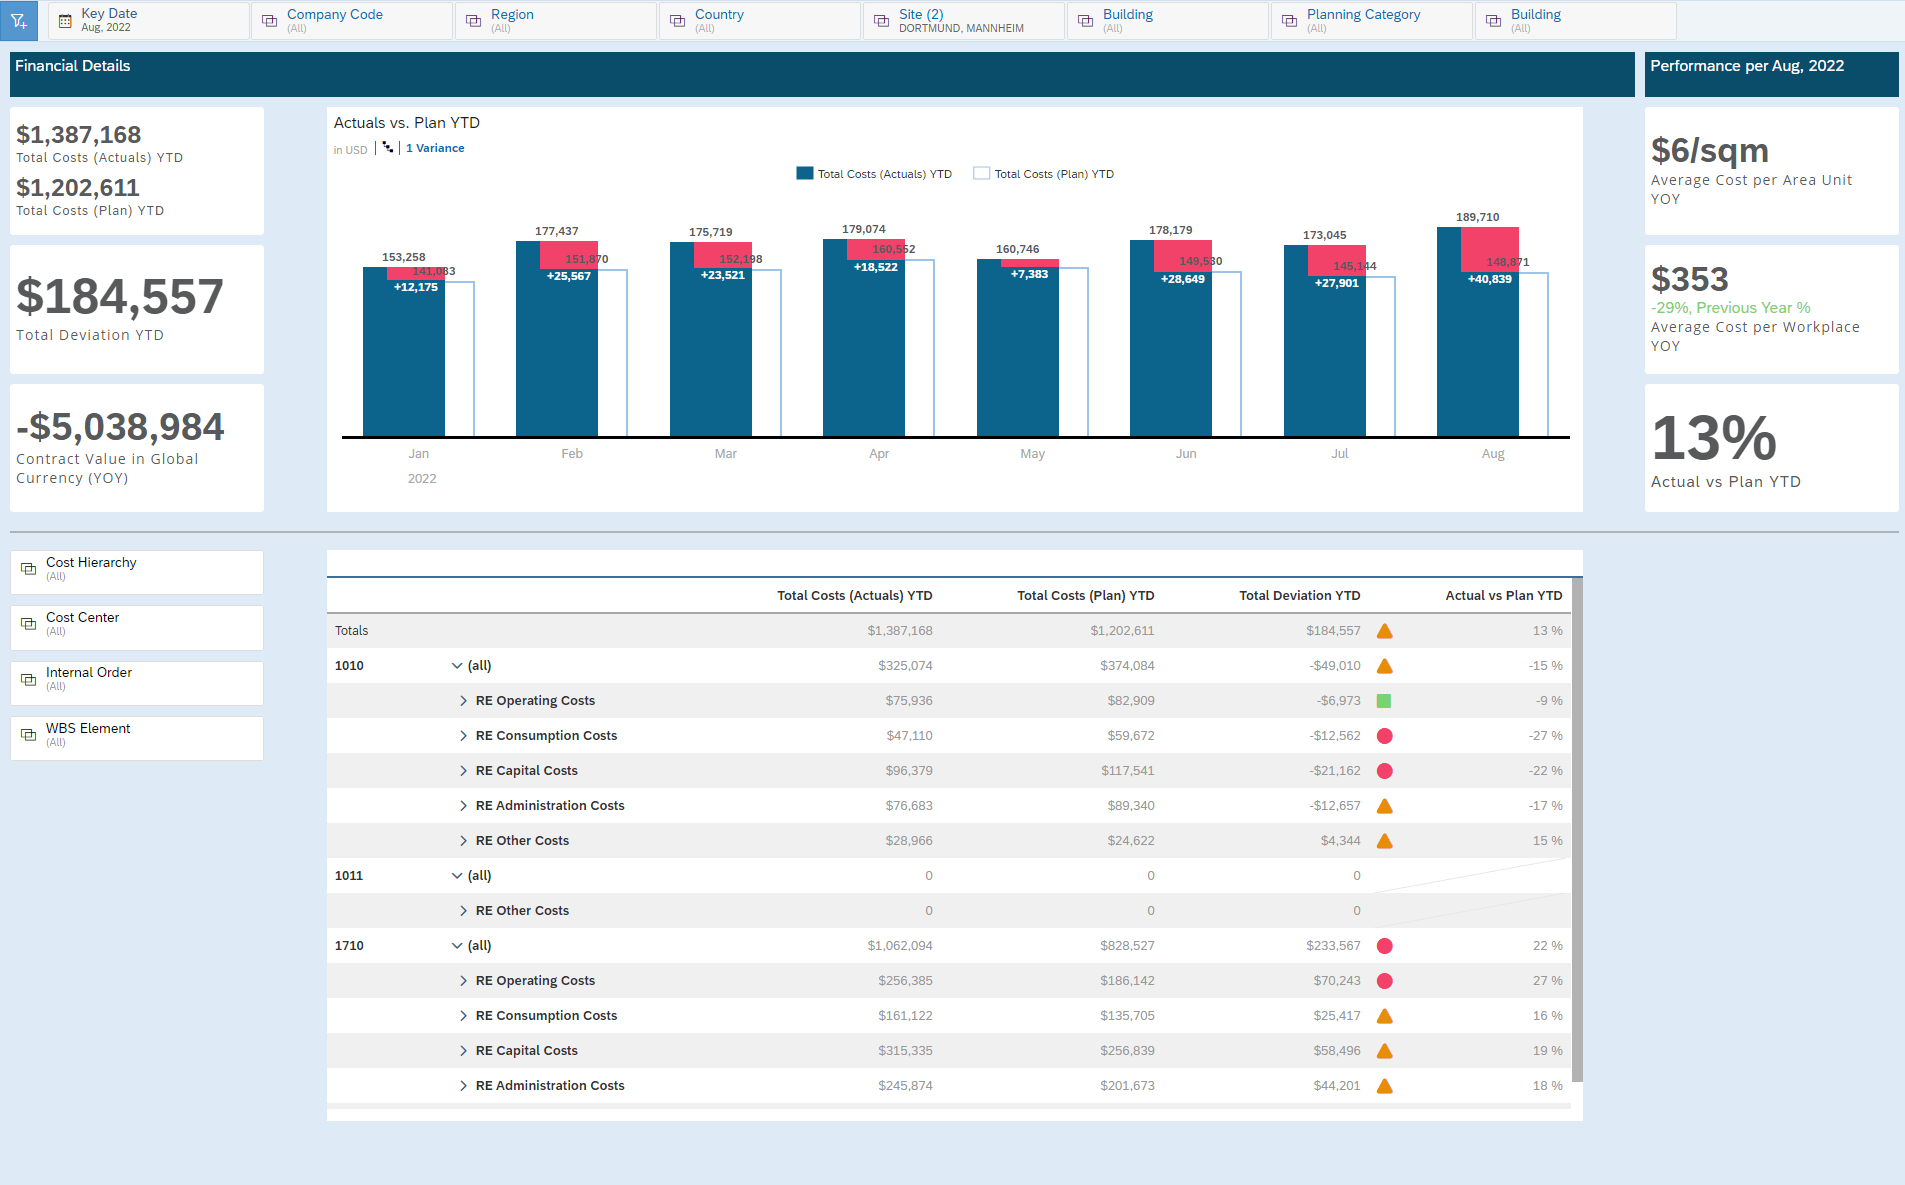
Financial Details
The financial overview is strongly influenced by the cost perspective. In addition to the actual/plan comparison, there is also a representation of the costs according to the cost hierarchy at company code level. Filtering is possible according to various dimensions such as cost center, internal order or WBS Element.
The average costs per area and per workplace are available as key figures. Thresholds in the cost deviation analysis can be adjusted by the user to the company requirements.
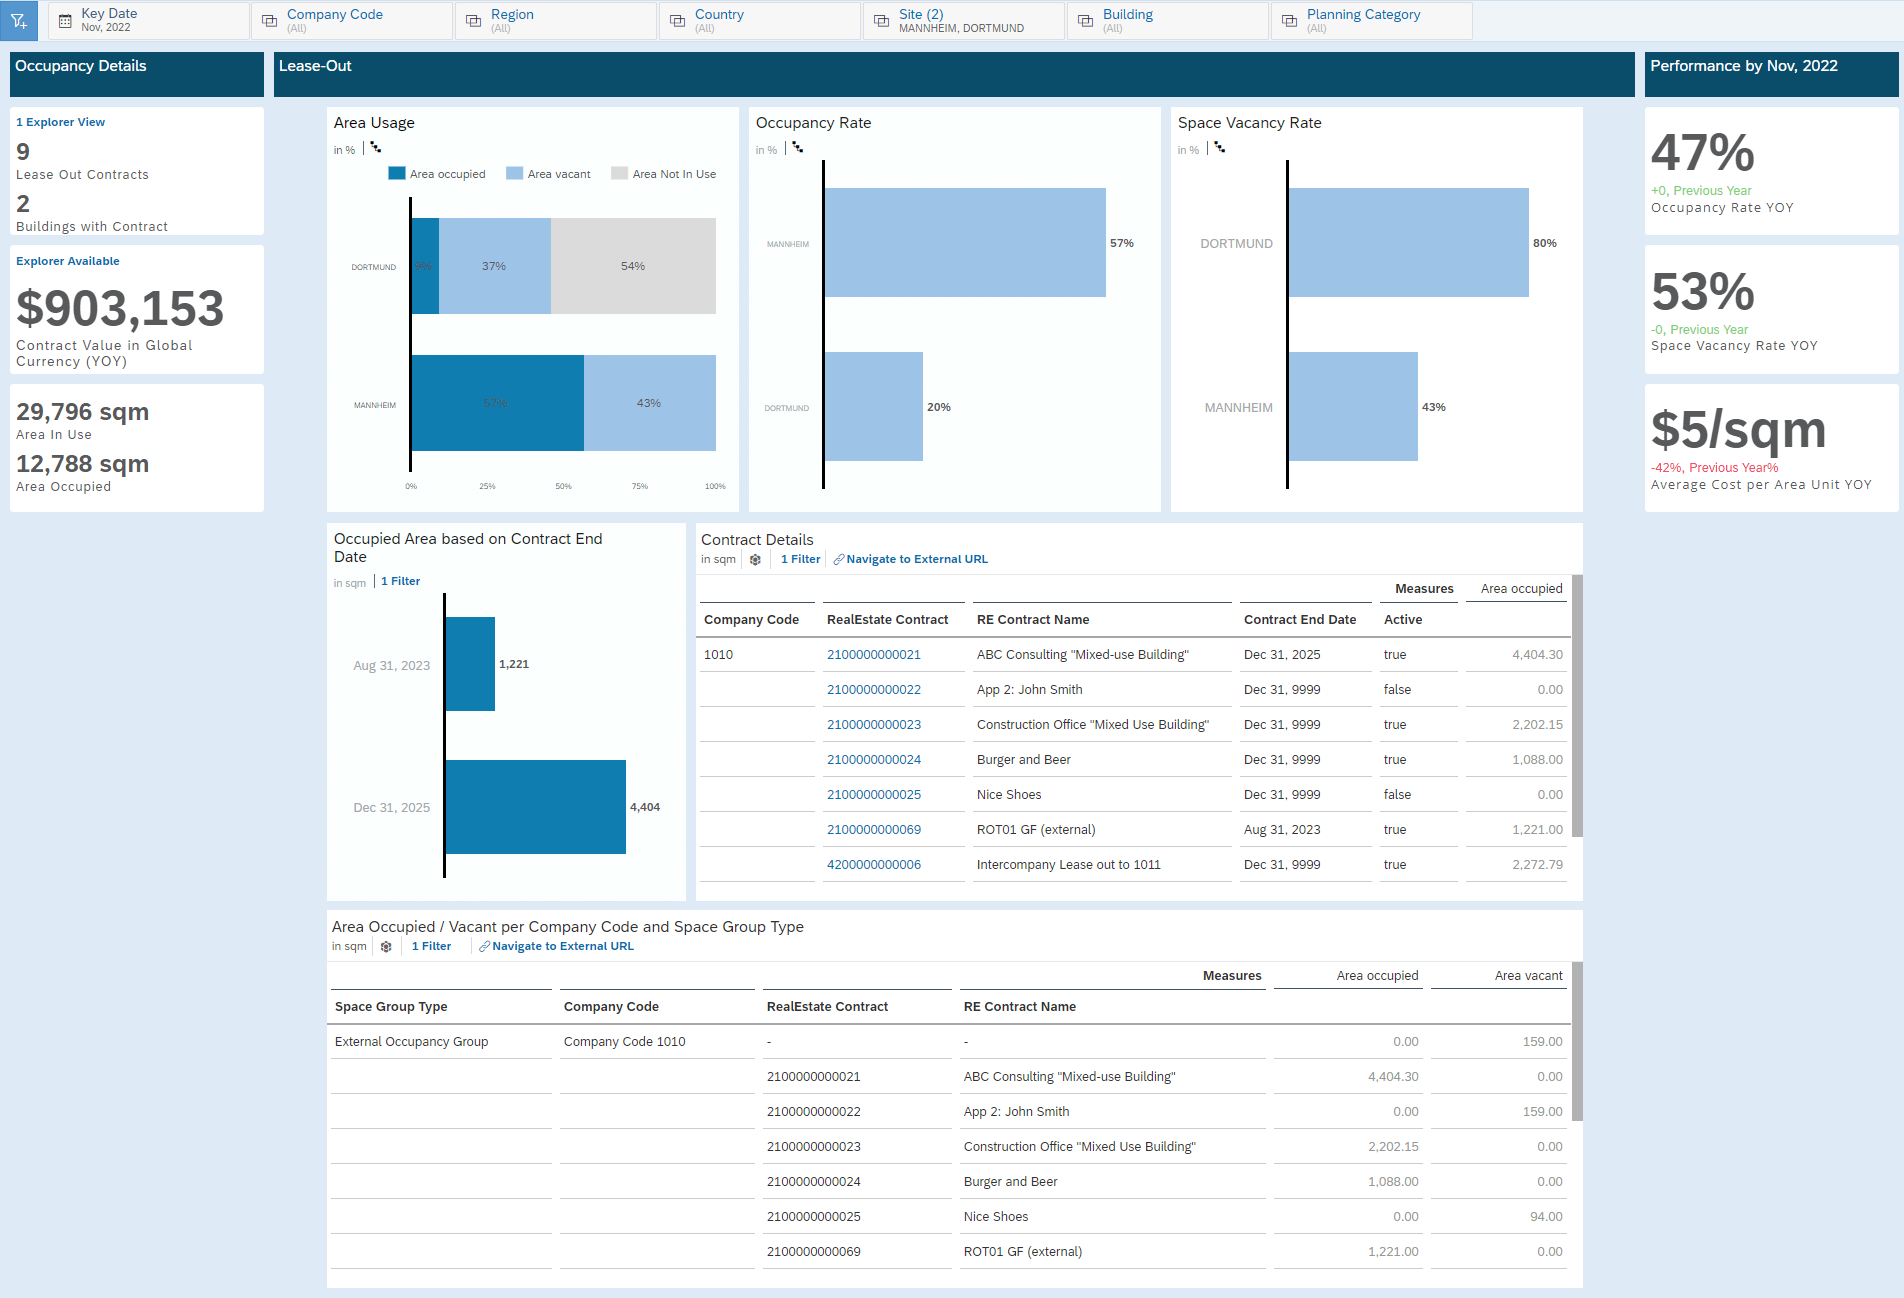
Occupancy Details
Here the view of the buildings is related to the area. Which space is occupied and rented, which is vacant and which spaces are not yet allocated. How is my occupancy rate and space vacancy rate related to the selection made? What is my average cost per area unit? Which contracts are active and when do they expire? By selecting the geo-hierarchy, this data can be displayed and analyzed in different granularity from region down to floor/space.
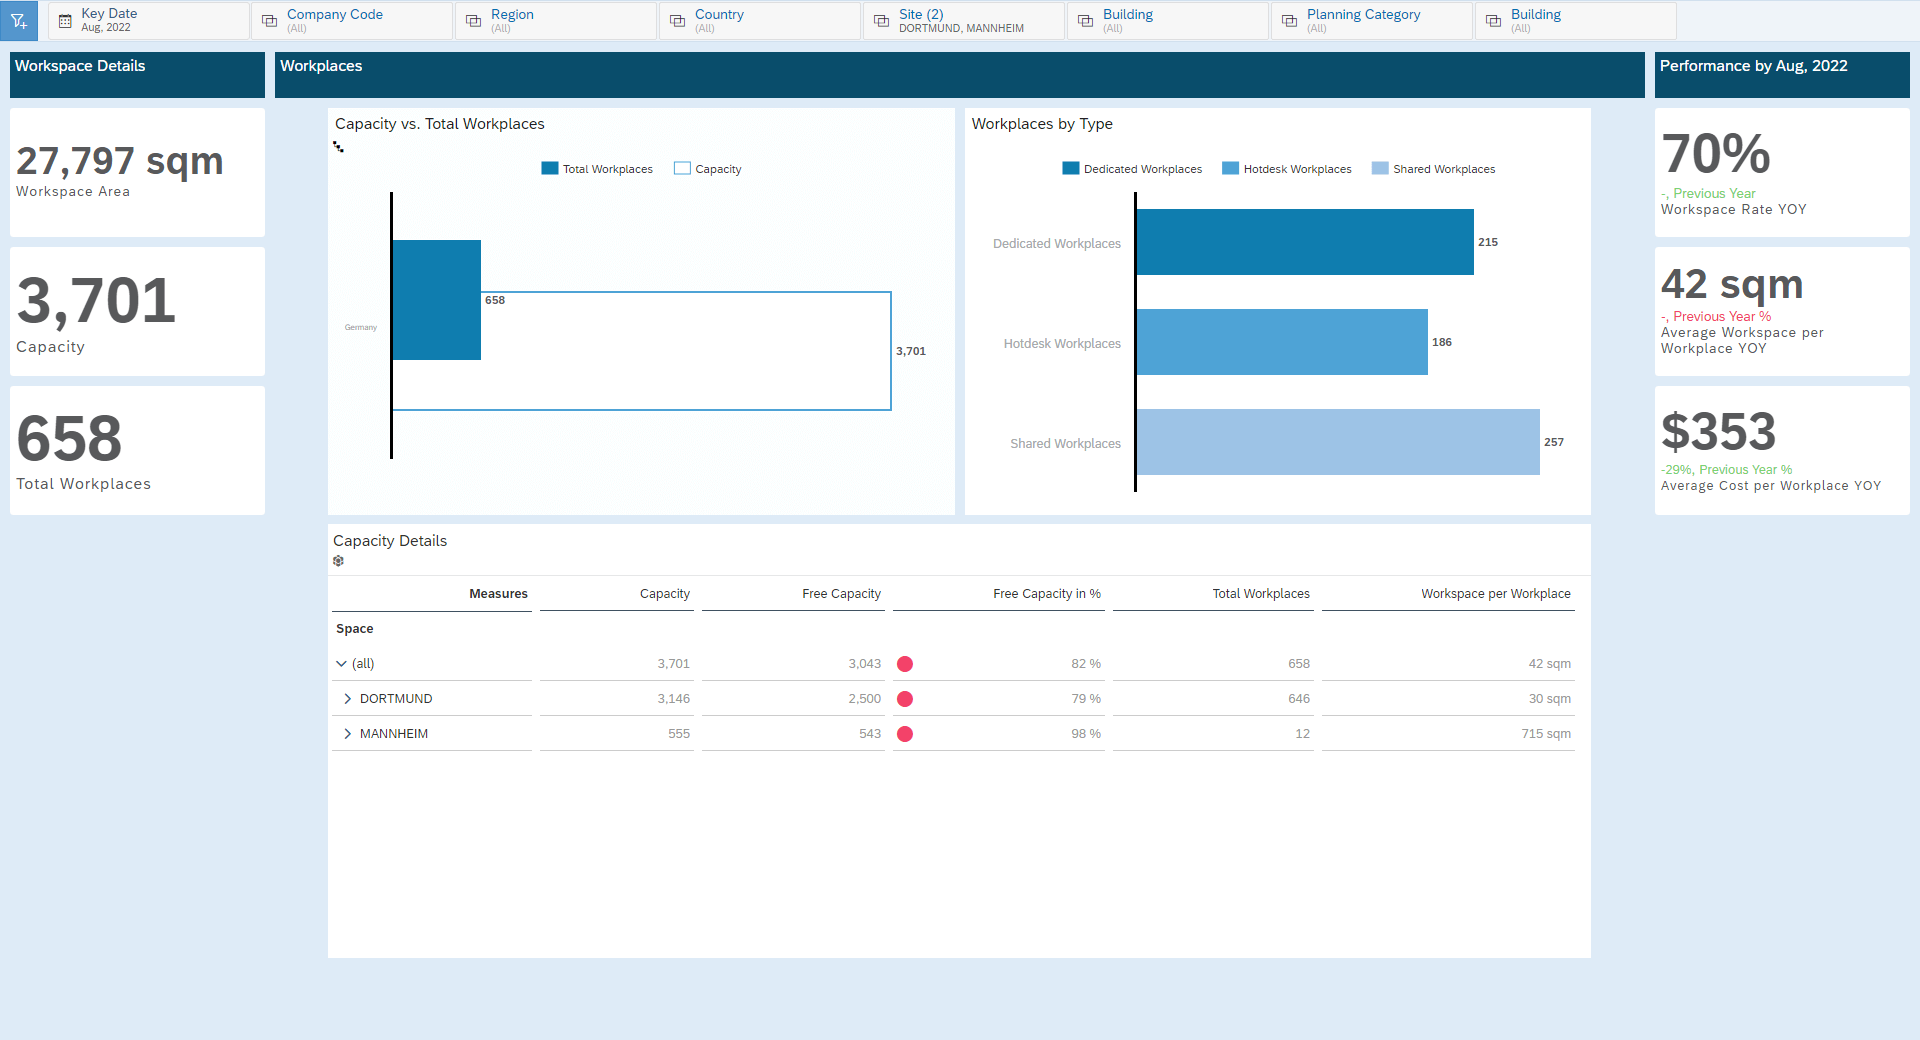
Workspace Details
The focus of this view is the relationship between the available capacity and the assigned workplaces. Where is there still free capacity, what are the average costs per workplace? What is the breakdown of workplaces by workplace type? It is also possible to drill down into the various hierarchical levels to analyze the data from top (per region) to bottom (floor/space).
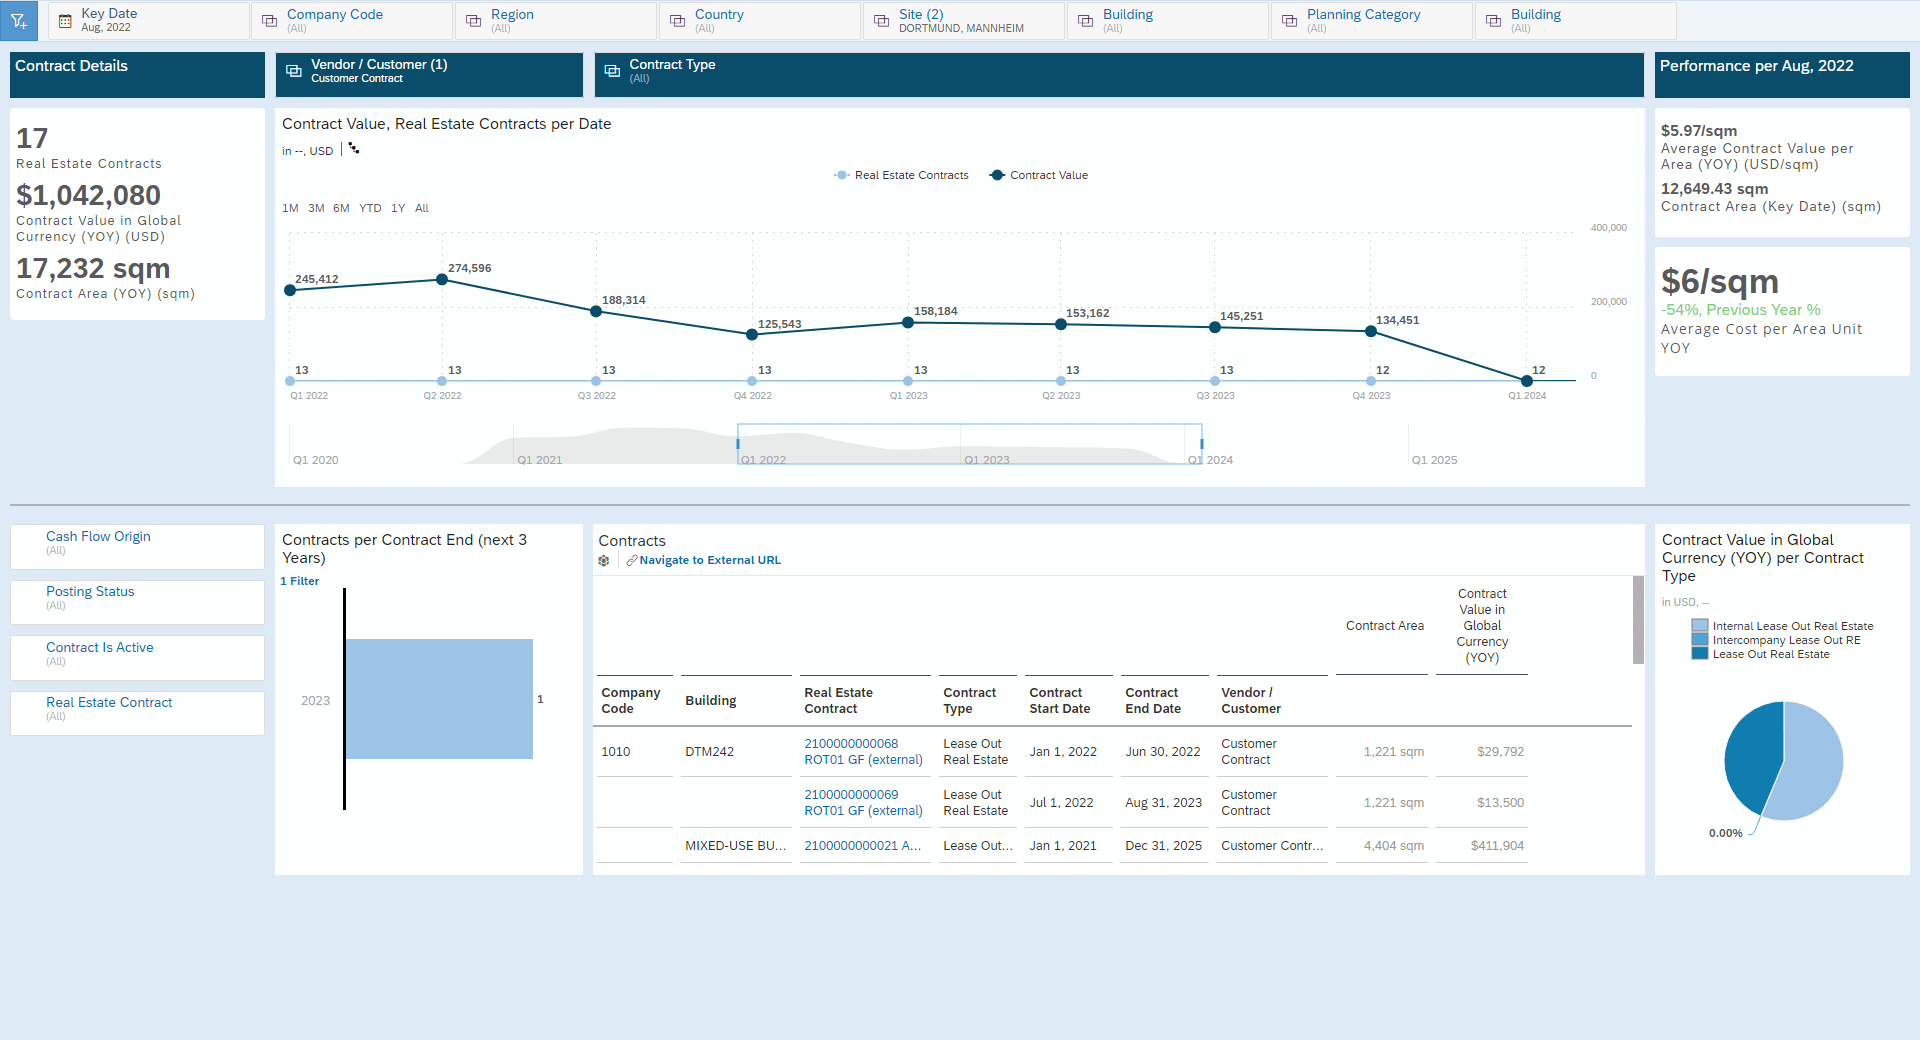
Contract Details
In the Contract Details view, you can switch to Customer Contracts and Vendor Contracts, and you can also filter by Contract Type. The Contract Value can be viewed on the timeline in the past and into the future, making it easy to identify trends and deviations. The tabular view shows all active contracts with the associated contract area and contract amount, the bar chart next to it can be used to filter contracts that expire in the next 3 years.
Business Questions to be answered
Here are just a few examples of Location and Portfolio Managers questions that can be answered with the dashboard.
- What are my most expensive buildings based on cost per space unit? What is the current deviation compared to the previous year?
- How have my costs developed in the last 3 years? Where were there major deviations from cost planning? What are the planned values for the costs for the next year?
- Which buildings or which regions have the highest energy consumption measured in terms of costs?
- What is the relationship between the available capacity and the assigned workplaces? In which buildings of a site do I still have free capacity? What are my costs per workplace in each country/region/site/building?
- What is the ratio of occupied area to vacant area measured by the occupancy rate or the space vacancy rate? Show me the top 10 or less 10 buildings based on these key figures.
- Where are there still areas that have not yet been assigned to an Enable Use Group? Show me the top 10 Buildings with area not in use.
- Which contracts with which amounts will expire in the next 3 years? Which area will be vacant as a result? How was the contract value based on Customer and Vendor Contracts last year and how is the situation in the next 2 years?
The dashboard supports decision-making based on past, current and future data for various business areas. Deviation analyzes can be used to identify and eliminate weak points.
Conclusion
The dashboard offers a broad view of the real estate business and provides information and key figures for all areas of the company that are important for controlling and influencing. The data sources themselves provide much more information, such as costs according to internal orders or cost centers, contract information at the level of condition types or flow types.
Many things can be customized, such as thresholds or direct links from the dashboard to the contract in S/4HANA Cloud or to the building in Cloud for Real Estate (BTP). The calculation of key figures can also be adjusted company-specifically in the SAP Analytics Cloud. As already mentioned, the data sources can be used independently of each other, so that topic-specific new dashboards with more depth and a higher level of detail can be created. For example, to create a separate contract dashboard which shows information down to the flow type or condition type.
All data models also contain the location dimension for each building, so that all key figures can be displayed on a map:
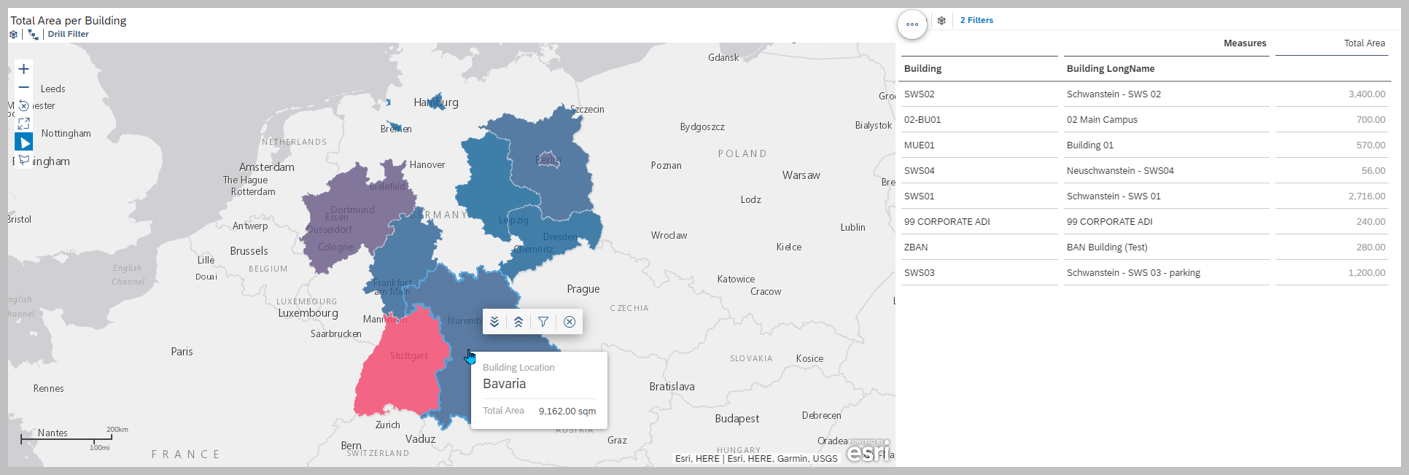
All in all, the SAP Analytics Cloud dashboard and the data models in SAP Data Warehouse Cloud are a very good basis that covers the core processes of the business with many options for individual extension. The Content Package is available in SAP Data Warehouse Cloud and the SAP Analytic Cloud Content Network since November 11, 2022 and is free to install, customize and use. Extensions and improvements will be made available on a regular basis.


