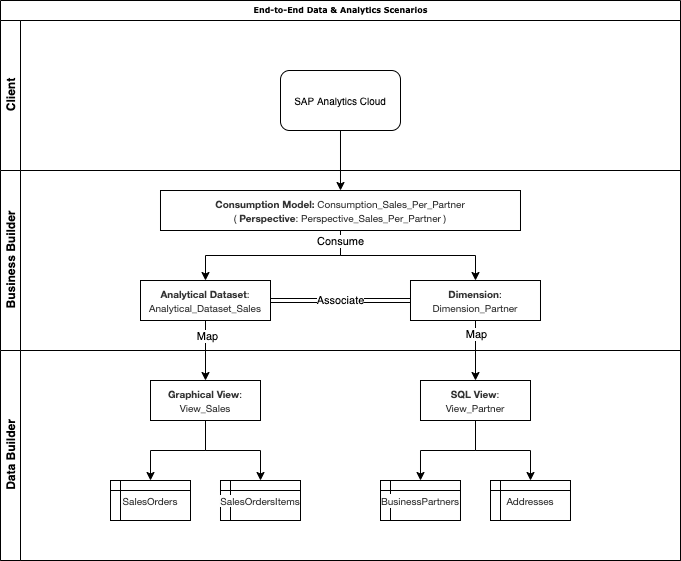
The overview diagram can be found as below:
Step 1: Import a Dataset with Data Builder
One way to bring data into SAP Data Warehouse Cloud is by importing flat files. A flat file is a file that does not contain links to other files or is a non-relational database. It stands on its own, for instance, like a single text-only file. The most common flat files are .txt and .csv files.
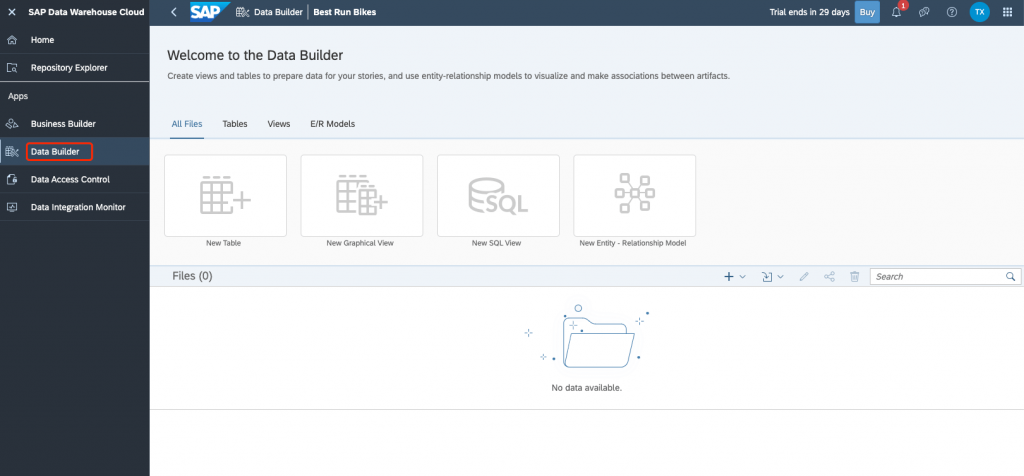
To access the Data Builder, simply click on the Data Builder icon on the left-hand side menu of SAP Data Warehouse Cloud.
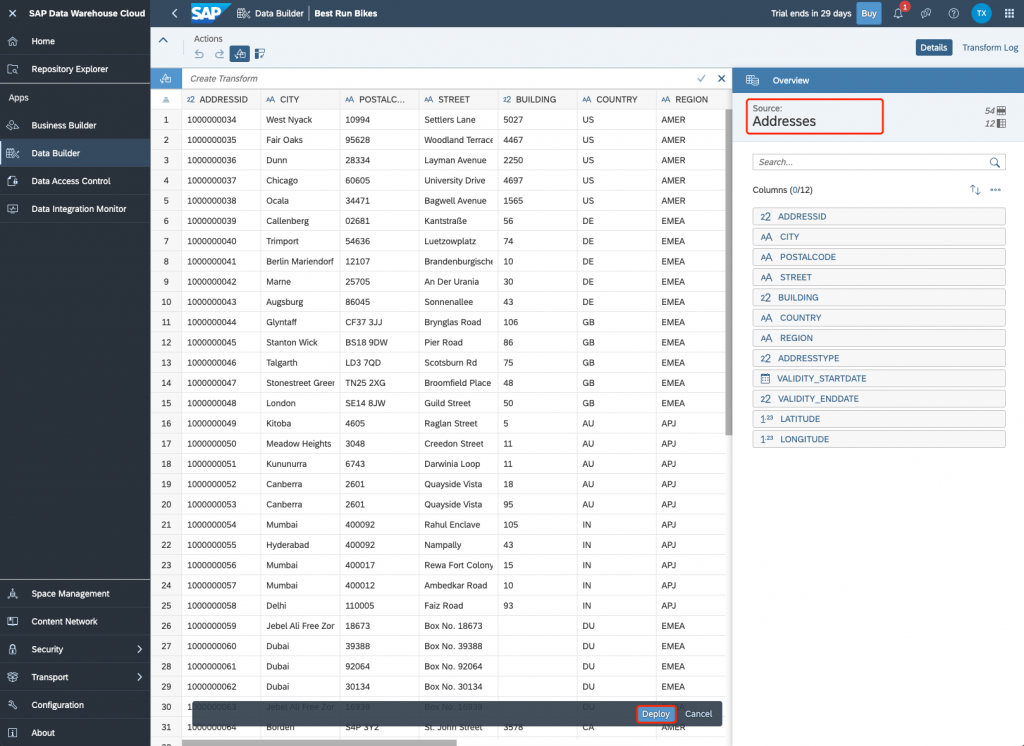
Simply click on the import CSV icon as shown in the image below.

Quickly review your data and then click deploy once done.
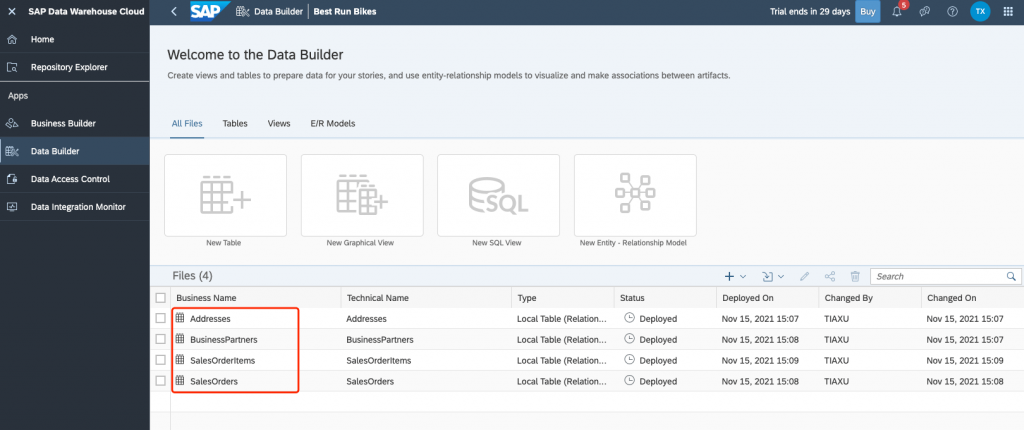
Add in your remaining CSV files by repeating the process.
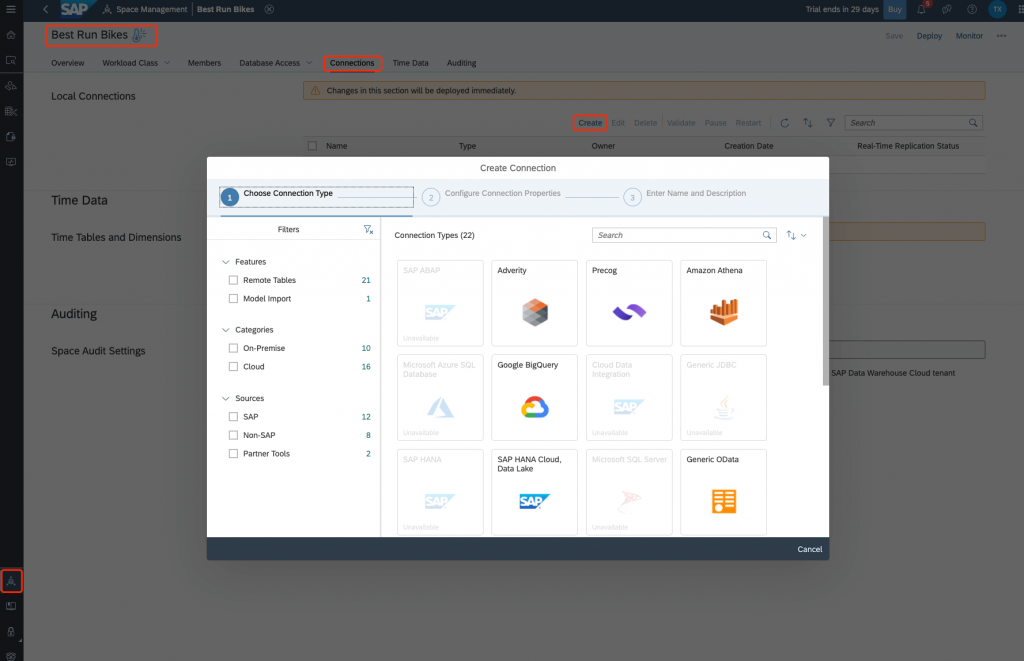
There are also other ways to bring in your data into your system. SAP Data Warehouse Cloud supports a wide range of connections to data sources. These can be connected in the Connections tab of your Space properties page. These include:
- Adverity
- Amazon Athena
- Amazon Redshift
- Amazon Simple Storage Service
- Cloud Data Integration
- Generic JDBC
- Generic OData
- Google BigQuery
- Google Cloud Storage
- Hadoop Distributed File System
- Microsoft Azure Data Lake Store Gen1
- Microsoft Azure Data Lake Store Gen2
- Microsoft Azure SQL Database
- Microsoft SQL Server
- Oracle
- SAP ABAP
- SAP BW
- SAP BW/4HANA Model Transfer
- SAP ECC
- SAP Fieldglass
- SAP HANA
- SAP Marketing Cloud
- SAP S/4HANA Cloud
- SAP S/4HANA On-Premise
- SAP SuccessFactors for Analytical Dashboards
Step 2: Create a Graphical View with Data Builder
In SAP Data Warehouse Cloud, you can use the graphical view builder to easily create data views. This allows you to work intuitively without having to be familiar with SQL statements.
In the graphical view builder, you have many resources to model your data, combine them from many sources and assigning business semantics that make your output easier to understand. Here is an example of a graphical view modelled in SAP Data Warehouse Cloud.
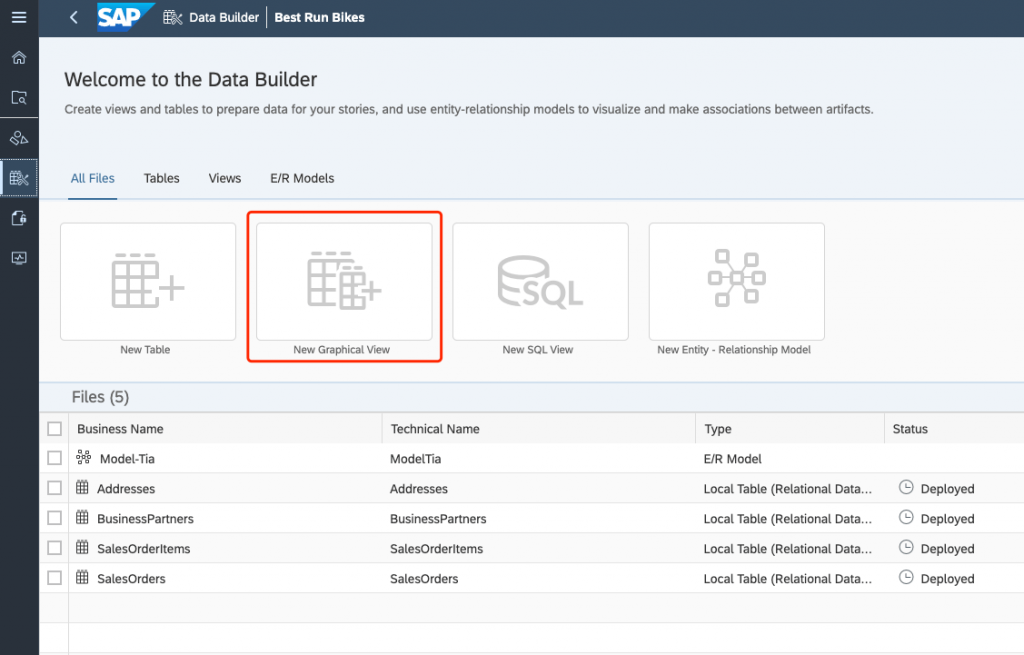
Go to the Data Builder and click on the New Graphical View button.
To start building your model, click and drag the SalesOrders table onto the canvas.
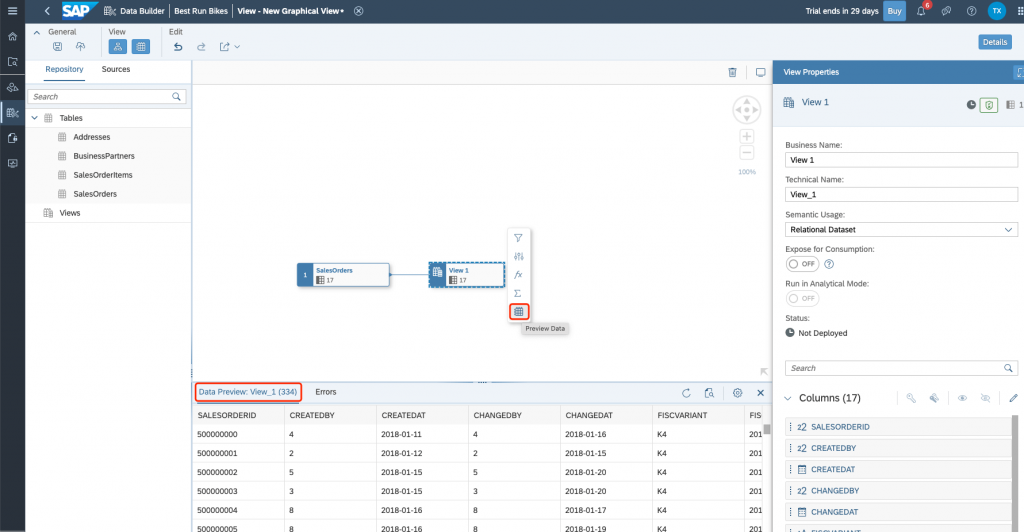
As you can see, an output node appears on the canvas as soon as your drop your table in it. The output node is where all of our join table information will appear once you’ve completed the model.
Click on the output node and then click on the data preview button to see a preview of the sales orders data.
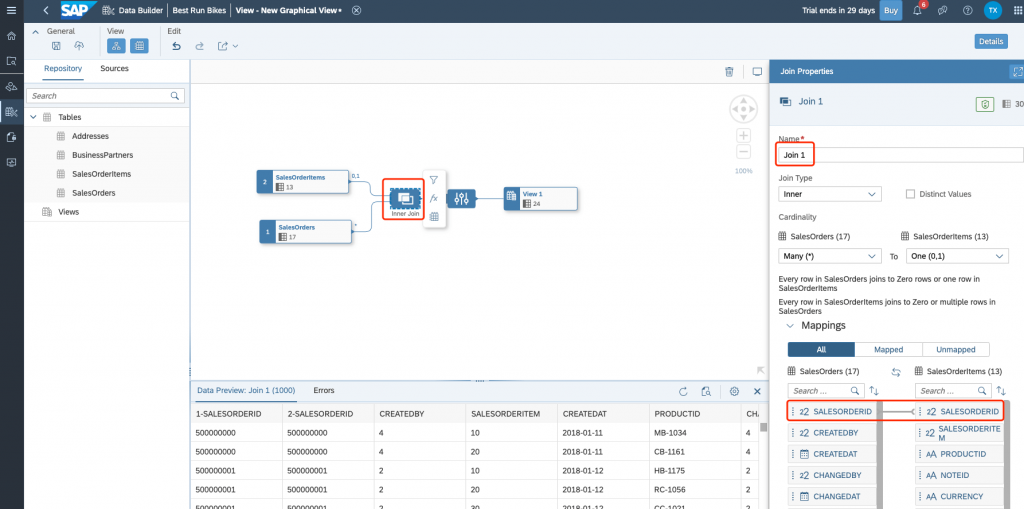
Next, drag the table SalesOrderItems on top of the SalesOrders table to join the two tables. The icon that has appeared is our join node called Join One. The column SalesOrderID from both tables is automatically joined based on entity-relationship model.
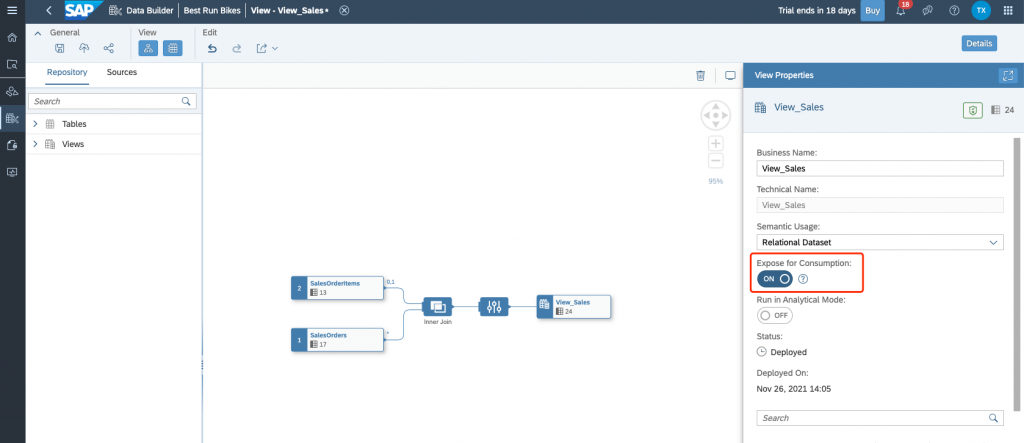
Expose for consumption from SAC

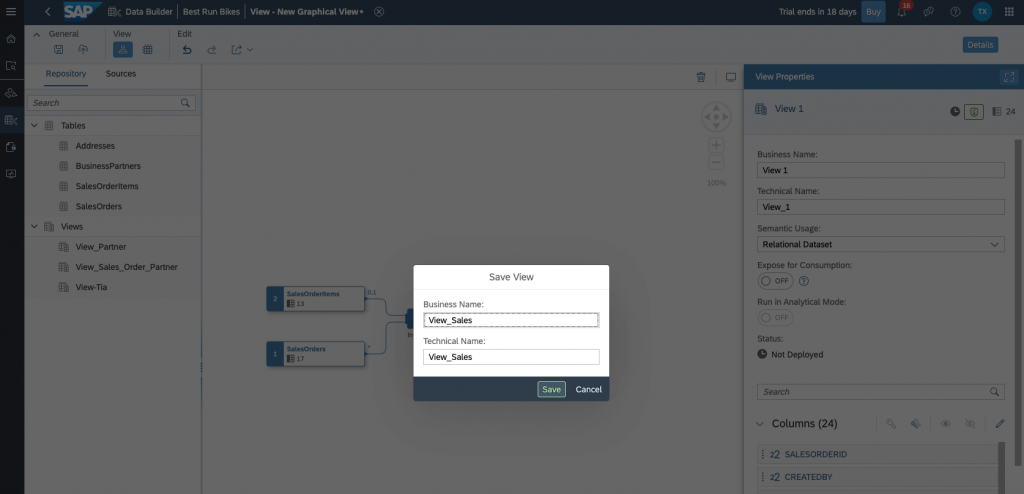
Save and deploy
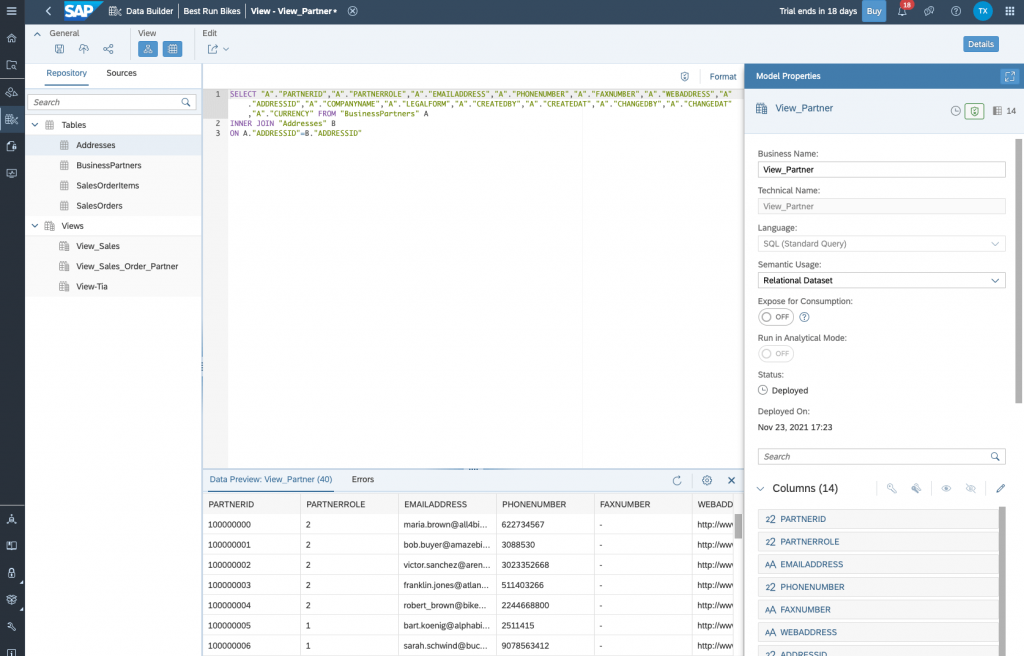
Step 3: Create a SQL View with Data Builder
In SAP Data Warehouse Cloud, you can also use the SQL view builder to create data views with SQL statements.
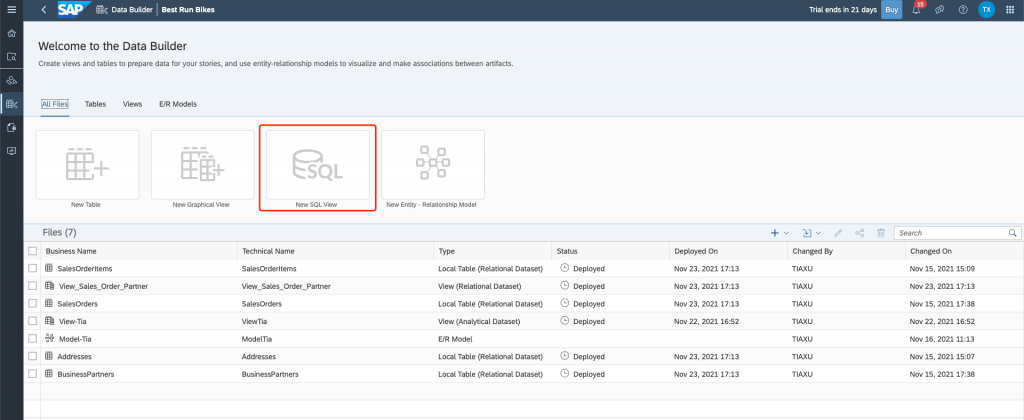
Drag the Table to the editor
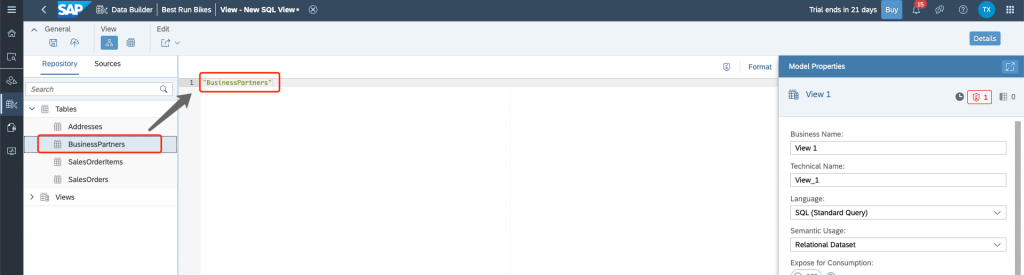
Add SQL statement
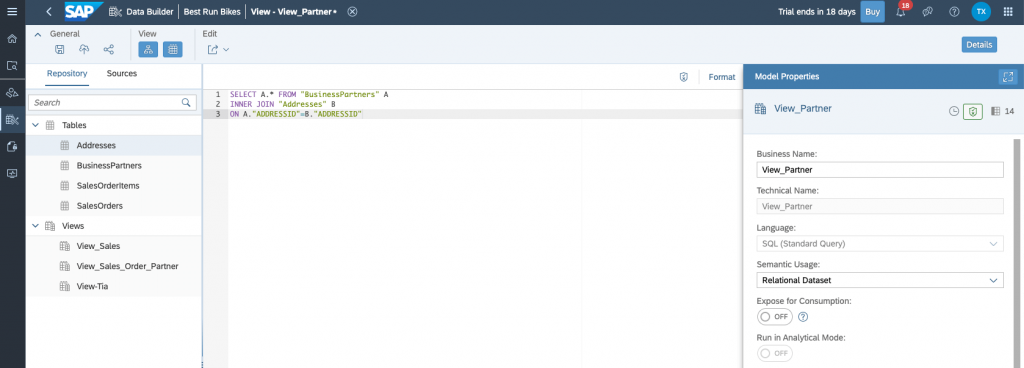
Validate the SQL:
SELECT A.* FROM "BusinessPartners" A
INNER JOIN "Addresses" B
ON A."ADDRESSID"=B."ADDRESSID"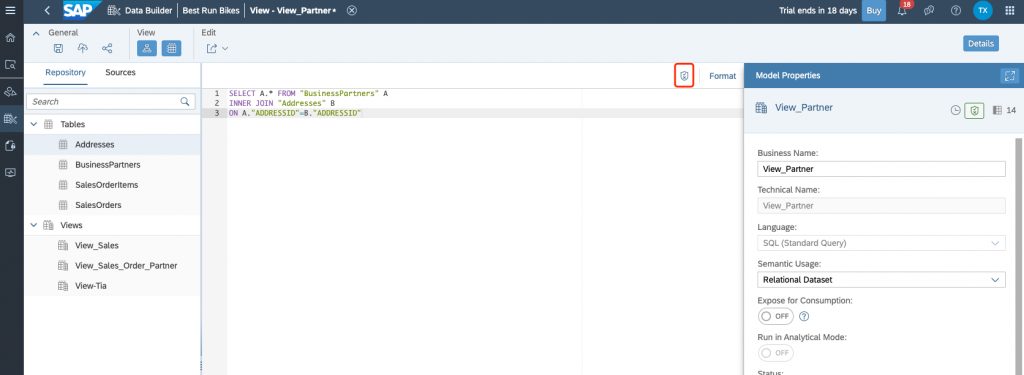
All the attributes would pop up.
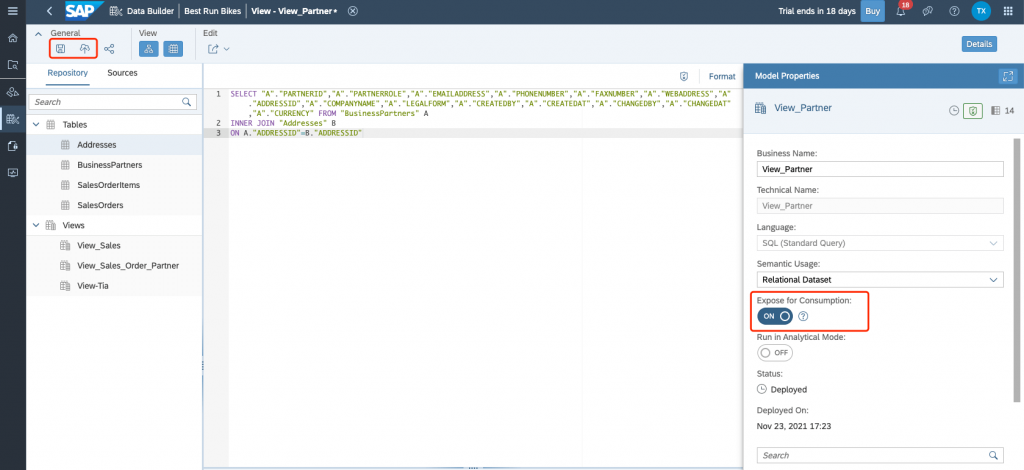
Expose and deploy it.
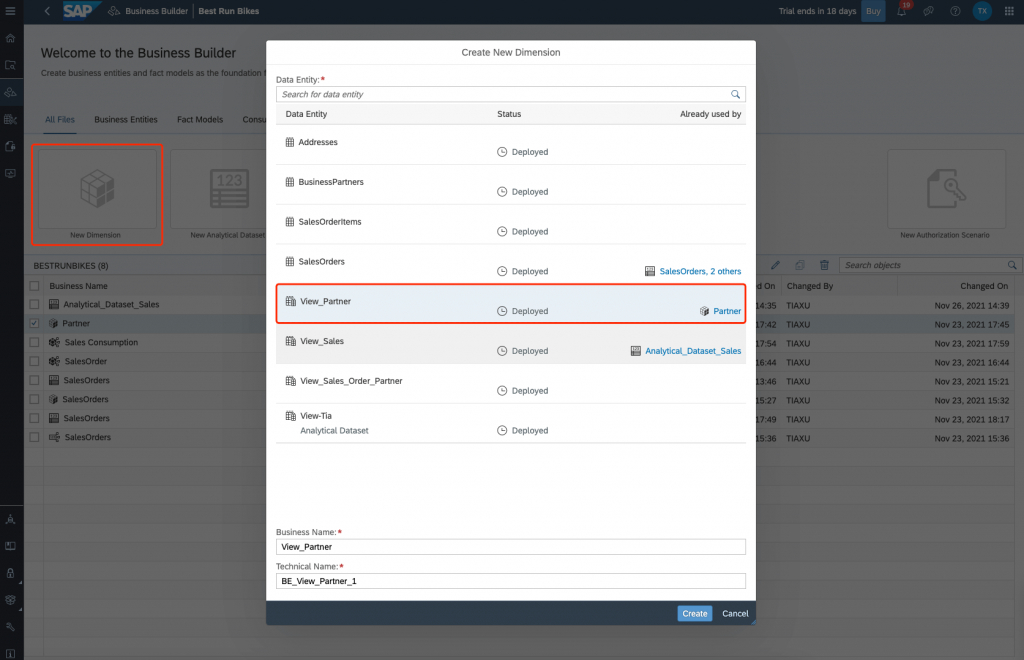
Step 4: Create a Dimension with Business Builder
In SAP Data Warehouse Cloud, click on the Business Builder icon.
Then, click on New Dimension.
Select the data entity you wish to use in this dataset. Either click on the entity you want to use, or search for it by using the search field on top of the pop-up window.
Change the Business Name and Save it.
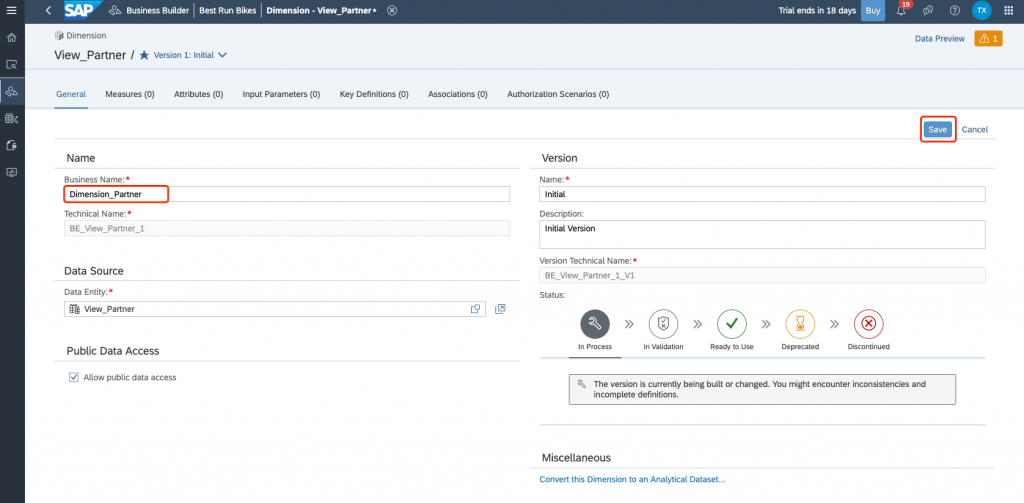
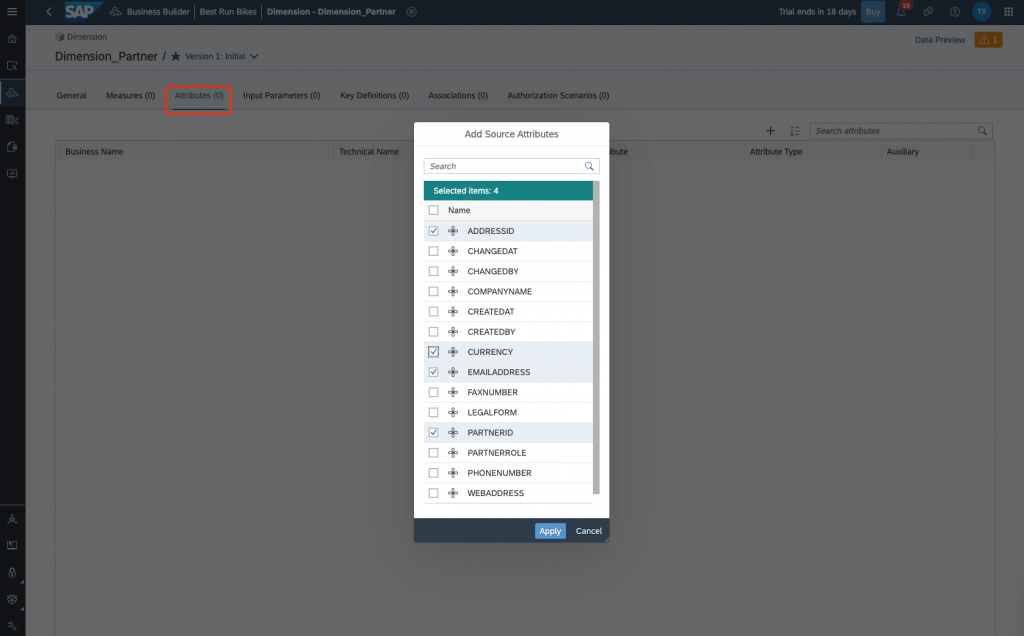
Now it’s time to add attributes to your dimension.
Click on Attributes on the top menu. To add existing attributes, click on the Add Source Attributes button.
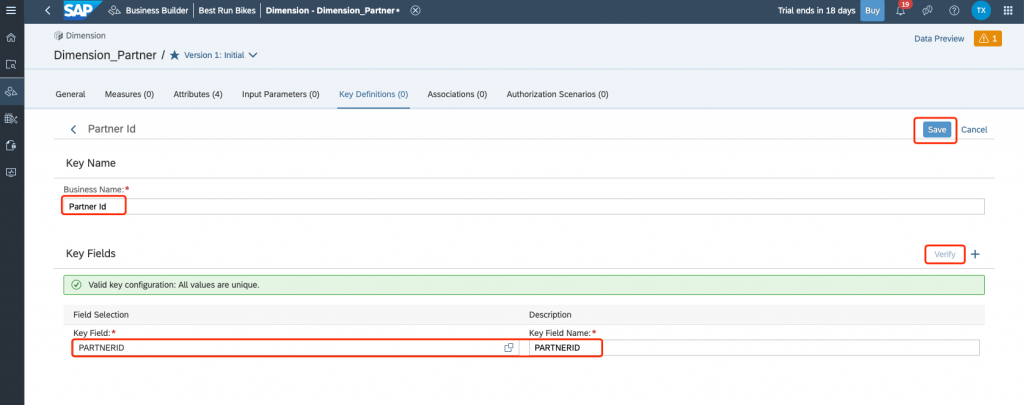
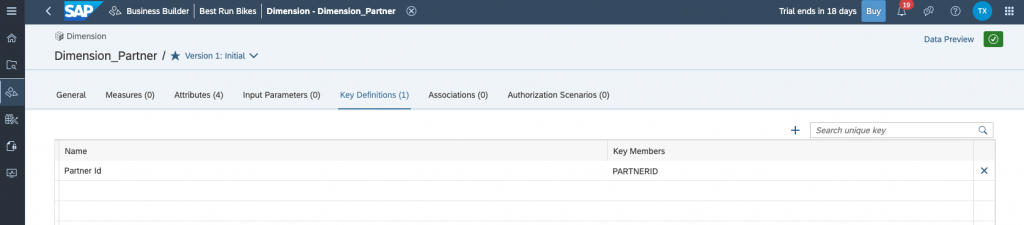
Add a key definitions
Step 5: Create an Analytical Dataset Associated with Dimension with Business Builder
The Business Builder helps you instantly model your organizational data in business terms. With it, you can create business entities and relationships with an easy to understand structure, making business users more independent from IT.
In practice, it allows business users to collaborate and create data models in SAP Data Warehouse Cloud based on a semantic view of the organization’s data. Once all the data is setup and made available by IT in SAP Data Warehouse Cloud, then it’s easy to give permissions to the right people, enabling you to get your data ready to provide business insights.
To create your business scenarios with the Business Builder, here are the objects you can create:
– Business Entities (Analytical Datasets or Dimensions)
– Fact Models
– Consumption Models and Perspectives
– Authorization Scenarios
Business Entities: Analytical Datasets or Dimensions
A business entity is based on a view created in the data layer, and it represents an object, such as information about products or sales, including all selected attributes and measures. In the Business Builder, you can create associations between facts and attributes coming from a view in the data layer. Business entities can be either an analytical dataset – which is a fact table with measures and foreign keys – or a dimension – which is tables containing only attributes.
Business entities are independent from the data layer and include versioning to allow you to have a high level of control.
Fact Models
A fact model is a combination of multiple business entities, including facts and dimensions, as well as added calculations across multiple facts. Typically, fact models are used to show more complex yet generic metrics or KPI’s, such as Pipeline Coverage. Fact models can be nested, which can help make this model very re-usable.
Consumption Models and Perspectives
Perspectives allow you to select only specific attributes and measures and focus on them to create the best input to visualization and consumption tools, like SAP Analytics Cloud.
A consumption model allows you to combine business entities and fact models to create an output that answers a concrete business question. A consumption model can contain multiple perspectives. You can enrich business entities with additional calculations if necessary. Once you are done with a consumption model, you can deploy it to any target visualization client, such as SAP Analytics Cloud or 3rd-party tools via SQL.
To model a meaningful consumption model, business entities define associations between each other. All potential association targets can be pre-defined on the data layer to provide business users with a variety of modeling options when preparing their use case-specific consumption model. Designating the right measures to your business entities is the first step towards fully utilizing the powerful capabilities of the Business Builder in SAP Data Warehouse Cloud.
Authorization Scenarios
An authorization scenario is a way to restrict access to parts of the data within a business entity. It’s reusable and can be applied to any business entity in SAP Data Warehouse Cloud.
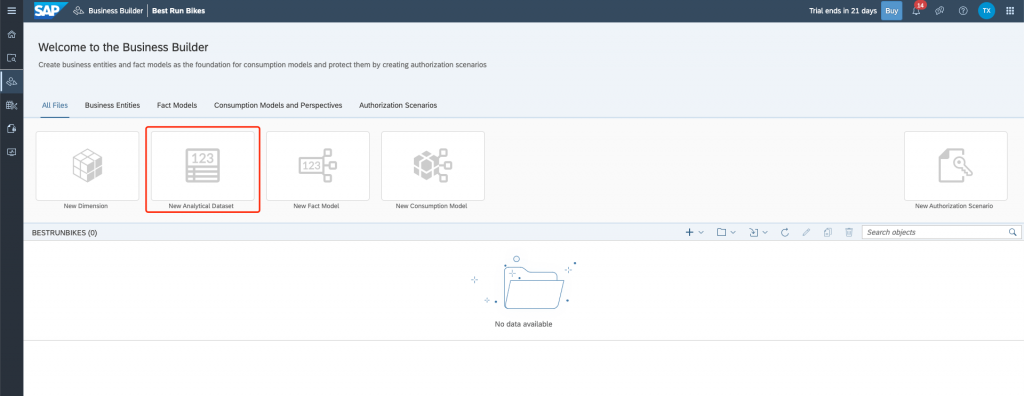
In SAP Data Warehouse Cloud, click on the Business Builder icon. Then, click on New Analytical Dataset.
Select the data entity you wish to use in this dataset. Either click on the entity you want to use, or search for it by using the search field on top of the pop-up window.
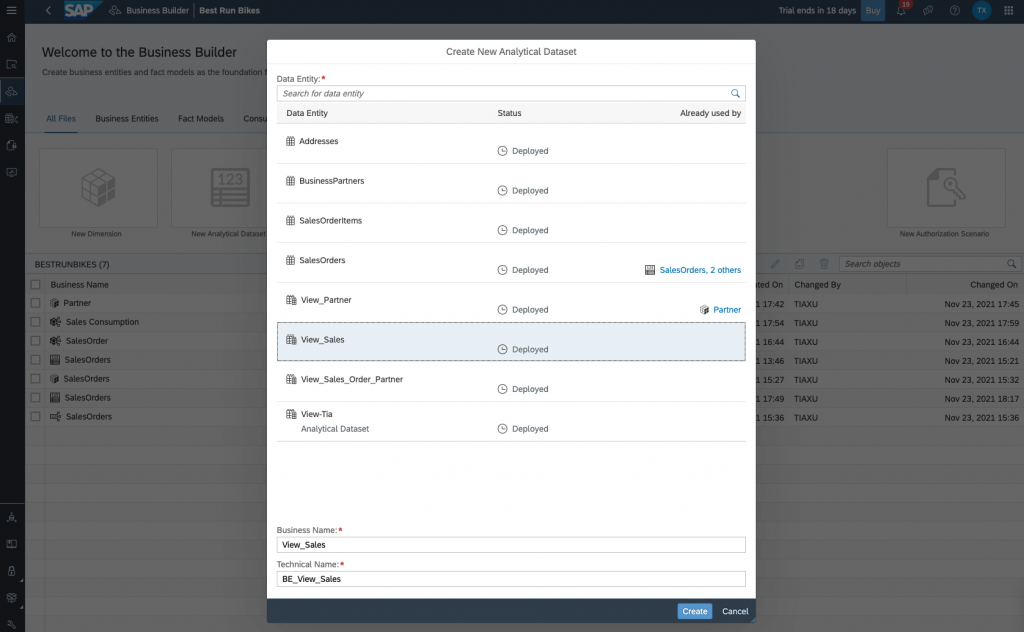
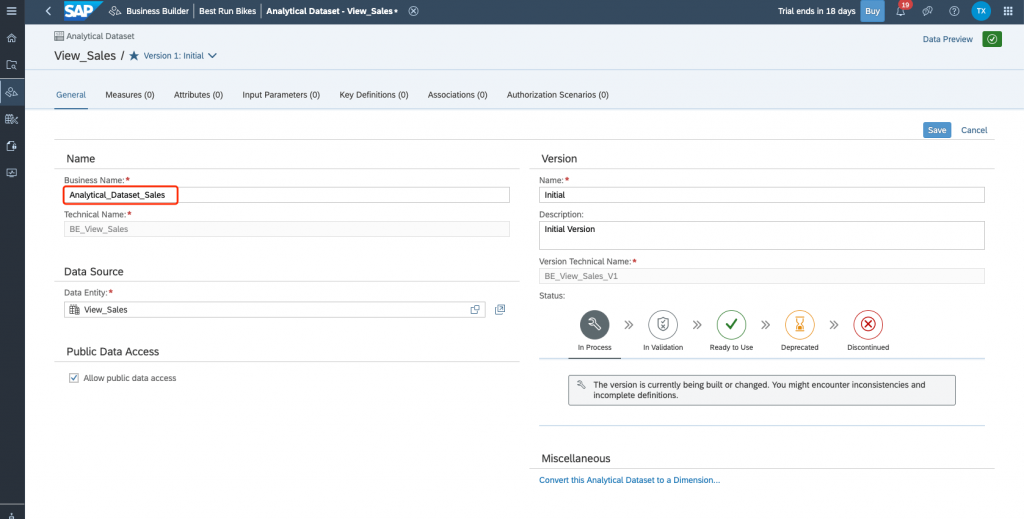
Click on Create. Change Business Name and Save it.
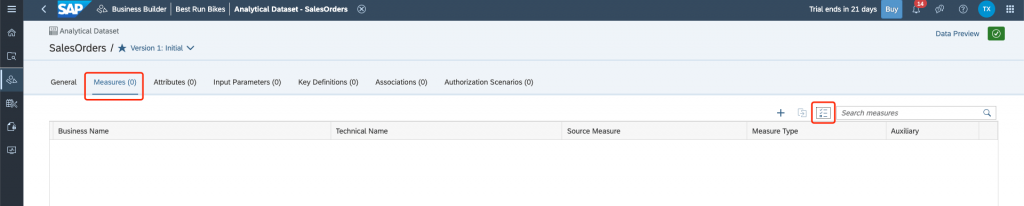
Now that your analytical dataset is created, it’s time to populate it. Start with adding measures.
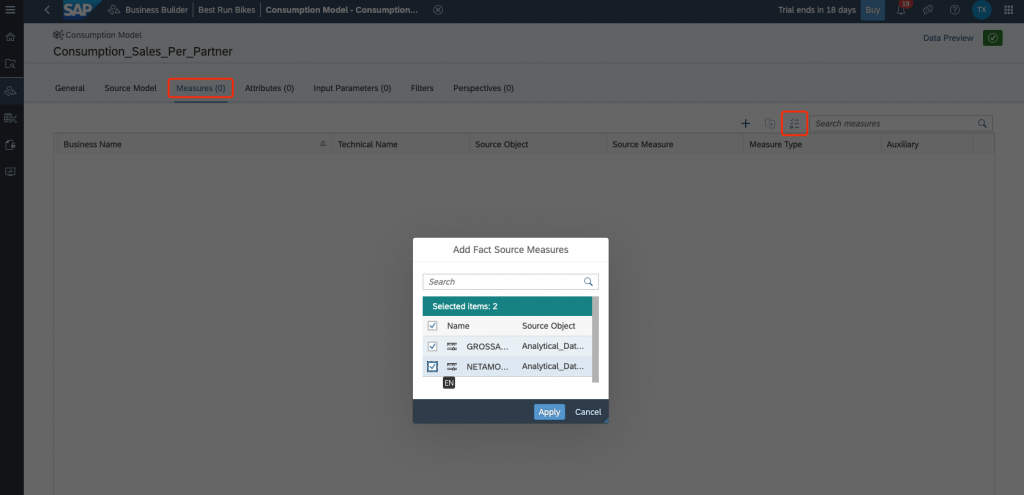
Click on Measures on the top menu. To add existing measures, click on the Add Source Measures button.
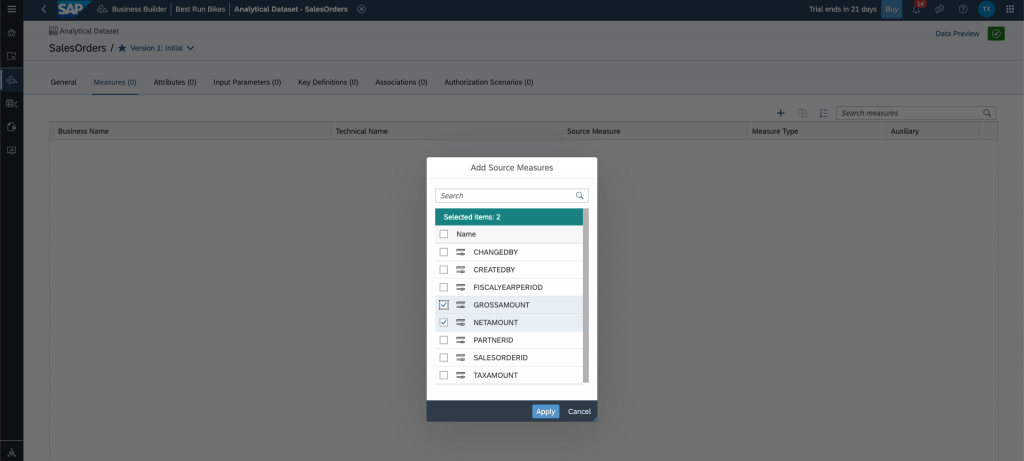
A pop-up will open to show you the measures available in the source data. Check all the measures you wish to include. Then click on Apply.
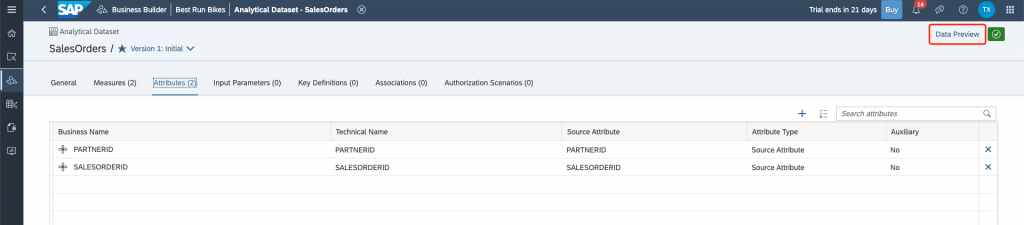
Now it’s time to add attributes to your analytical dataset.
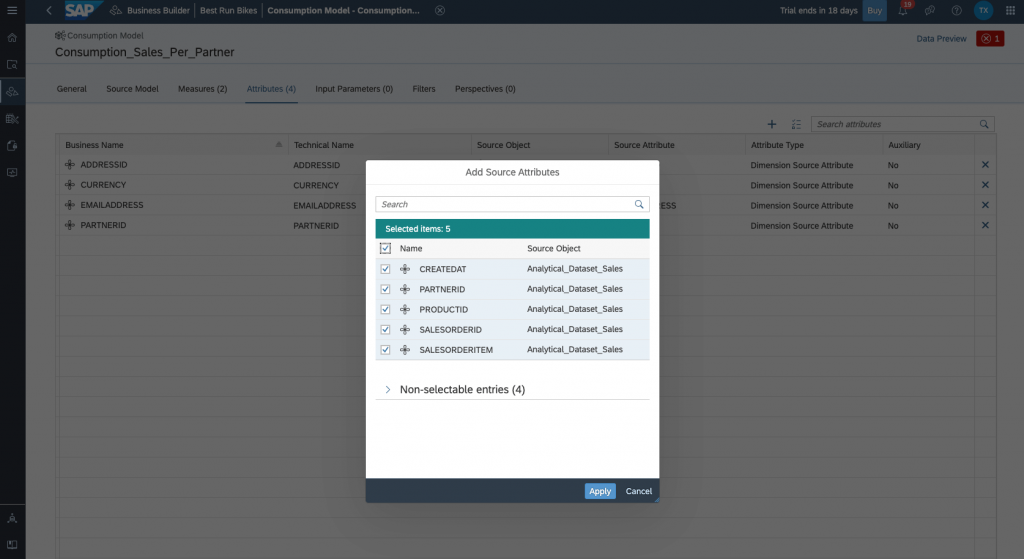
Click on Attributes on the top menu. To add existing attributes, click on the Add Source Attributes button.
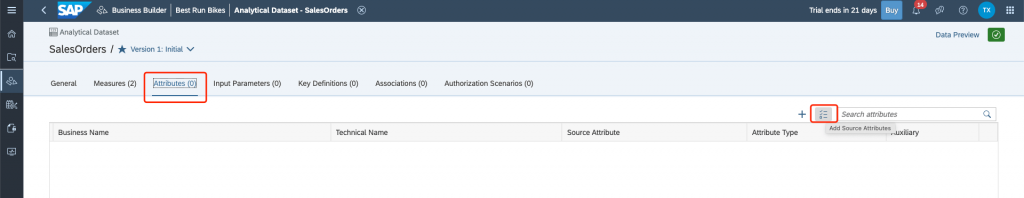
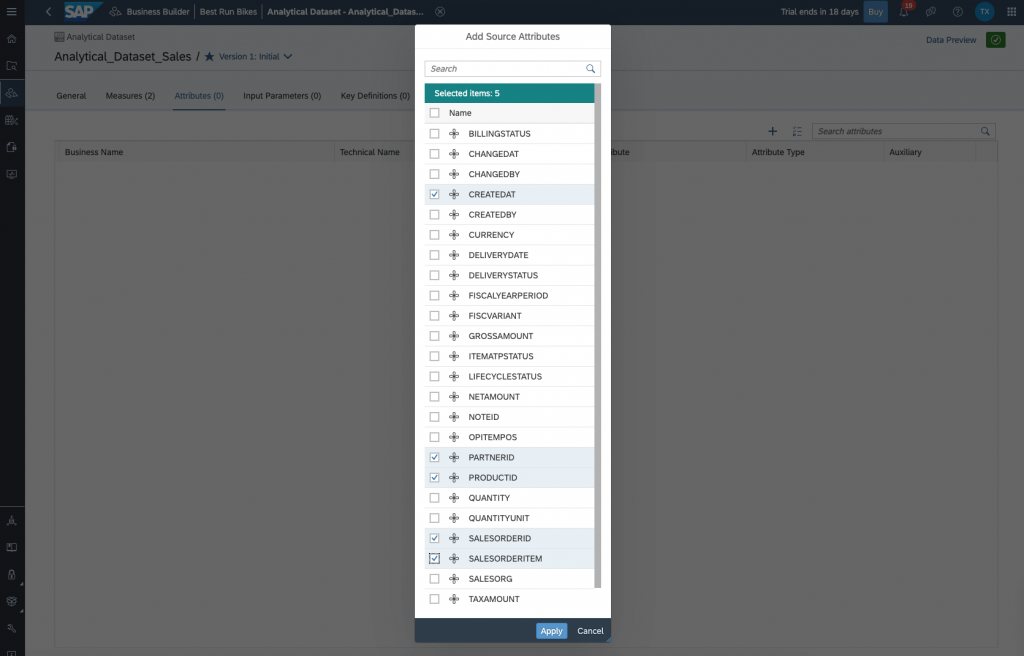
A pop-up will open to show you the attributes available in the source data. Check all the attributes you wish to include. Then click on Apply.
Add an association with a Business Entity:
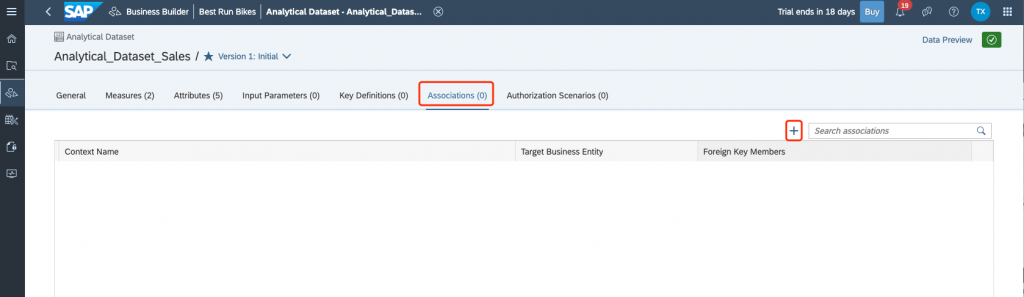
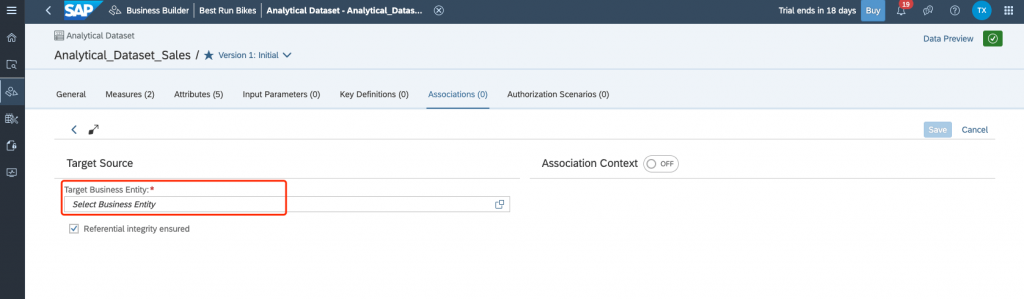
Add the Dimension that we created before as the association:
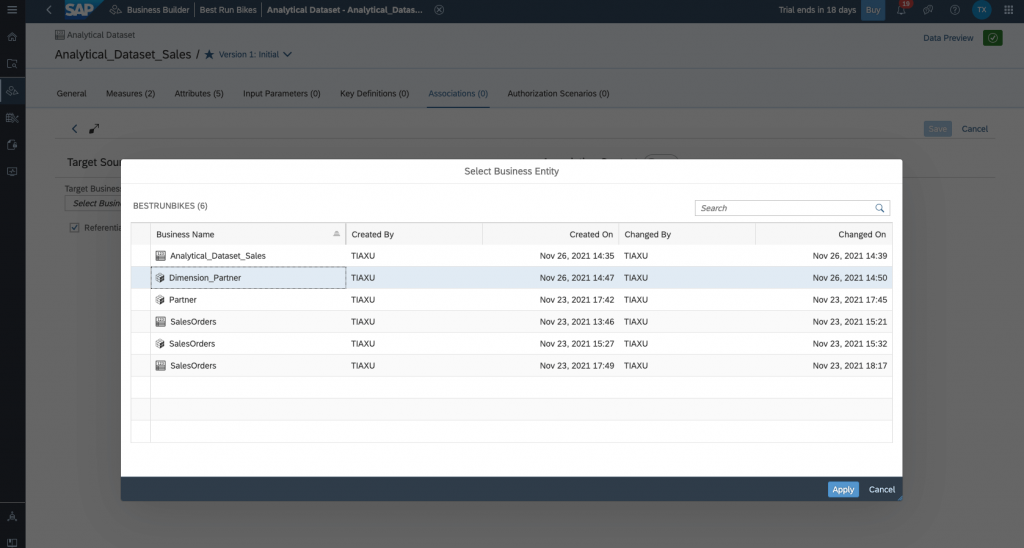
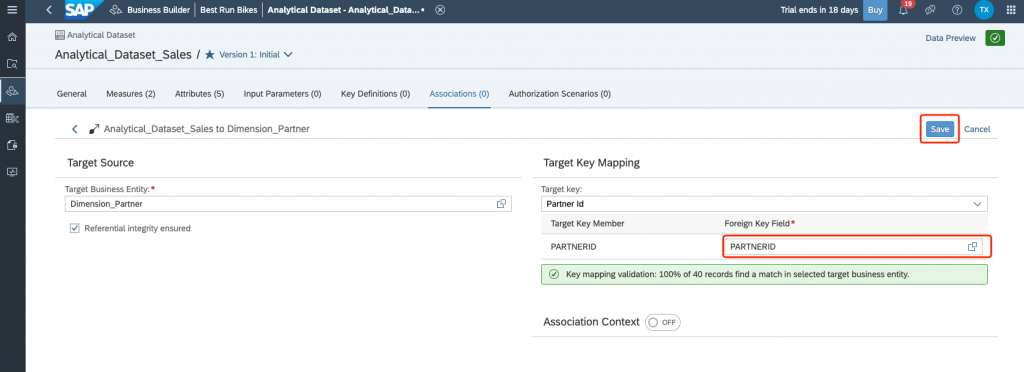
Select the target key mapping and Save it.
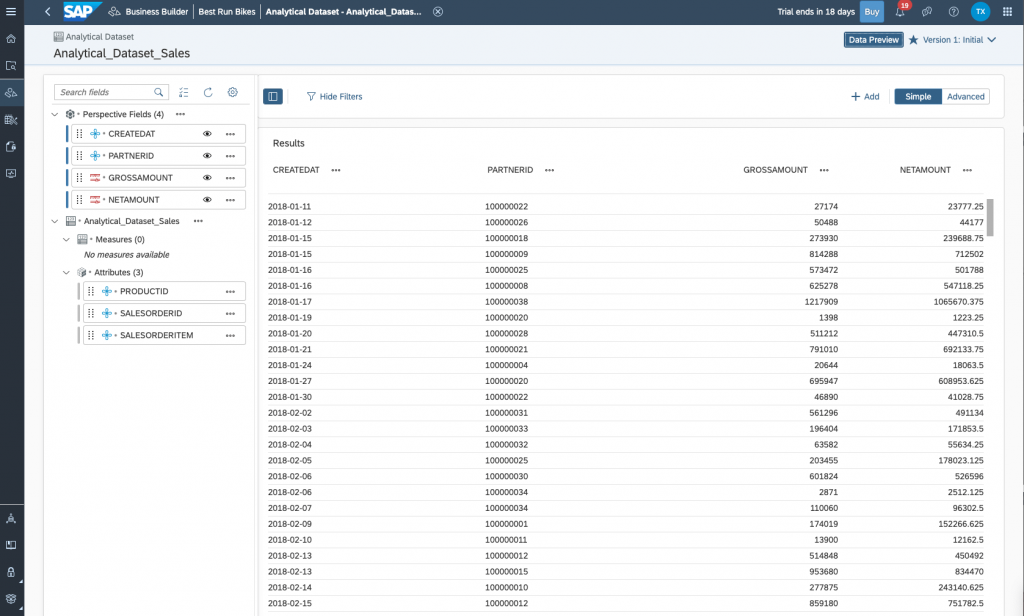
You are almost done creating a base analytical dataset. Before you move on to another task, it’s important to preview your data and make sure you have the right dataset.Just click on the Data Preview link on the top right-hand corner of the screen.
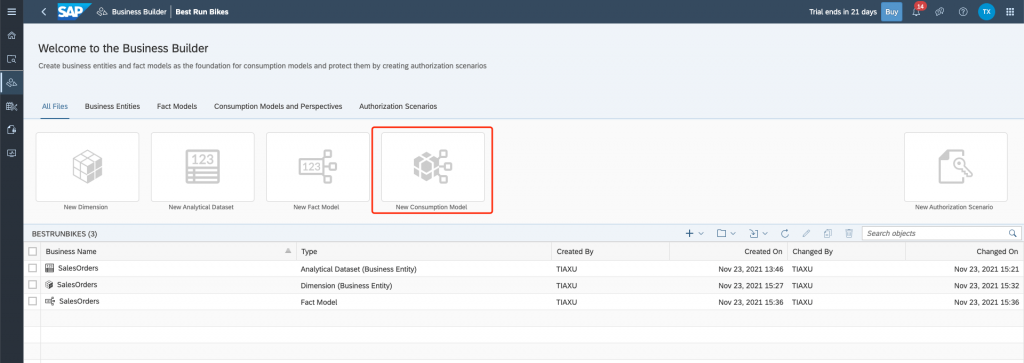
Step 6: Create a Consumption Model with Business Builder
If we’re using the Business Builder, we will need to create a Consumption Model and Perspective to be consumed in SAC.
Consumption models in the Business Builder of SAP Data Warehouse Cloud are the final business model you need to create before sharing your data with a visualization tool, such as SAP Analytics Cloud or equivalent.
Click on the New Consumption Model button.
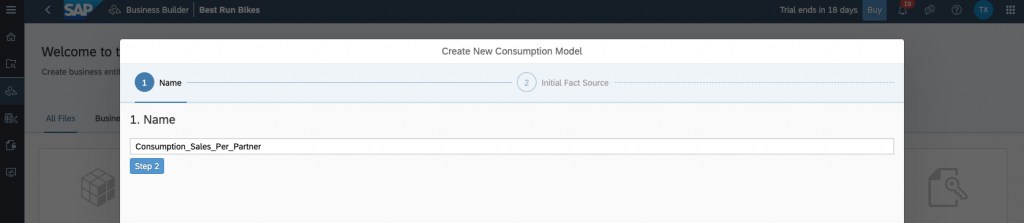
Enter a name for your consumption model.
Click on Step 2.
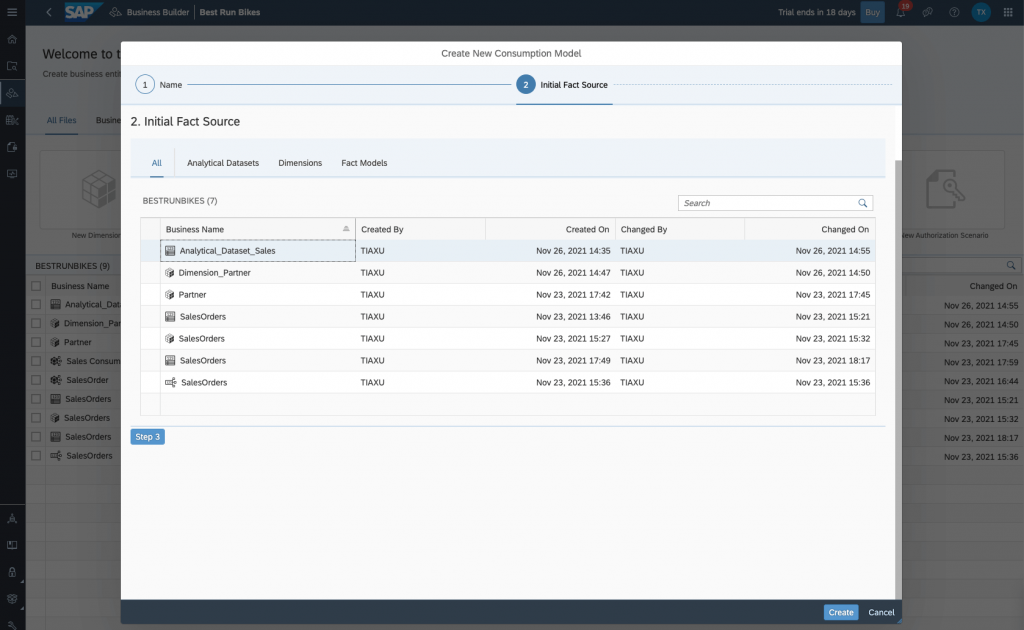
Select the Initial Fact Source. This can be an analytical dataset, a dimension, or a fact model.
Click on Step 3.
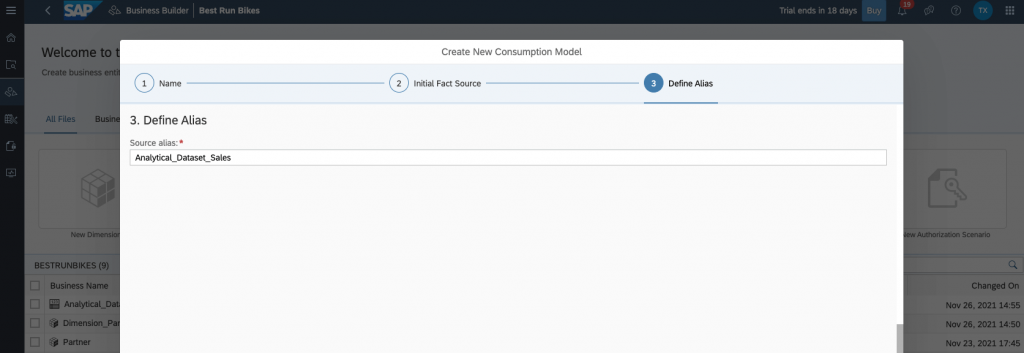
Define an alias name for the source in Source alias.
Click on Create.
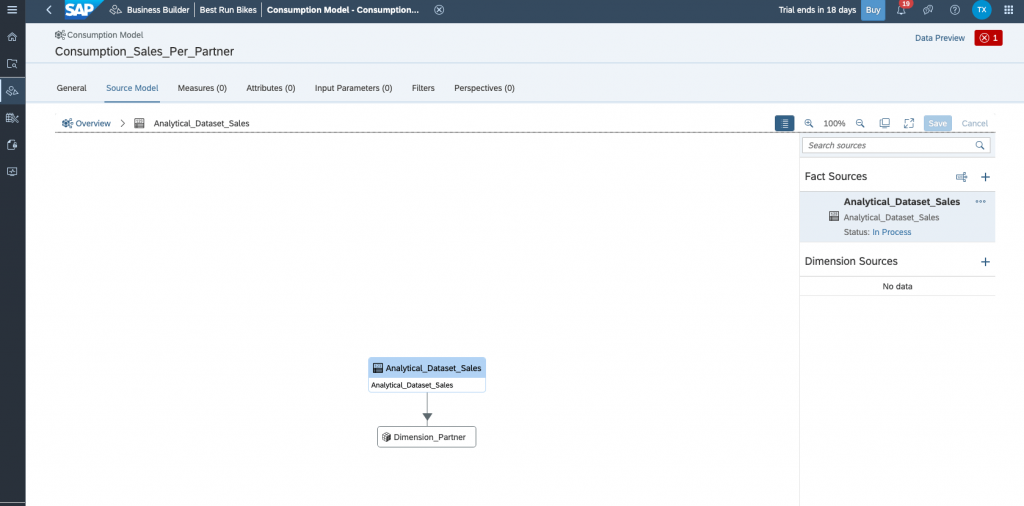
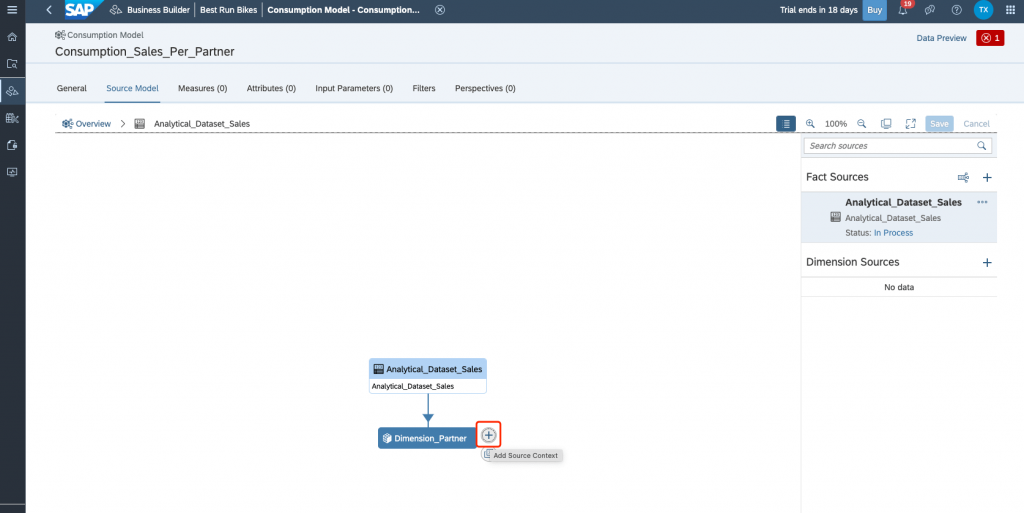
Add Source Context:
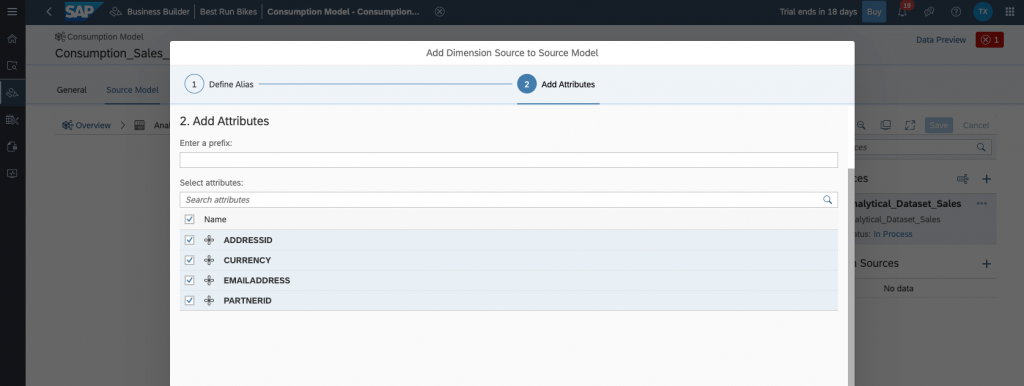
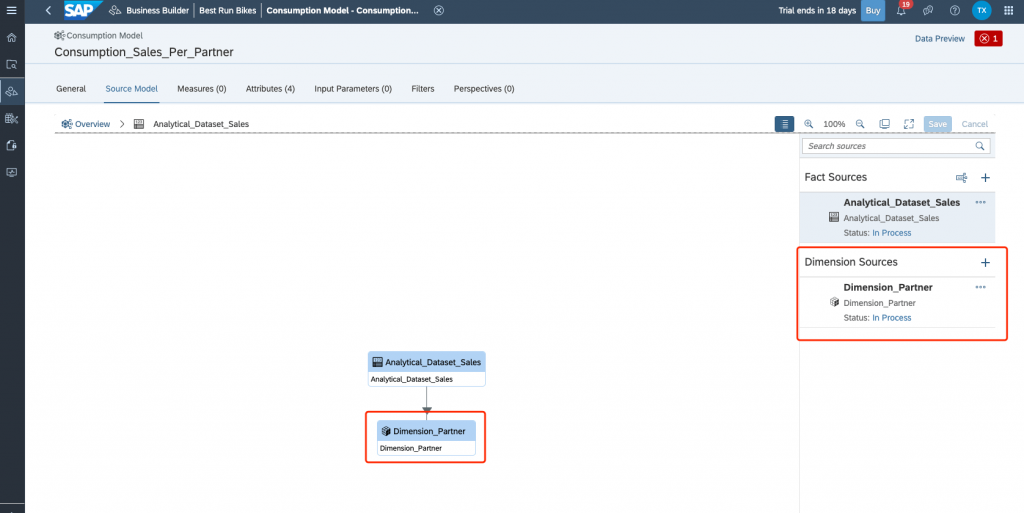
Add Measures and Attributes:
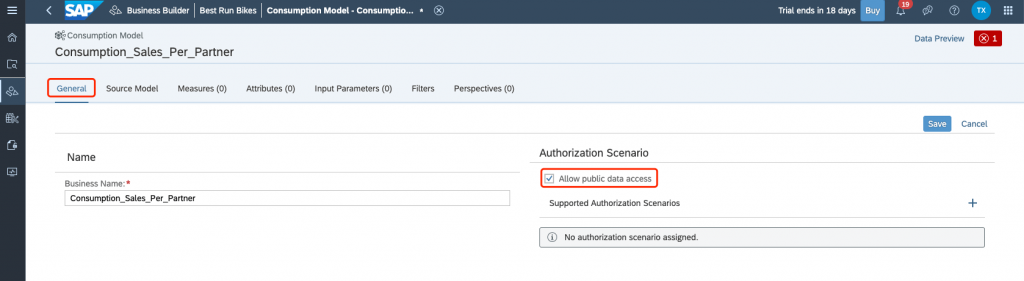
As mentioned before, you need to make your consumption model available to visualization and reporting tools, such as SAP Analytics Cloud, before these tools can actually have access to the output of this model. This is really simple to do, and you can grant public data access at any time, as well as revoke it again.
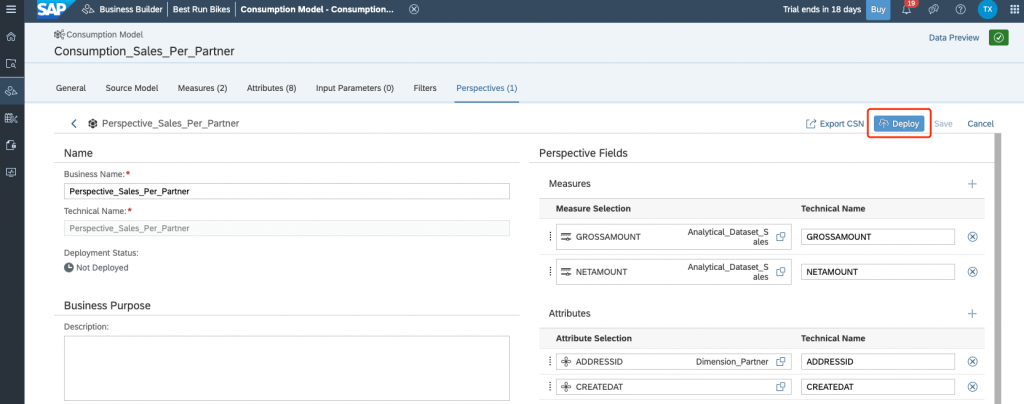
Add Perspectives:
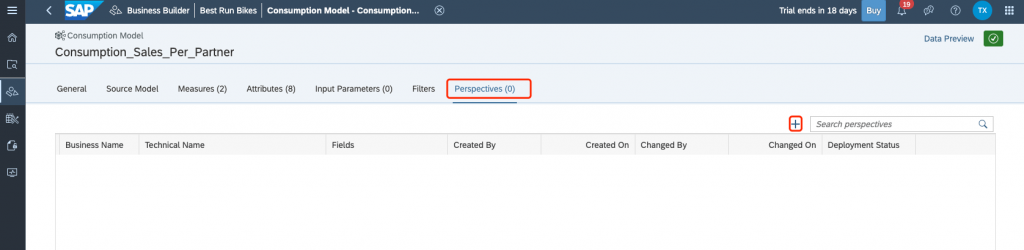
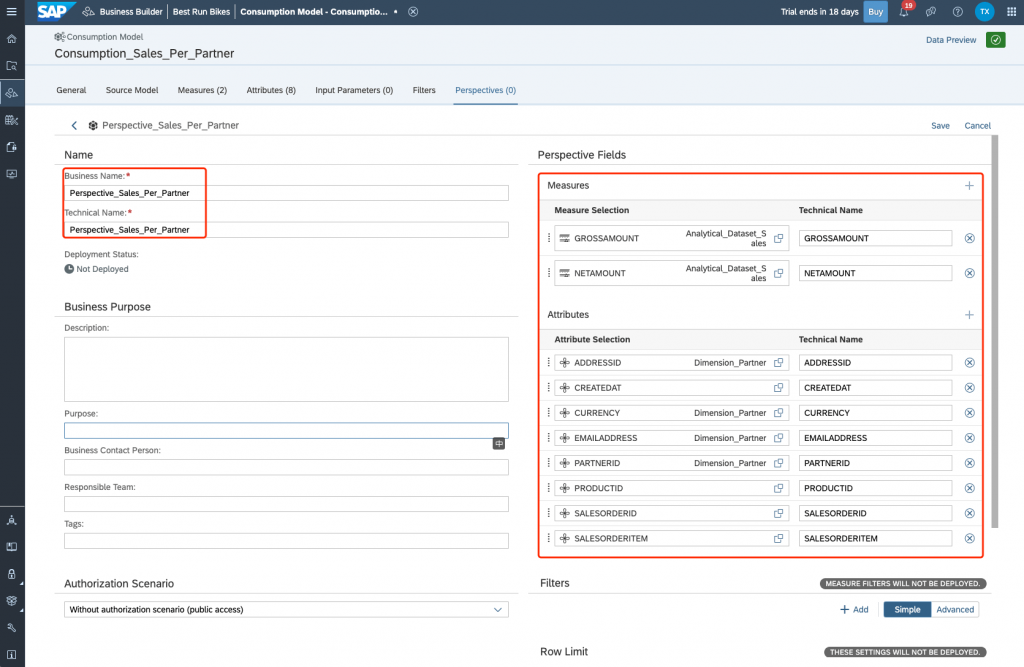
Save and deploy the perspectives:
Step 7: Expose from SAP Data Warehouse Cloud
In order to ensure the data entities and models created in your SAP Data Warehouse Cloud tenant are consumable by SAP Analytics Cloud, it is important to expose them for consumption.
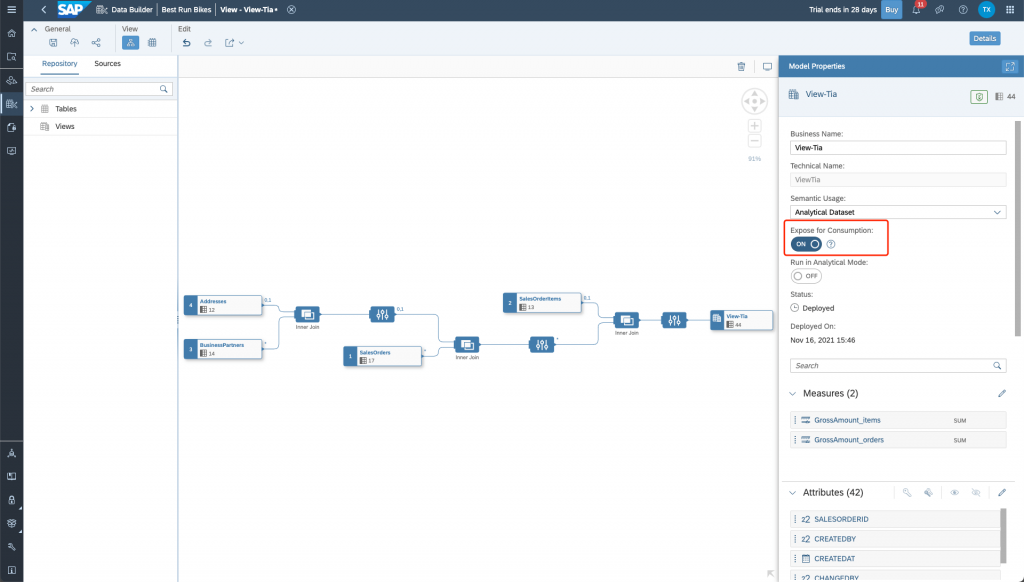
- If the entity was created in the data builder, simply click on the entity and set the Expose for Consumption toggle to ON as below.
- Expose for Consumption: ON
- If we’re using the Business Builder, we will need to create a Consumption Model and Perspective to be consumed in SAC.
- Allow public data access: checked
- Consumption Model
- Perspective
If the entity was created in the business builder, the toggle shows up as a Allow public data access checkbox in it’s properties tab. Simple click on the data entity to open it, and ensure the checkbox is ticked.

Step 8: Consume in SAP Analytics Cloud
To link the SAP Analytics Cloud to the SAP Data Warehouse Cloud tenant, navigate to Configuration on the bottom left, and select Tenant Links.
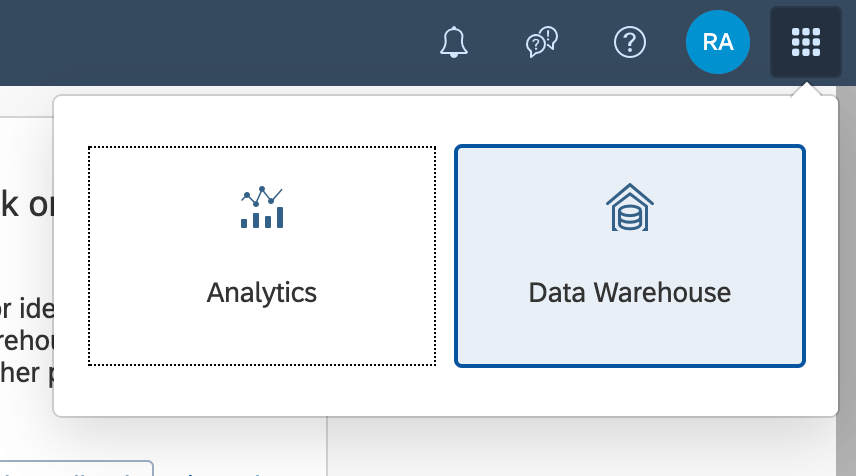
When you link your tenants, you’ll enable the product switch in the top right of the shell bar, and be able to easily navigate between them.
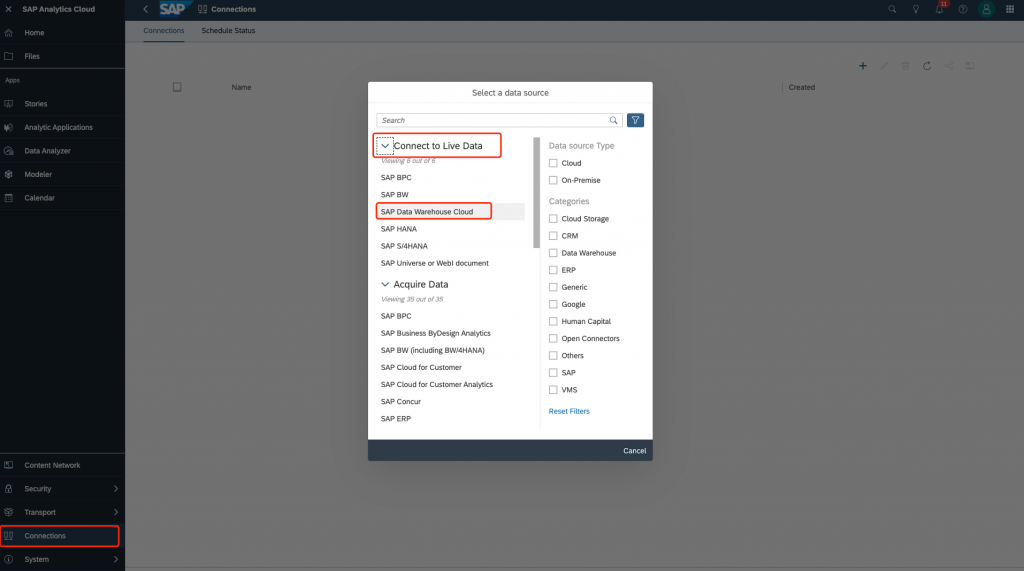
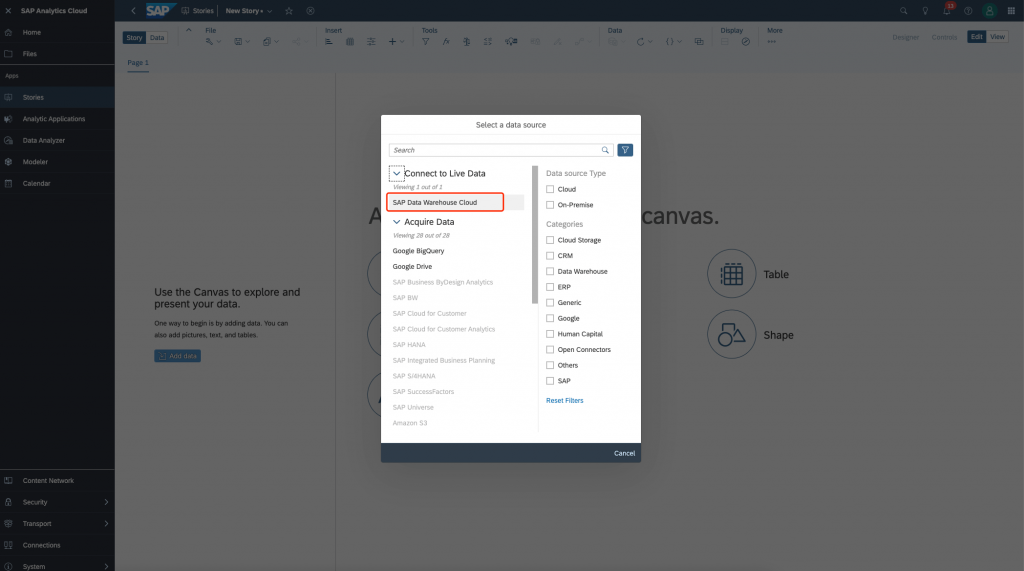
Go to SAP Analytics Cloud trial, click on connections then click on the + icon to create a live data connection setting. Select connect to Live data then choose SAP Data Warehouse Cloud.
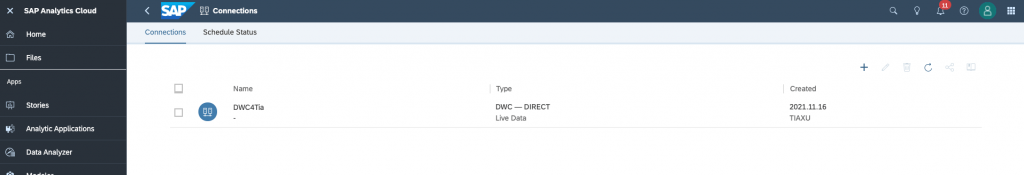
Provide a name and hostname
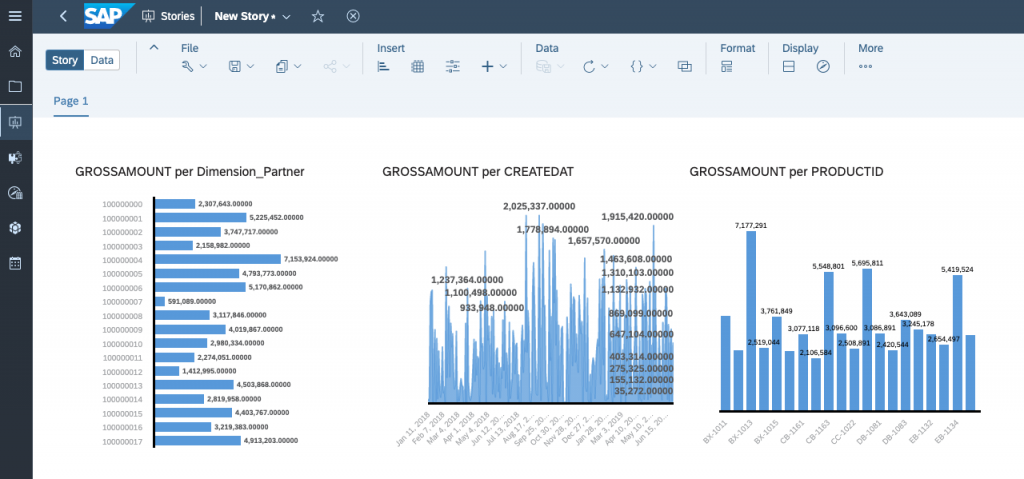
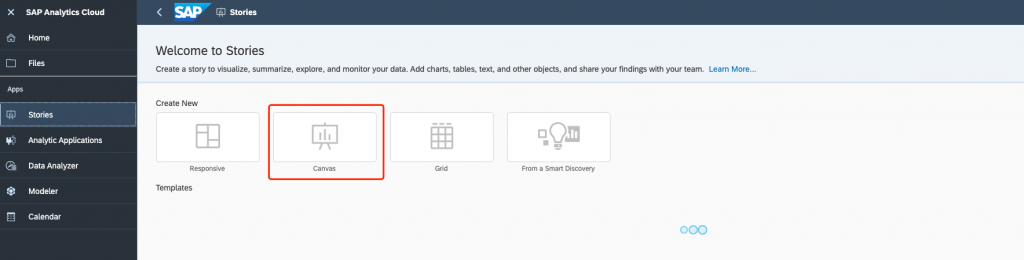
From the home screen of SAC, select stories and click canvas type of stories under create new.
Click on Add data button to add data source with your DWC:
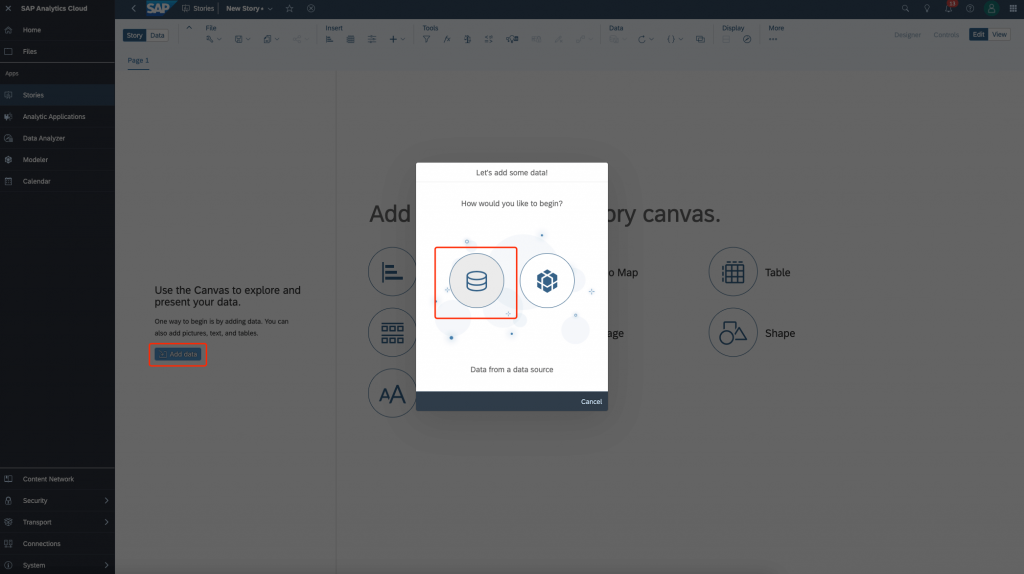
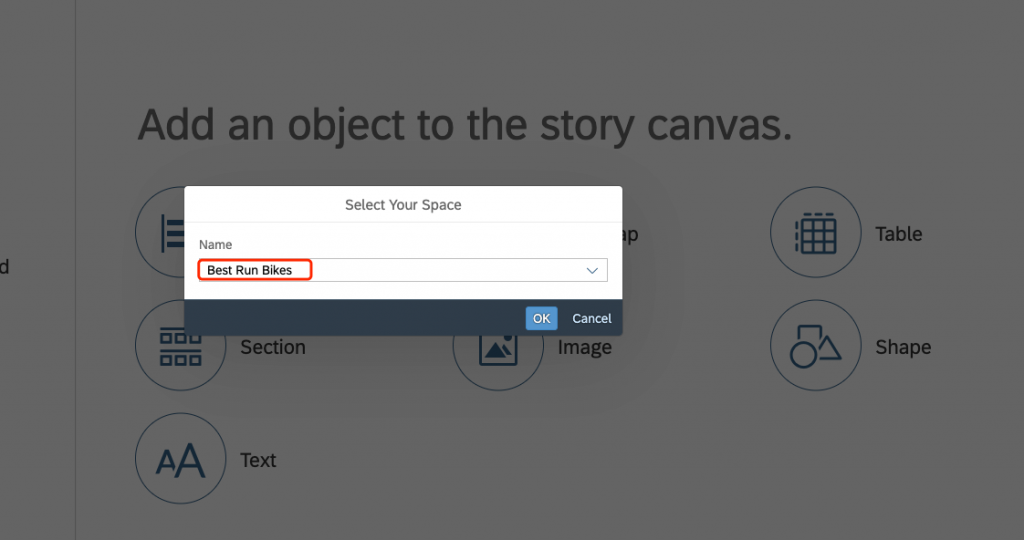
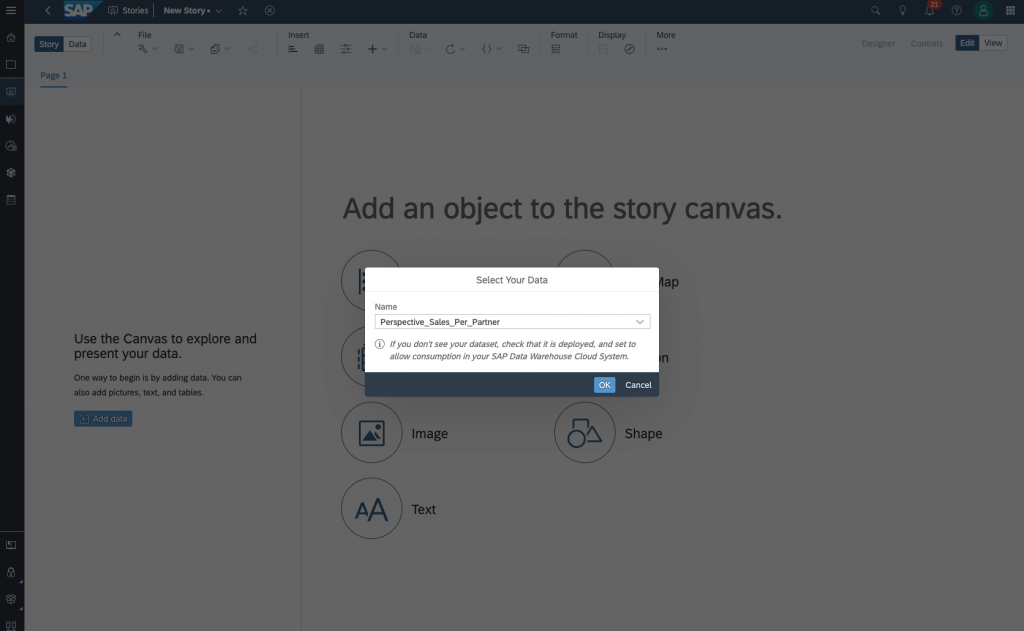
Again, click on Add data button to add data from existing data model of your DWC:
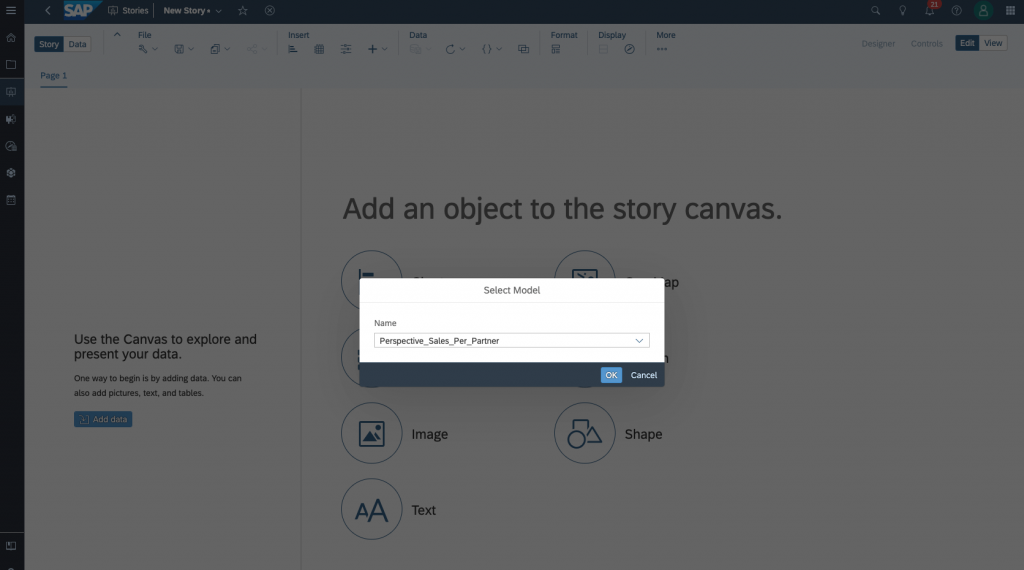
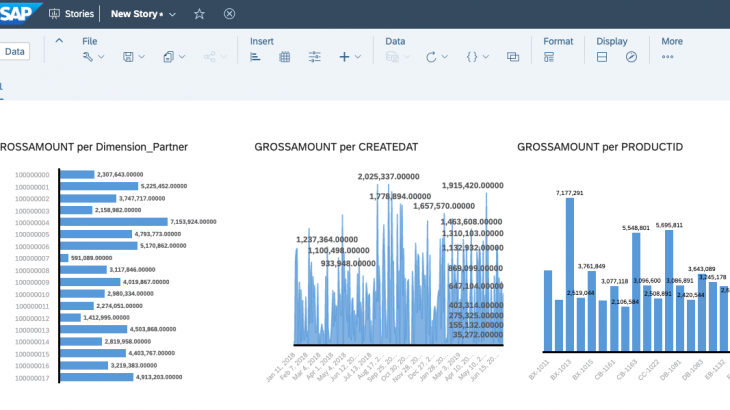
This will bring you to the data analysis section where you can analyze the data from the model.
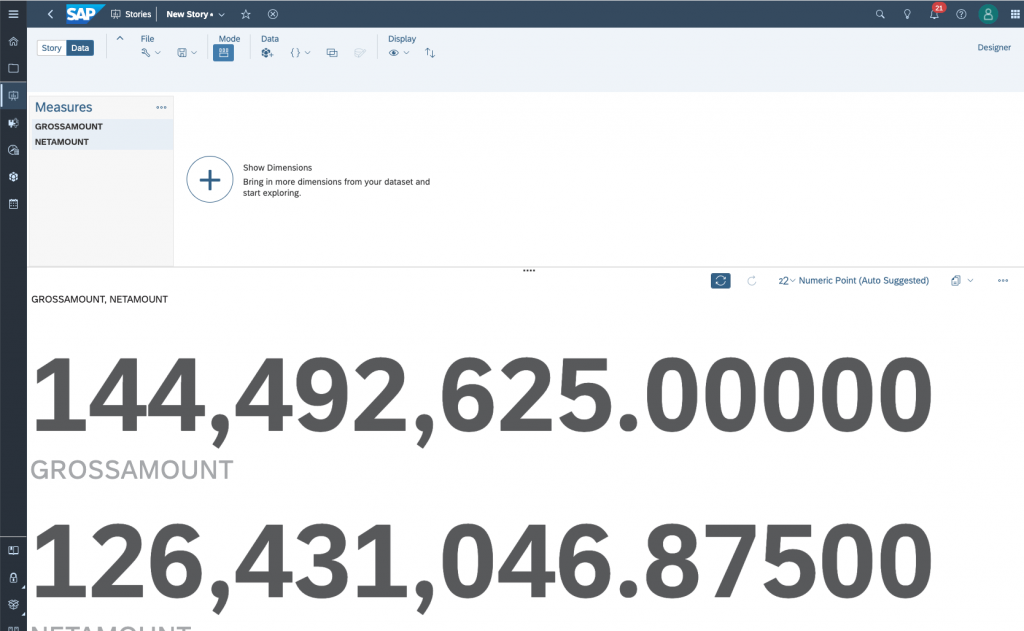
Switch to the Story Tab:
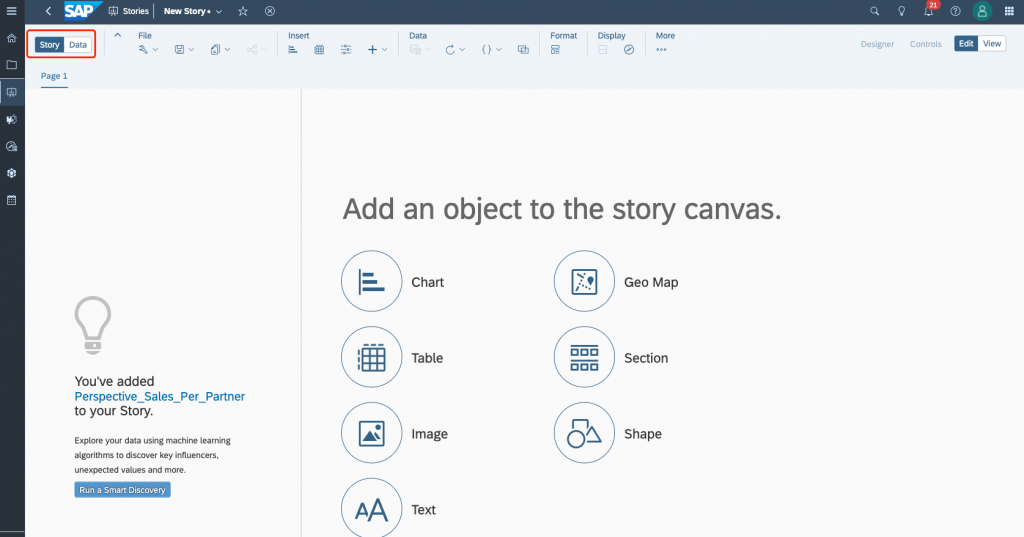
Draw your chart as per your business requirement.