Introduction:
In this blog I will be reviewing how to control multiple related dimensions with a single input control selection. I will begin by explaining general use cases and context, provide step by step instructions for implementing this strategy for two or more measures, then discuss performance and maintenance considerations. This method can be achieved in all current versions of SAP Analytics Cloud, including for HANA and BW live models.
Overview and Context:
Dimension and measure input controls represent some of the most important feature sets of SAP Analytics cloud for facilitating flexible self service business intelligence. For example, many dashboards can benefit from the ability to change the analysis dimension between things such as counts and percentages or between different types of product hierarchies.
However, for all the utility and ease of use of measure input controls one thing they do not allow is to easily control multiple related dimensions. What I mean by multiple related dimensions is best illustrated with the following example:
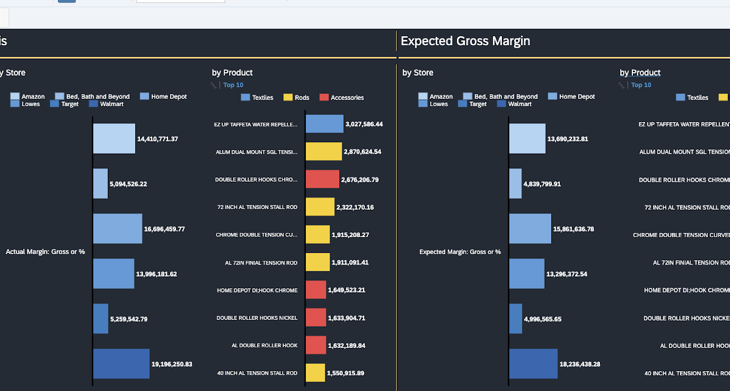
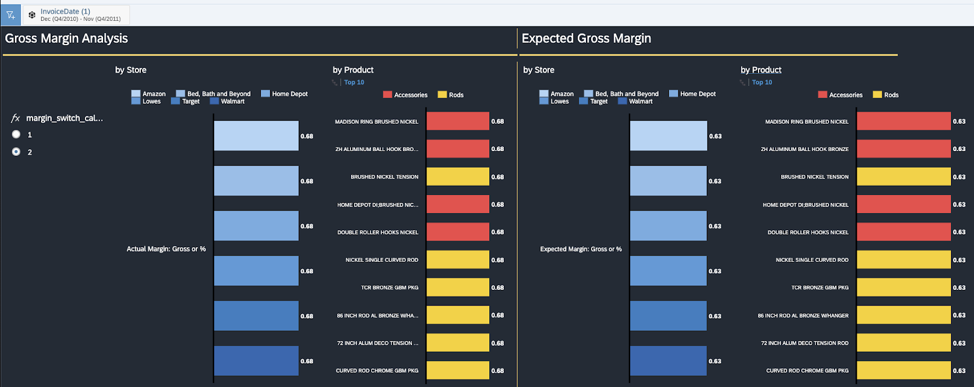
Suppose I am constructing a Margin Analysis dashboard page, where I can easily compare our Margins for the past year in various stores and for different product types. I want to be able to compare our actual margins to our expected margins that were generated with the help of SAP Analytics Cloud Predictive Scenarios. I have constructed a page that accomplishes this as seen below:
With this setup I can easily compare and contrast our actuals and predictions, especially with the help of SAC’s dynamic difference functionality. However, as a good Margin analyst I care not only about Gross Margin but also Margin Percentage, particularly when looking for items that we may sell at a low volume currently but have growth potential.
With the flexibility of input controls, I can of course implement a Measure Input Control like the ones seen on the left of the screen to give me this flexibility. However, because our Gross Margin, Gross Margin %, Expected Margin, and Expected Margin % are four separate measures I will actually need two input controls to switch between Gross and %. This is obviously feasible, but from a User Experience perspective leaves much to be desired.
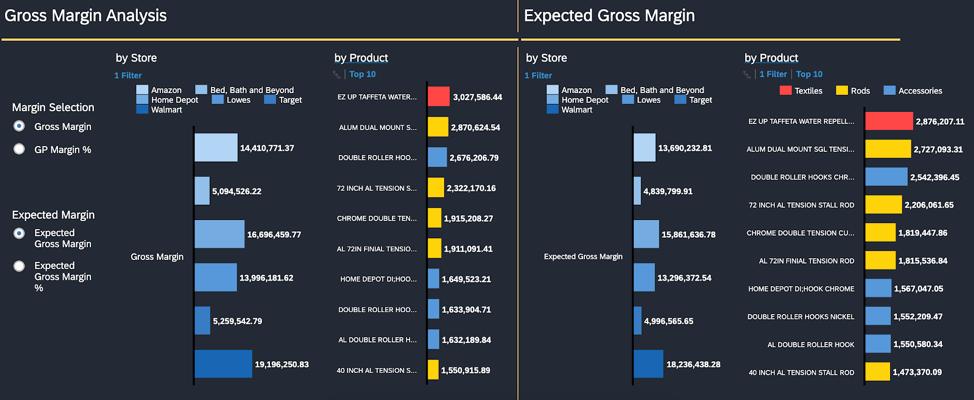
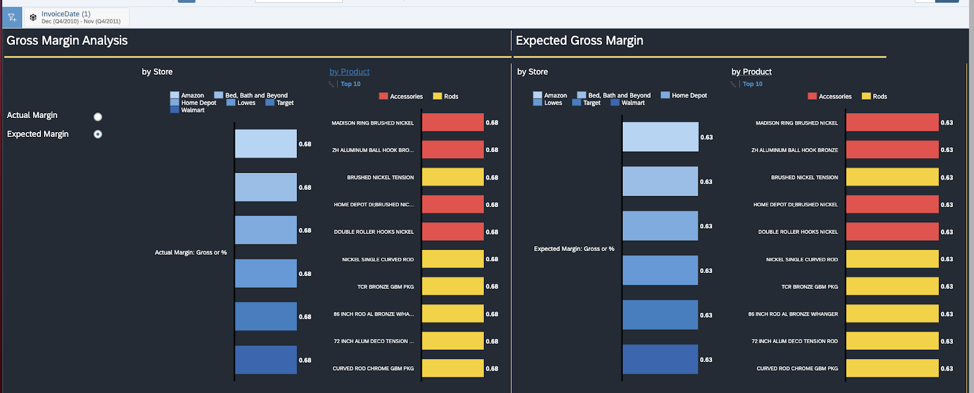
What I would like is to leverage a single Measure Input Control that switches between Gross and Percentage that can control my four measures with one click of the button. Thankfully, leveraging in story calculated measures and calculation input controls this can be achieved, with the final result displayed below:

How-To:
As mentioned before, we will be leveraging in story calculated measures and calculation input controls. I will be demonstrating how to build this control using an acquired data model, but I have implemented this feature on systems that utilize a HANA live model as well as BW live models.
Part 1: Calculation Input Control
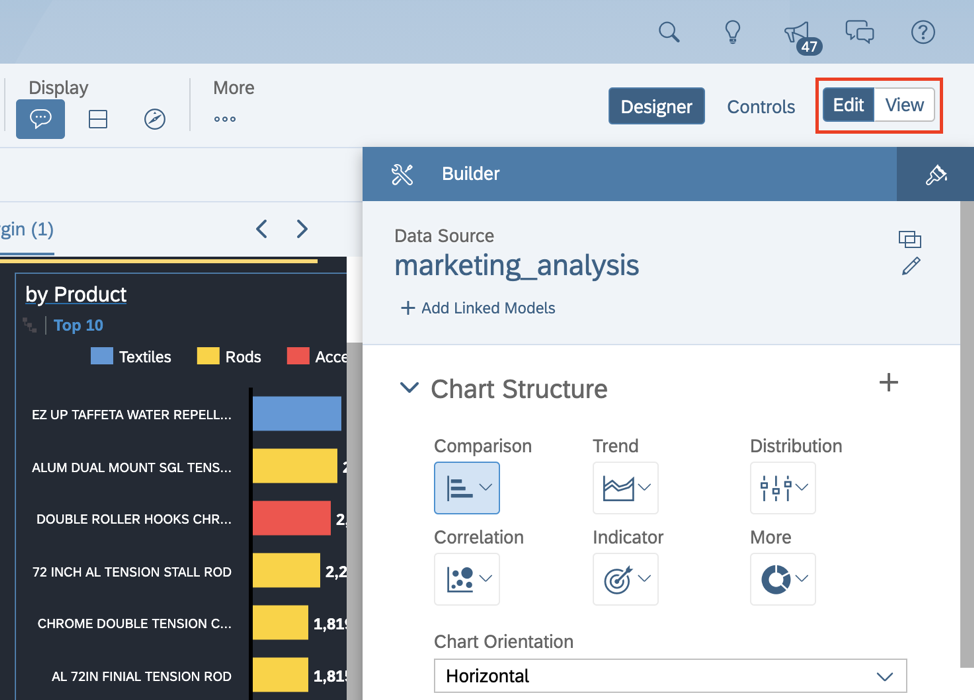
1. To start, open up your story in edit mode and select one of the widgets with the builder tool:
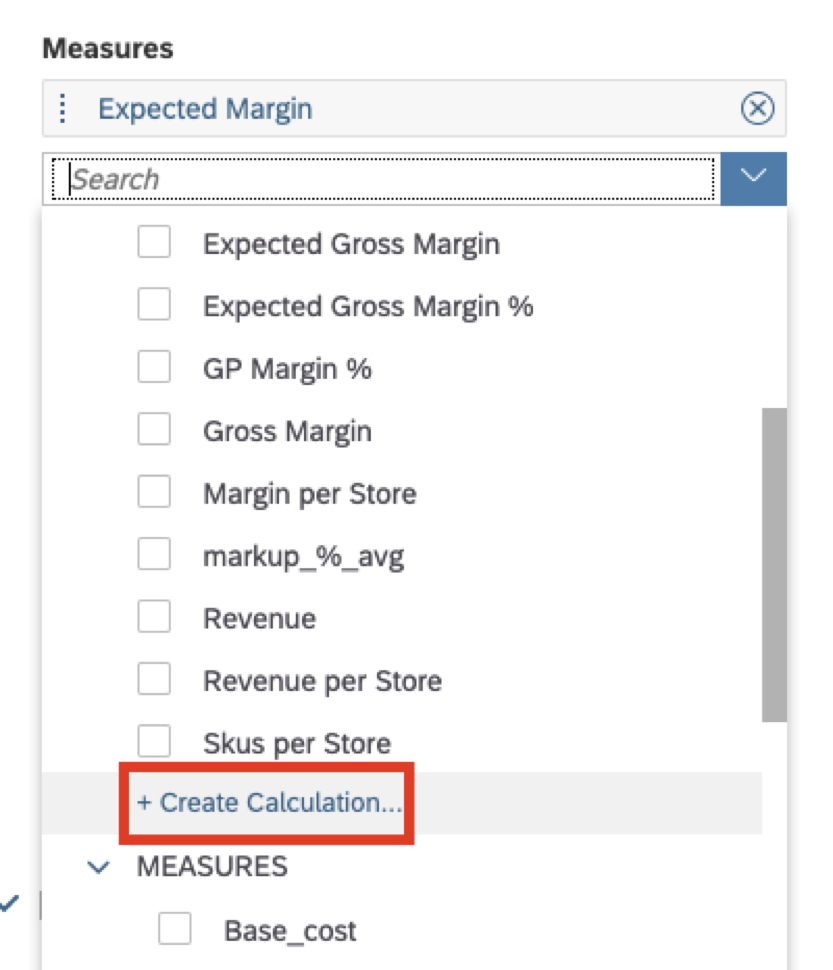
2. In the builder tool, click “Add Measure” then select “Create Calculation” at the bottom of the Calculation section of the window:
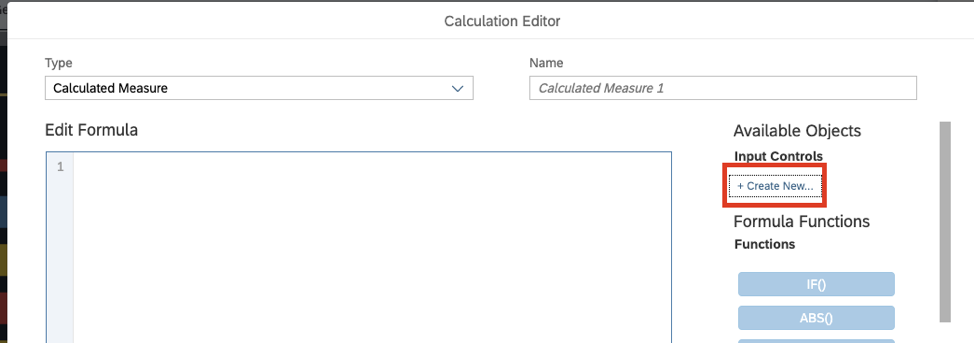
3. In the “Create Calculation” window, before creating the new measure and naming it click the “Create New” button underneath the “Input Controls” section of the Available Objects portion:
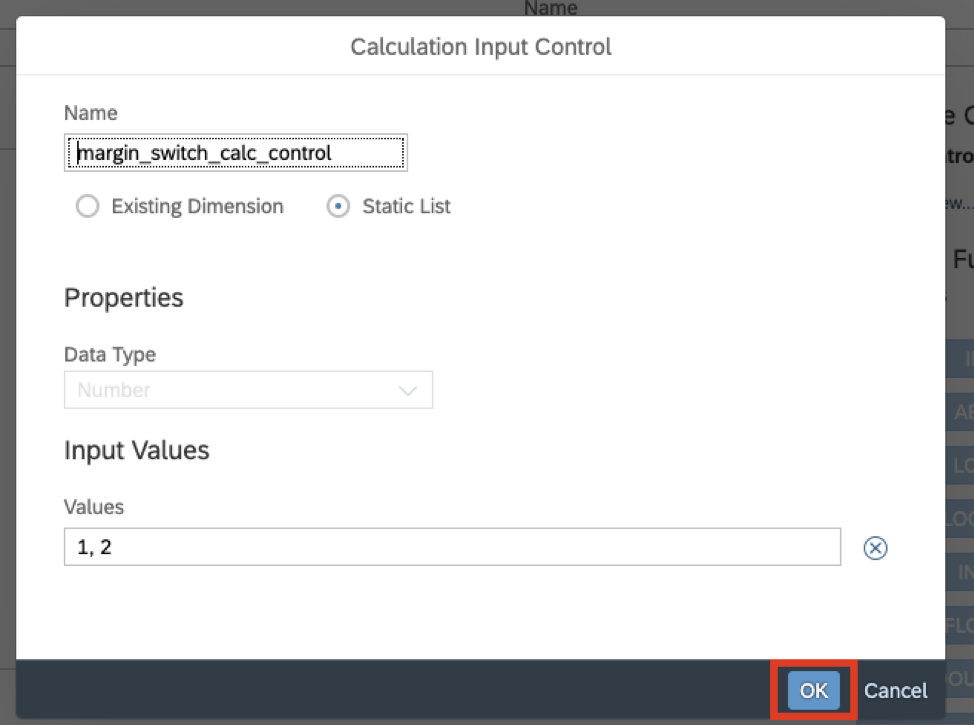
4. In the window that appears, insert a name for this calculation input control. Make sure to give it a name that is intelligible to anybody who wants to read your code. After naming, select the button that says “Static List”
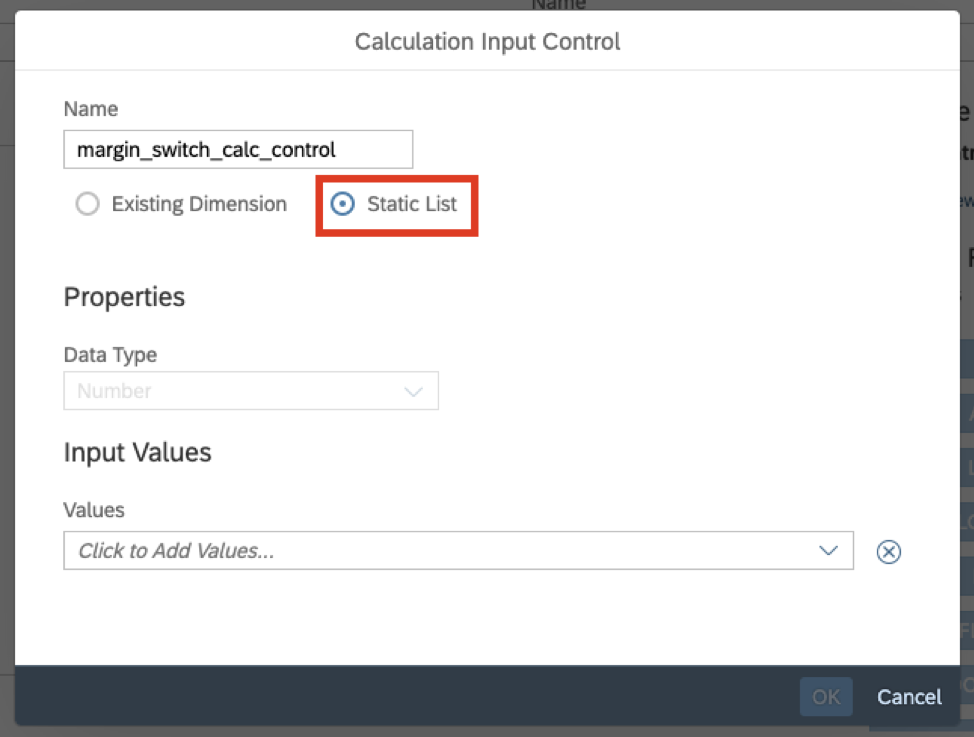
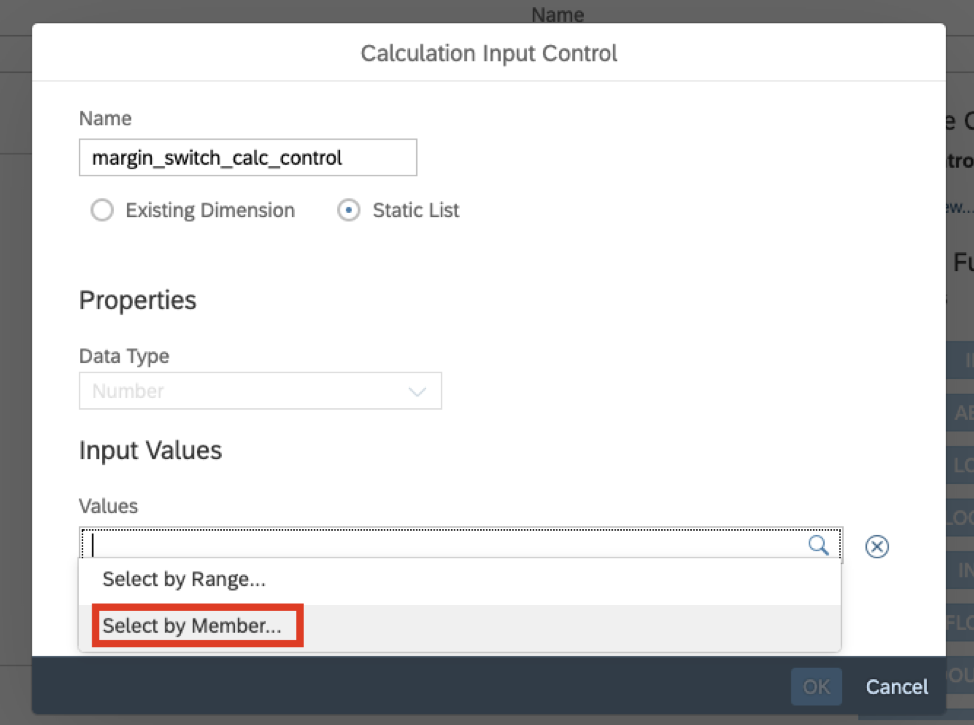
5. With “Static List” selected, the “Data Type” field will default to “Number.” Now, click the drop down that says “Values” under “Input Values.” From this drop down, select “Select by Member”:
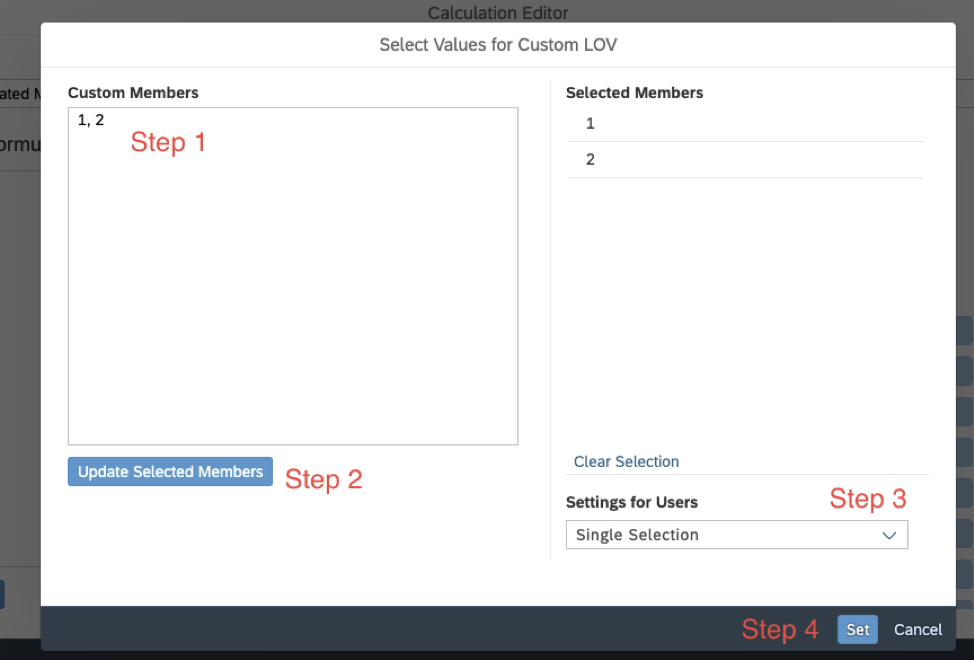
6. In the resultant formula window, we will type in the following: “ 1, 2” (Exclude the quotation marks when entering.)
7. This will provide us with two different selection options, in this case corresponding to our key options of “Gross Margin, and Gross Margin %”
8. After typing into the box, hit “Update Selected Members” and they should then appear under the selected members list on the right hand side of the box. Lastly, change the “Settings for Users” dropdown to the “Single Selection” option.
9. Hit “Set” and it will automatically save and exit.
10. Hit “Ok” after being returned to the Calculation Input Control window:
Part 2: Calculated Measures
1. Now, we are returned to the original “Calculation Editor” window. From the dropdown at the top right labeled “Type,” make sure “Calculated Measure” is selected.
2. To understand the next several steps, let me explain how many measures we will be creating. We have two categories of related measures we want to control, “Actual Margin” and “Expected Margin.” In these two categories, we want to switch between two different types: “Gross” and “Percentage.” In the previous steps, we created a calculation input control that allows selection of a “1” or a “2” and we clarified these are placeholder flags for the two measure types, “Gross” and “Percentage” respectively. Now, we will need to create two calculated measures that will correspond to our two categories, “Actual” and “Expected.”
3. We will start by creating the “Actual Margin” category calculated measure. From the Calculation Editor screen you should still be at from part 1, give this new Calculated Measure a name that is again so descriptive it should need no explanation:
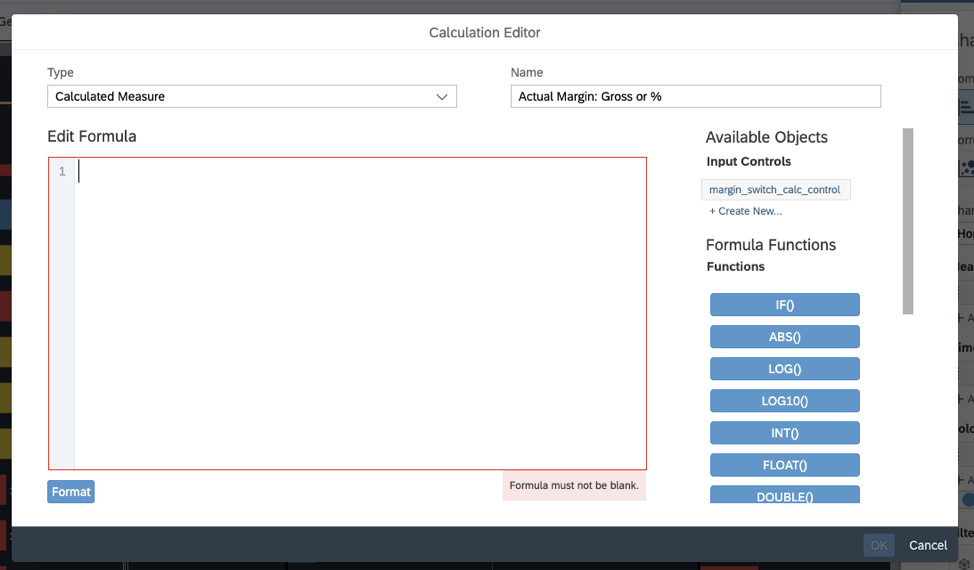
4. Now we will start filling in the Formula. Begin with the “IF” function, which takes the form:
i. IF(“CONDITIONAL” , “VALUE IF TRUE”, “VALUE IF FALSE”)
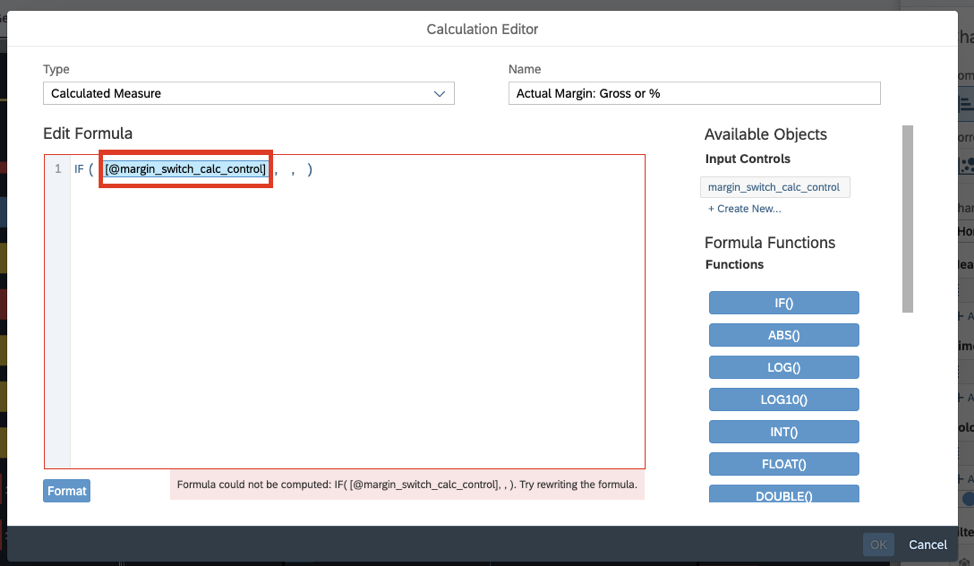
ii. Now type the name of “Input Control” created in Part 1 to the conditional section of the formula and select it from the autocomplete drop down that appears:
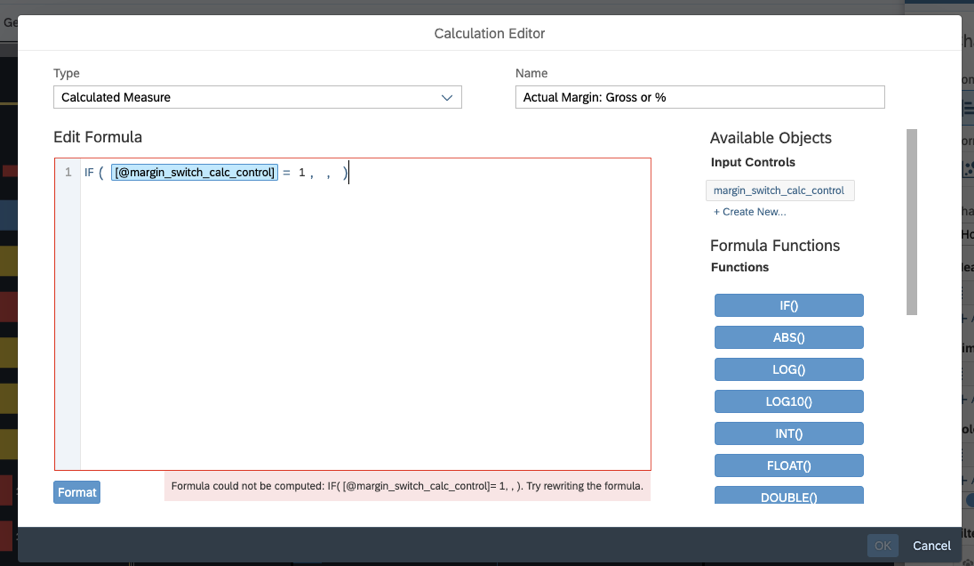
5. Complete this first conditional by typing “ [INPUT CONTROL NAME] = 1” immediately after the input control name and before the first comma:
6. Now, we move to the second section of the formula where we dictate what we want the value to be when the conditional created is true. In this case, we said a “1” will correspond to a type of “Gross,” and since the first measure we are creating is to satisfy the “Actual” category we will place our “Gross Margin” measure in this part of the formula:
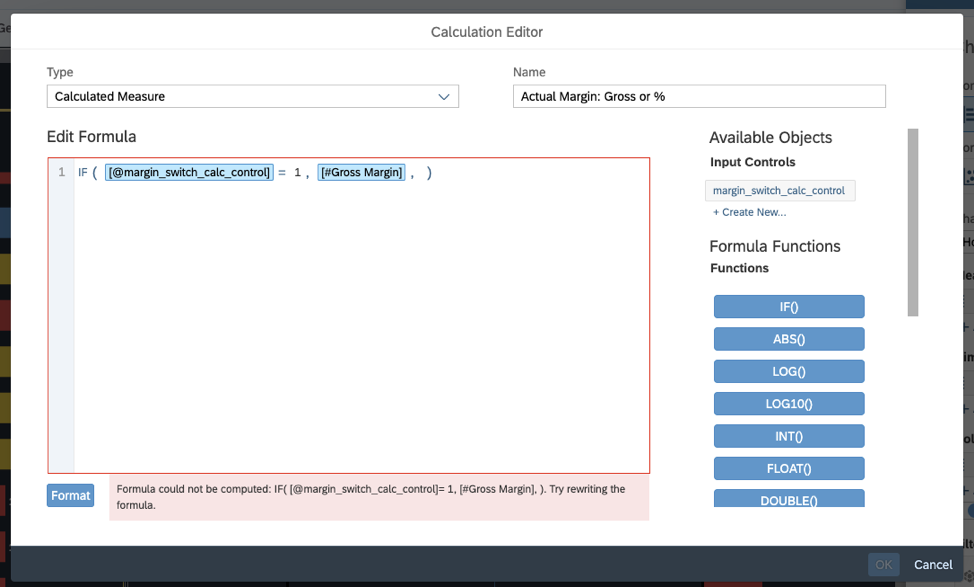
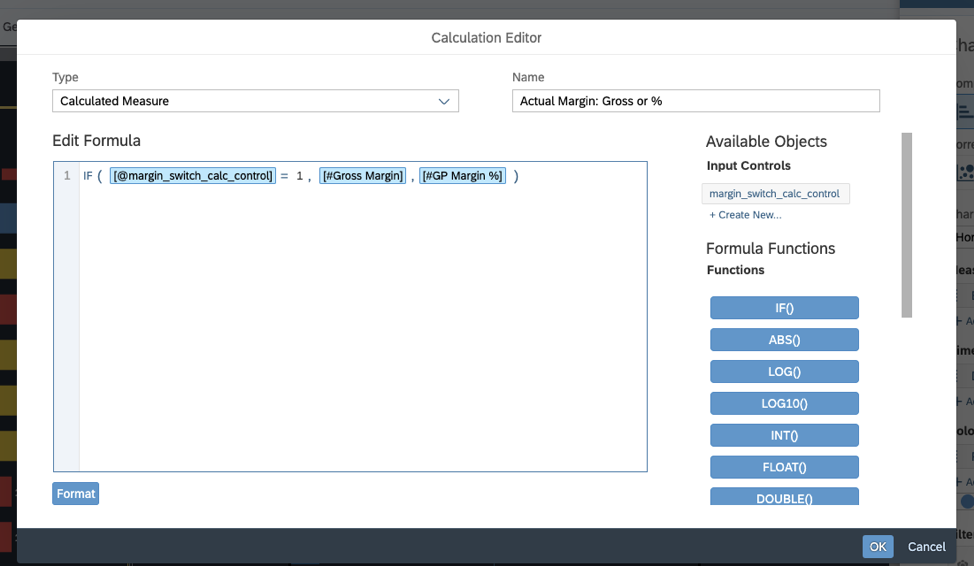
7. To finish the formula, we will place the name of the measure we want the calculated measure to be when the conditional is false, which in this case is “GP Margin %.” Hit OK to finalize the calculated measure:
8. Now, repeat steps 3-7 except instead of creating the “Actual” Measure category, we will be creating the “Expected” Measure category. IMPORTANT: make sure to use the same calculation input control created in steps 1-9 as was used in 9-13 for this new calculated measure.
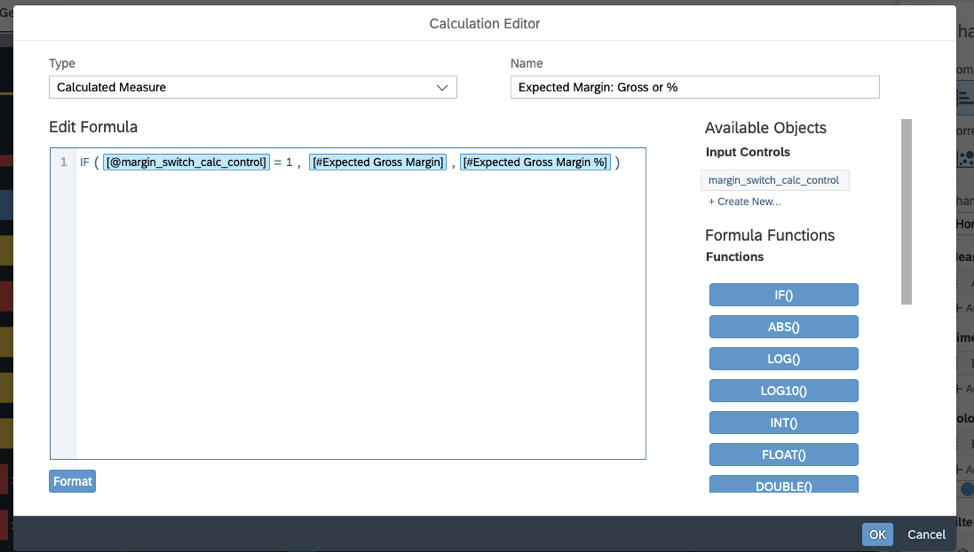
9. As you can see, the only difference between the result in step 14 and the one from step 13 is we are using the expected measures instead of the actual ones.
Part 3: Wrapping Up
1. Now, with our Calculation Input Control created we simply add our “Actual Margin: Gross or %” Calculated measure to the charts for our Actual analysis and our “Expected Margin: Gross or %” measure to our charts where we want to see expected margin:
i. 1 Selected – Gross Margin, for both Actual and Expected
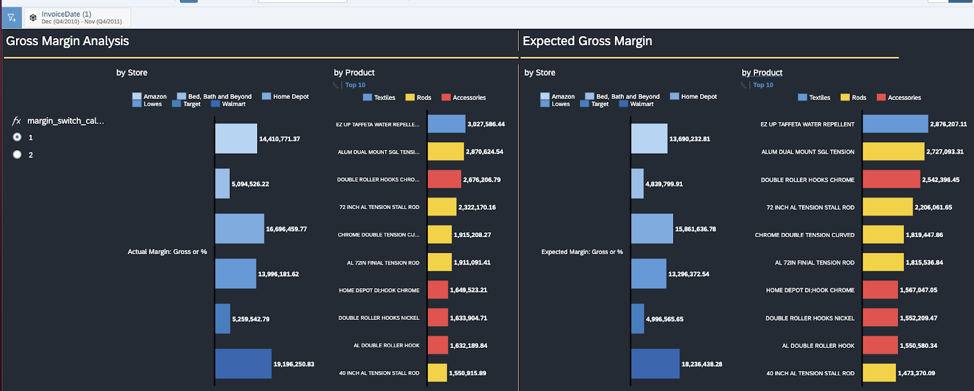
ii. 2 Selected – Gross Margin %, for both Actual and Expected
2. Now, part of the goal of this whole exercise was to increase user experience. Having a “1” and “2” that corresponds to something else is not very user friendly. Luckily, using the Text box and hiding the title and changing the color of the fonts on our selection allows us to create a selection box that is more appealing:
i. Much better!
Part 4: Advanced
1. One thing you may be asking is, “That’s great, but I need to select between more than two types of measure. How would I accomplish this if there are only two slots available on the IF condition in the formula?”
2. The great news is that you can nest the IF statements together.
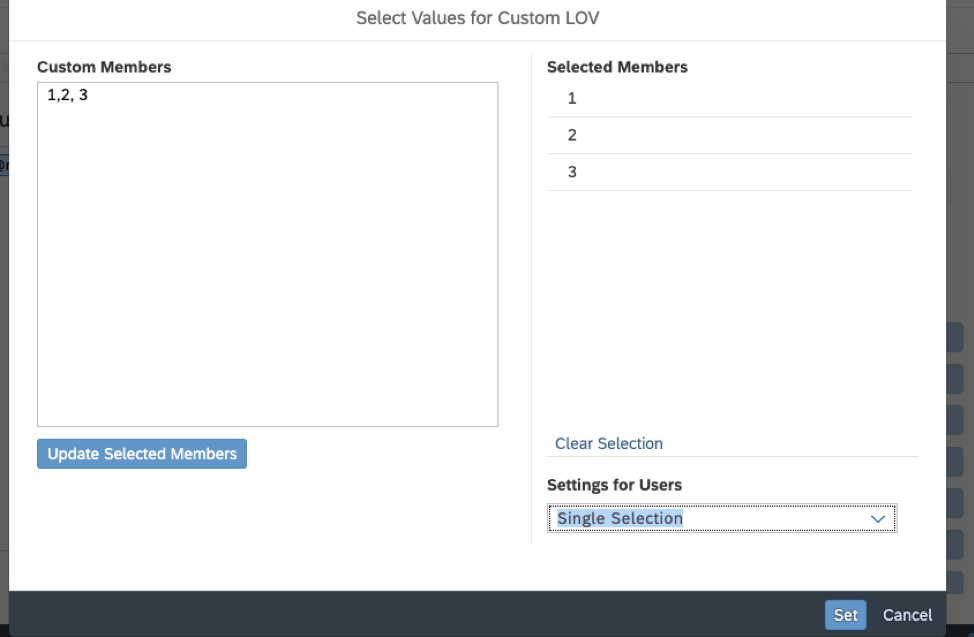
i. Suppose we need to add another type of measure to switch between, in this case maybe a specialized Gross Margin type that has certain specific exclusions. In this case we need to return to step 6 and create a calculation input control with a “1,2, 3” to our list of comma separated values to accommodate the new type plus the earlier two:
ii. Now, with the new calculation input control we return to our calculation editor and in the last part of our IF formula where we specified the value we wanted our calculation to be if the condition was false, we place another IF formula and fill it out with the same measure input control as before, but this time our positive condition is “ =2” and if that is met we place our second type. Finally, we fill in the type if neither of these conditions are met as our third type:
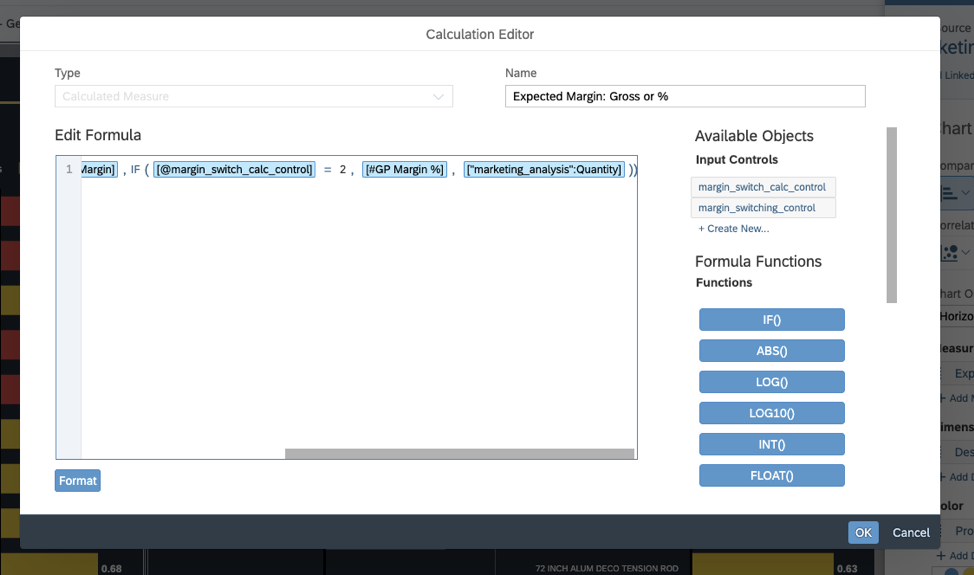
3. The ultimate result ends up as:
i. “IF([@margin_switch_calc_control]=1, [#Expected Gross Margin],IF([@margin_switch_calc_control] = 2, [#GP Margin %], [“marketing_analysis”:Quantity]))“
4. In this way, we can accommodate any N number of types through nested if statements and any N number of categories through creating additional calculated measures.
Considerations:
Of course, this is all well and good but what are the performance implications? I am happy to report that there is no discernible performance difference when using up to 4 types and 4 categories of measures to switch between when compared to a similar amount of calculated measures.
There is a linear decrease in story performance the more nested If statements leveraged, so we recommend to limit the types of measures you are switching between to around 3-4.
With this type of input control, one of our clients was able to reduce the amount of separate measure input controls on one page from 9 down to 2, dramatically improving the ensuing user experience.


