Overview
Analytics Designer is a capability that you can use to build Analytical Applications within SAP Analytics Cloud. In Analytics Designer you can use scripting, extensions, old data, and visual widgets to build Enterprise Dashboards, Planning Applications, and Predictive Applications.
Analytics Designer leverages all the platform services already built into SAP Analytics Cloud such as, Data Connectivity, Data Preparation, Scheduling and Lifecycle Management to name a few. Analytics Designer also integrates with Business Intelligence, Augmented Analytics, and Enterprise Planning.
I am thrilled to present you in this blog a detailed view of our new sample in Analytics Designer: the configurable Ready-to-Run Application for flexible ad hoc Analysis.
Generic Analysis approach: one application for analyzing all models
Traditional applications are created for a specific model, supported by a narrowly scoped user interface, set of widgets, and logic and made available to predefined dimensions and members. But with the new configurable Ready-to-Run Application for flexible ad hoc Analysis, our customer can deliver a model that can be executed anywhere and customized on demand. Such application includes table-centric, slice-and-dice analysis and allow users to select a new dimension, key figure, or filter at run time.
Let’s get started by exploring the different features and functionalities available in the new sample application.
Initial execution interface
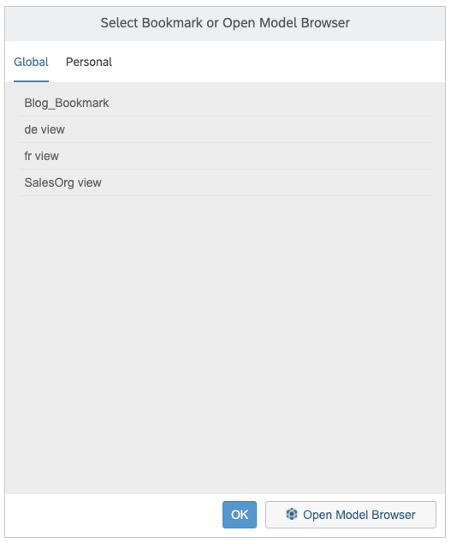
By executing the Generic Analysis, a pop-up will be shown, and you will be asked to either: selecting a Bookmark (Global or Personal) already created or a Model.
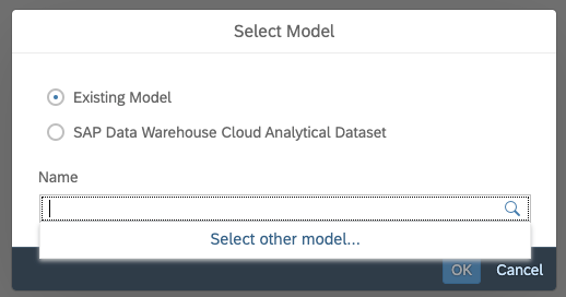
In order to start your Generic Analysis application with a new model, you need just to click the button Open Model Browser. As next, you can choose between an Existing Model or an SAP Data Warehouse Cloud Analytical Dataset.
Designer Panel: Data browser to select the model as the data source
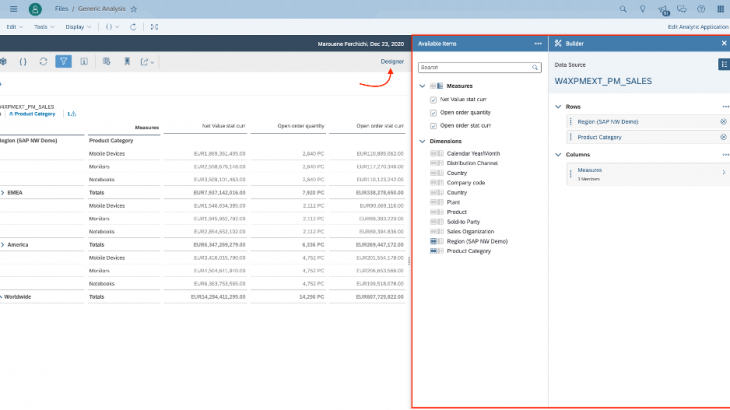
In order to customize your Model and build your view in real time, you have to redirect to the main feature of this Ready-to-Run application: Designer Panel.
By opening the Designer Panel, you can explore your model in real time. You are able to see all Dimensions and Measures (Accounts) available on your Model already chosen.
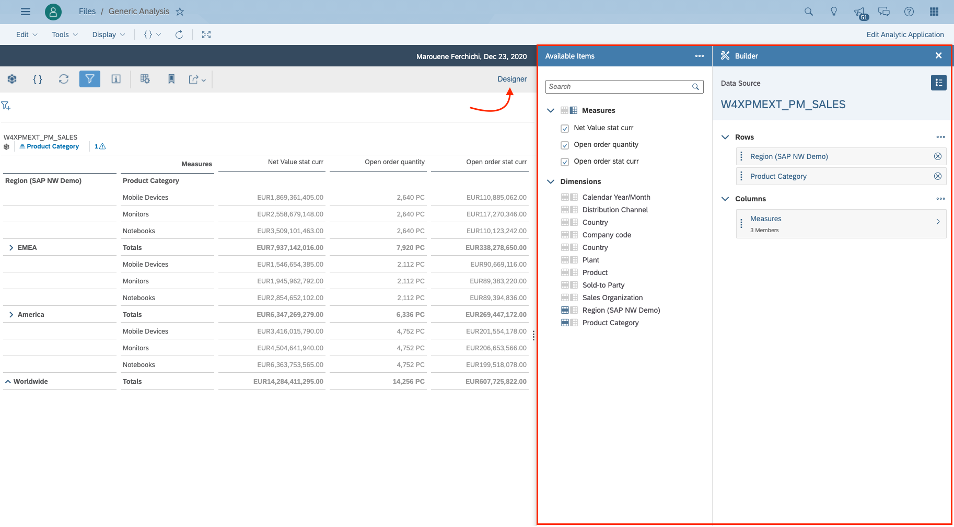
As shown in the screenshot above the Designer Panel is shared in 2 main parts, Available Items and Builder.
- Available Items:
To add Measure(s) or Account(s) to your view you just need to select one or more Measure(s) from the available items shown in the panel, you can also delete by deselecting the Measure(s).
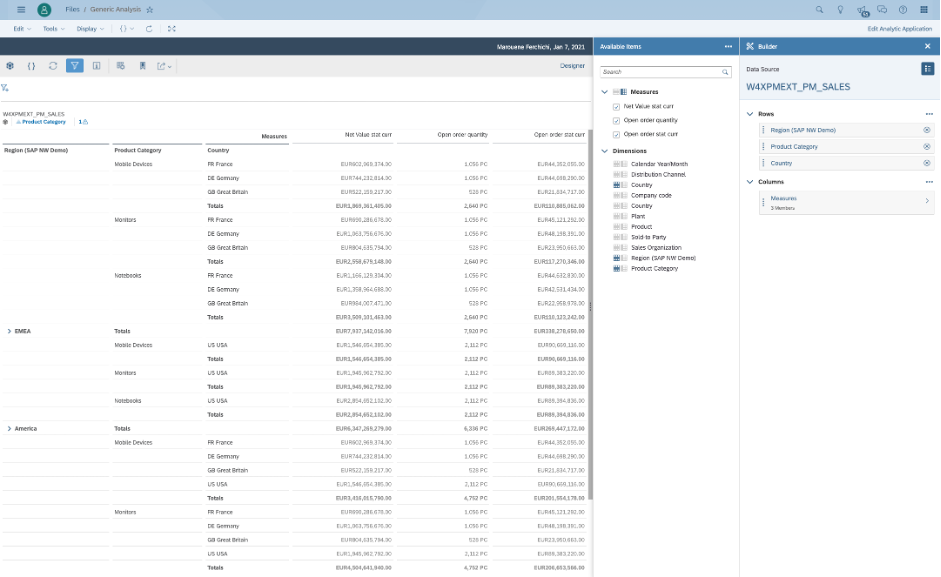
You can also add one or more Dimension(s) by select in it. You can choose as well if you want to present the Dimension(s) as a row or as a column.
- Builder:
From the Builder Panel you can see to which Model your application is connected, you are also able to see the Table Rows and Columns already selected.
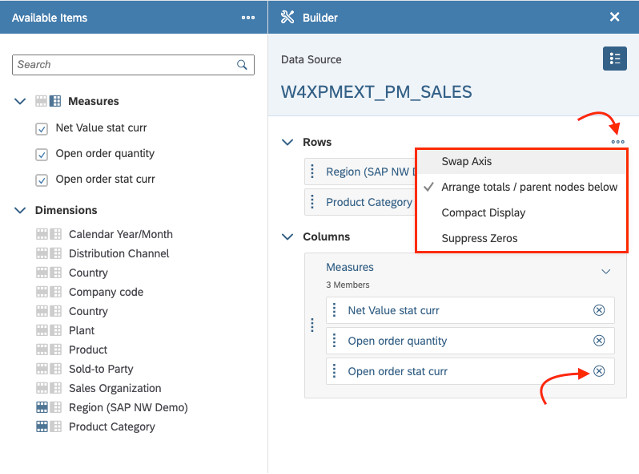
As shown in the screenshot above, you can change the Rows order by Drag and Drop or also deleting one or more Rows/columns by a simple click on the (x) icon.
From the same Panel you have the possibility to set more option for your table by clicking the (…) icon.
note: the compact display option and the Suppress Zeros are only available with BW live models.
Open Model Browser:
Let’s explore the toolbar by pressing as first the Open Model Browser icon. You will be able to select your Bookmarks (Global or Personal) already created within the application and which they can be based in different Models.
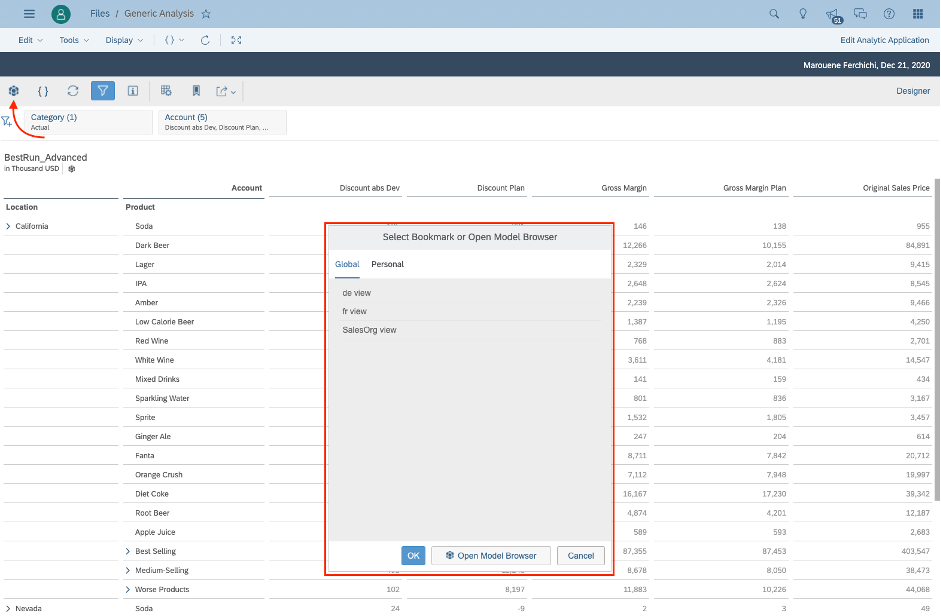
From the same Pop-up you can as well select a model (Existing Model or SAP Data Warehouse Cloud Analytical Dataset) by pressing the Open Model Browser button (check Figure 3).
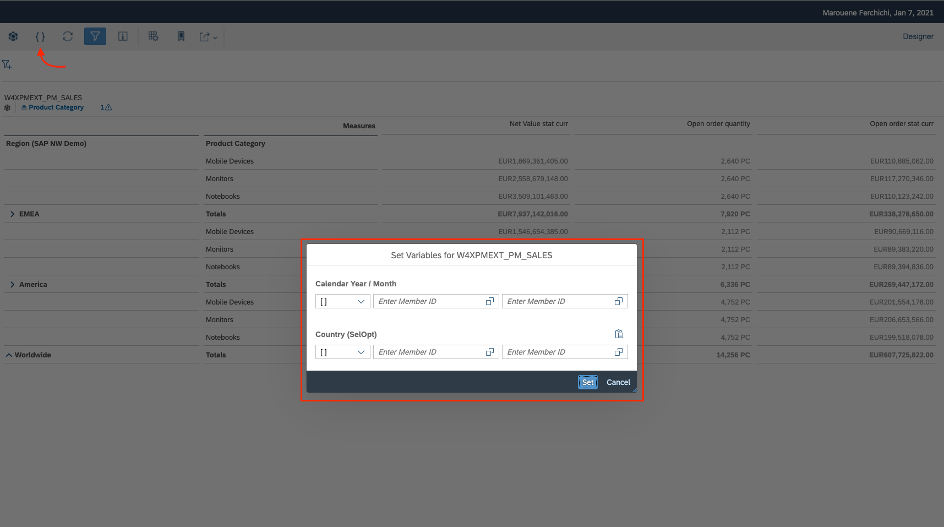
Variables Prompt Dialog:
In case you are running the Generic Analysis with SAC models which contains Variables, you can Set the Variables by clicking the icon { } from the tool bar:
Pause Refresh:
the main goal of this functionality is to control table refresh behavior to improve the runtime performance. You can pause refresh the table until you complete adding/removing dimensions, filters and measures into the table:
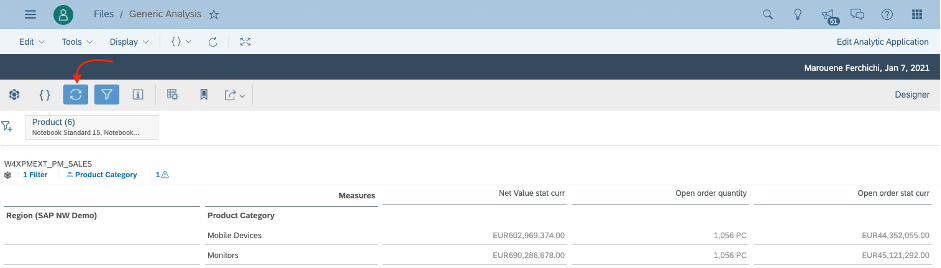
When user activate the Pause/Refresh (highlighted in Blue as shown in the screenshot) from the tool bar, it should not trigger any data refresh in runtime until then Pause/refresh is disactivated.
Filter Line Functionalities:
You can show/hide the filter bar by pressing the Show Filter icon from the tool bar.
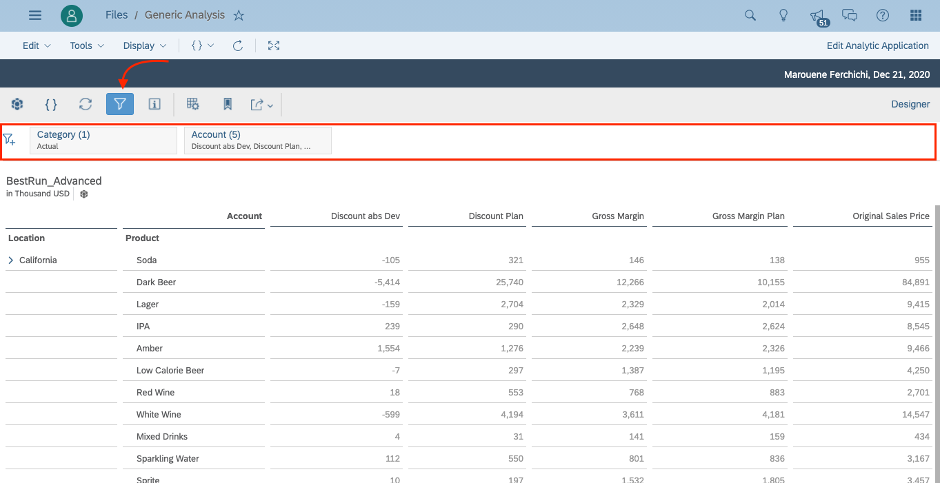
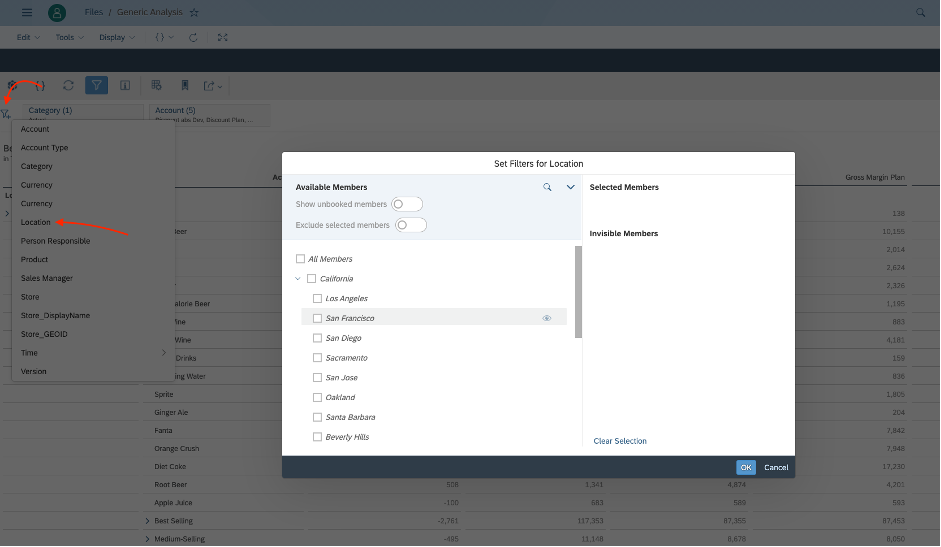
From the filter line you will be able to add new filters by pressing the (+) sign. You can select the available dimensions based on your model in order to set new filters.
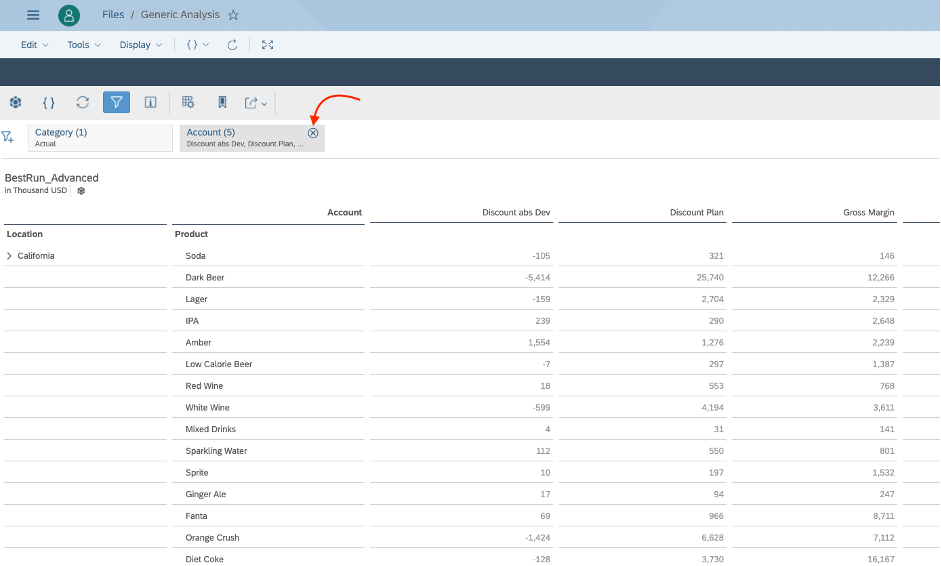
From the same Filter line, you can delete existing filters by a simple click on the (x) icon as shown in the screenshot.
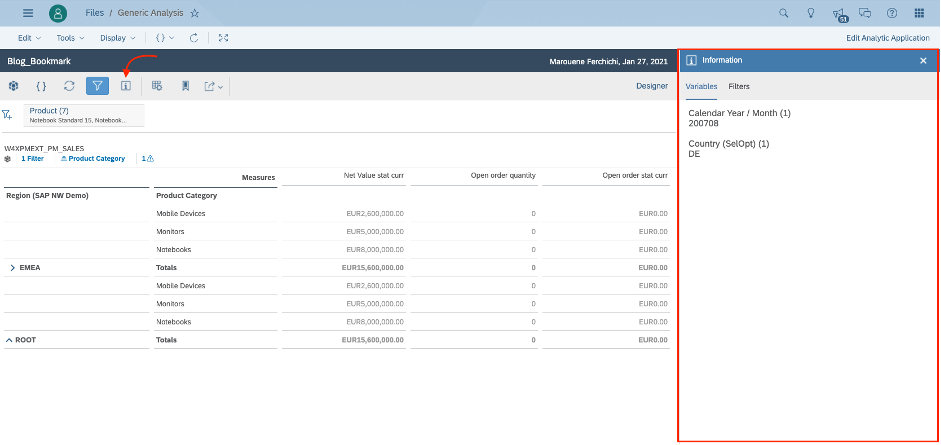
Information:
The info panel offers you the possibility to visualise your available Filters and Variables already set during the exploration of your model.
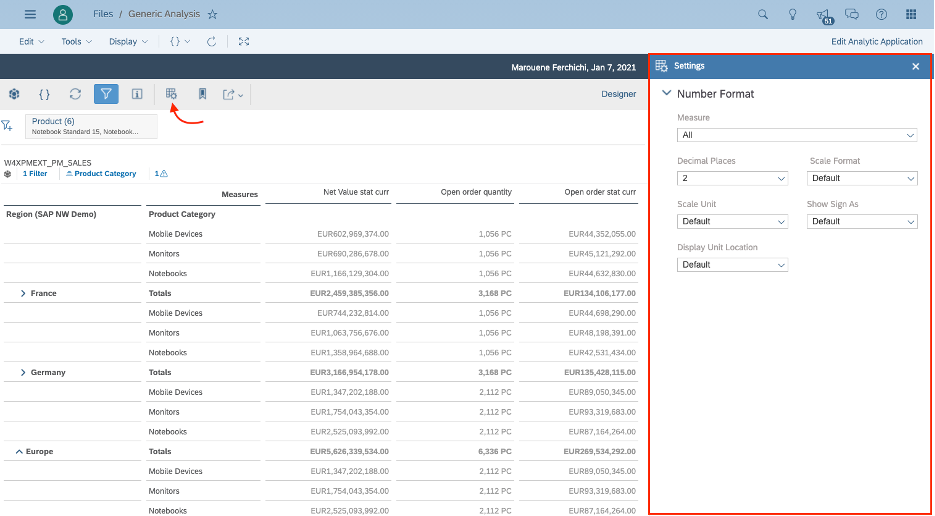
Settings:
With the ready-to-run application we can set or modify the Number Format of all the available Measures within a model. By clicking the Settings icon, a new panel will be shown on the right side of the application where you can select the Measure that you want to set, you can change the Decimal Places, the Scale Format, the Scale Unit, the Show Sign As and the Display Unit Location.
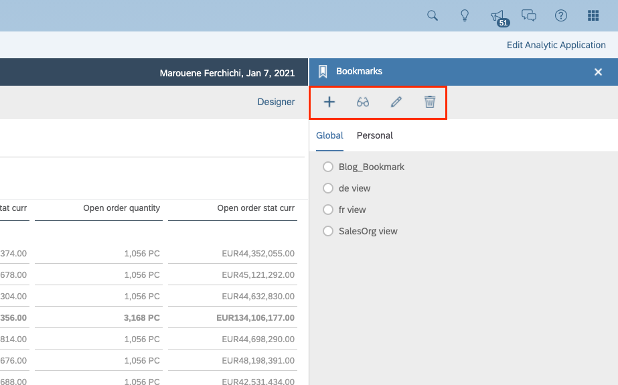
Bookmarks:
The Generic Analysis application offers you the possibility to manage either Global Bookmarks which they are visible for all users or Personal Bookmarks visible only by you. For that you need only to open the Bookmarks panel by a simple click on the Bookmark icon.
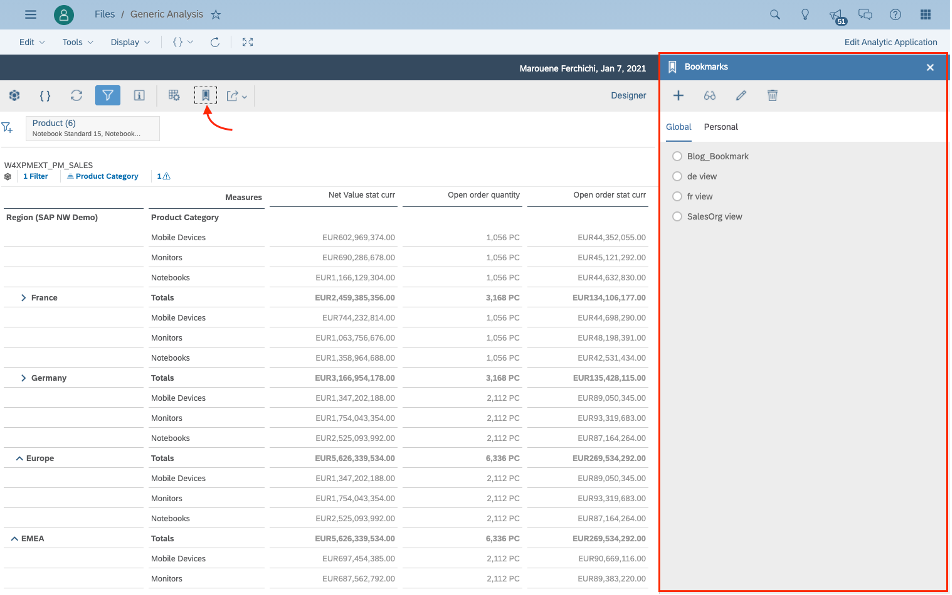
You can add, open, overwrite or delete either your own Global or Personal Bookmarks from the Panel in easy and simple way. You can navigate as well between your Personal and Global Bookmarks from the same Panel. All the Bookmarks (Global and Personal) created will be available in the selection dialog during the application execution
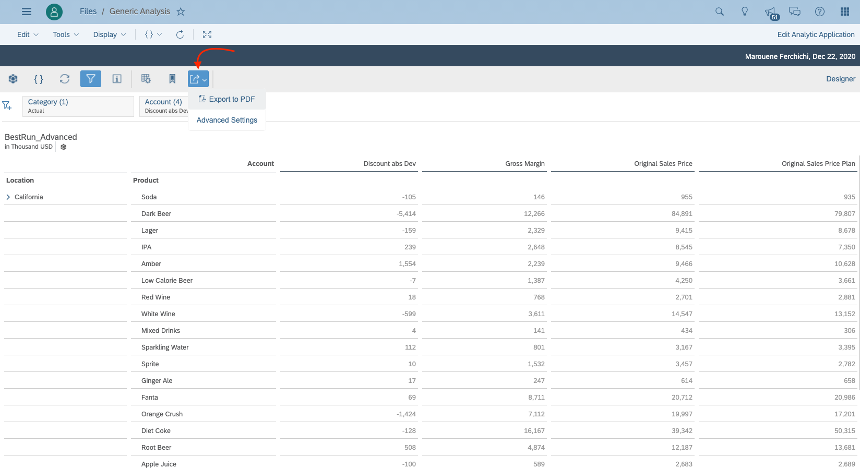
Export to PDF:
In case you want to export your table view to PDF, with the Generic Analysis application you just need some few simple steps to achieve the export. By pressing the export icon, you will be able to either Export to PDF directly with the default settings or open the Advanced Settings in order to change your own configurations.
By opening the Advanced settings, you will be able to set the Orientation, the Paper Size, the Page number location, the Date location of the export, and some more other preferences.
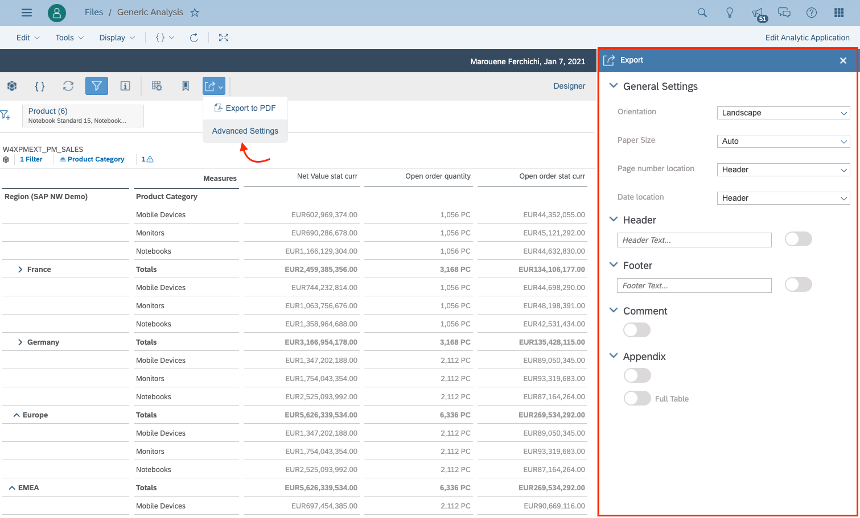
Note: don’t forget to close the export settings panel after you finish your settings in order to avoid exporting also the General settings view.
Table setting panel: More Features
As last, you still can explore more actions which are available in the context menu of the table by just clicking the 3 dots:
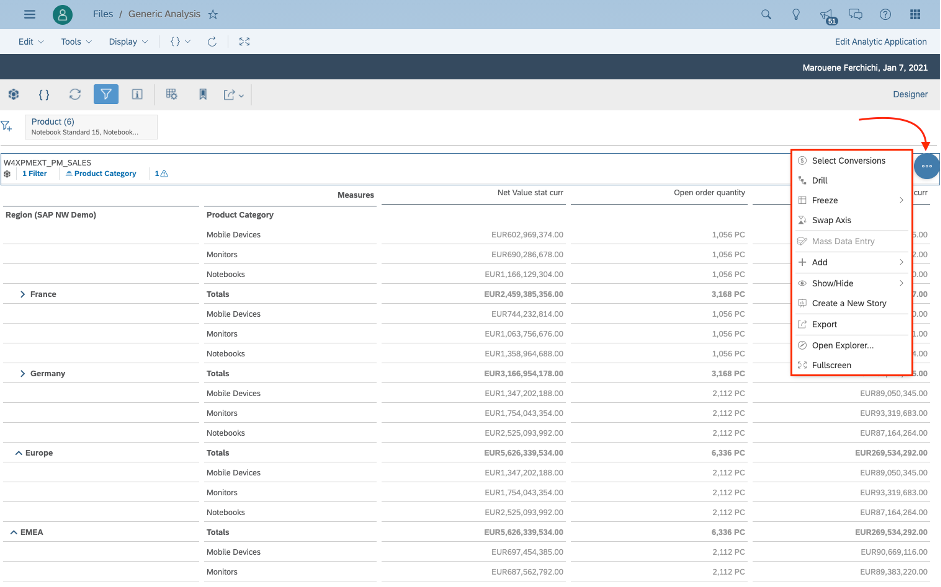
As shown above, there are additional actions available which they can be relevant and useful for your scenario. For example, you can Create a New Story based in the Table that you built, you can as well Add a comment, Swap Axis …


