When we migrated to the new version of SAP Business Object Analysis, I found it little different than what I was using earlier. As it being an end client tool, I also found it difficult to navigate through various options. So thought might be a walk through the SAP BO Analysis Edition for Microsoft office 2.1.2.xxxxx would be helpful for other users as well. The below blog is first of 2 blog series that I would be writing. Please add if you are already using the tool and you feel I missed on something important.
- It is part of SAP Business Object Analysis offering of SAP.
- Embedded In Microsoft Excel.
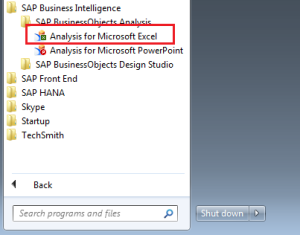
Assuming you have already installed the setup, you can find it under:
Start–>Programs–>SAP Business Intelligence –>SAP Business Objects Analysis –>Analysis for Microsoft Excel.
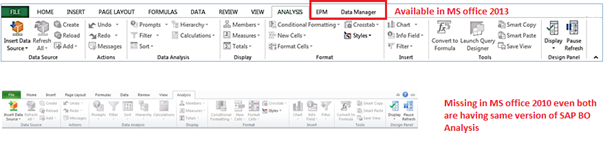
The look and feel of SAP Business Objects Analysis for Microsoft Excel varies not only with version of SAP Business Objects Analysis but also with your version of Microsoft Office. Though here I am using the latest version of SAP BO Analysis – 2.1.2.49735 but because of my Microsoft Office version being 2010, it will look different than someone who has Office 2013.
Navigation in Analysis for Microsoft Excel
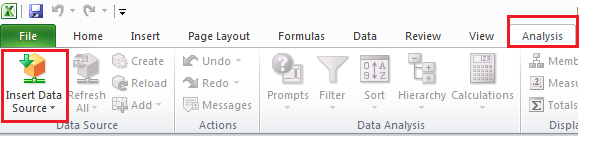
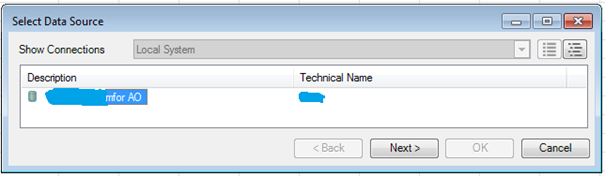
1. First Step – Logon to BI system (XXX)
Start Analysis –> Insert Data Source –> Select Data Source .
- You will only see systems , which you have added to your SAP GUI logon Pad manually. SSO or systems pushed by IT infrastructure often are not visible here even though you can see them when you log in directly via SAP GUI logon pass. So create Manual SAP –Logon Entry (even though you already might have the SSO or systems already pushed by IT).
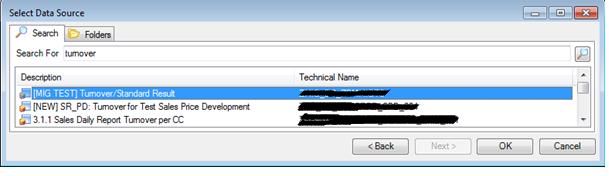
2. Select Query
You can directly search if you have the name of the query handy (or you remember keyword) or you can traverse the folder structure to get the query.
Search as below:-
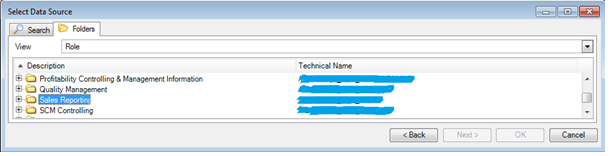
Or Folder wise search: → Folders → View: Role → choose query
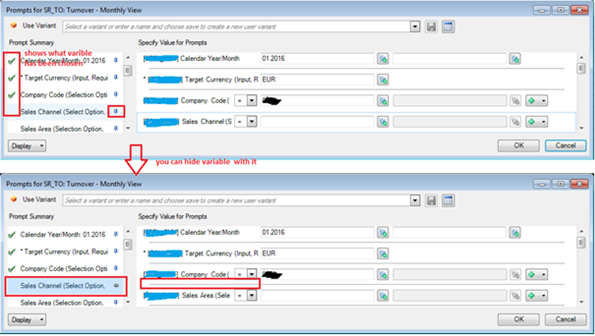
Choose relevant data filter ( company code, time , organization, detailed ).
The result is displayed as below, with Result Area showing the result as per selection and Design Panel giving option to still play around with various characteristics.
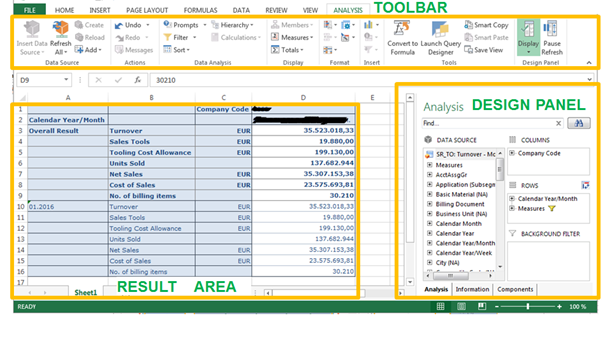
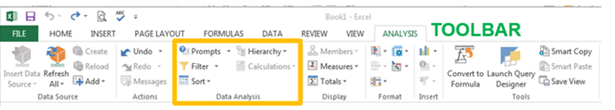
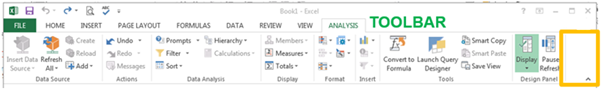
Let’s now Move to Navigation and see Toolbar interaction with Result Area.
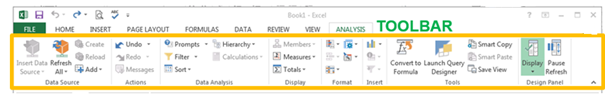
Analysis Toolbar:
- the analysis toolbar interacts with the chosen field in the result area
- toolbar functions are available or not (greyed out) depends on which field in the result area is chosen
- a few functions available in the toolbar can also be available in the result area by using the context menu of a characteristic or key figure or by using the Design panel
- exclusive toolbar functions –> [EX]
- also available in result area –> [RA]
- also available in design panel –>[DP]
- exclusive toolbar functions –> [EX]
ToolBar: Data Sources
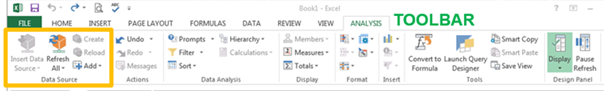
- Insert Data Source: connect to Systems- XXX and open query [EX]
- You can add queries from different areas on one or different sheets
- Choose cell in sheet where you want to add the query
- You can add queries from different areas on one or different sheets
- Refresh All: refreshes every query contained in workbook [EX]
- Refresh Data Source: refreshes only query marked in the sheet
- Reset Data Source: reset initial filter of query marked in the sheet
- Create/ Reload & Add Functions not available (available only for HANA sources ).
- Refresh Data Source: refreshes only query marked in the sheet
Toolbar: Actions
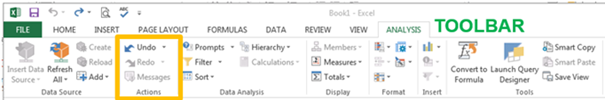
- Undo: up to 10 action steps [EX]
- Redo: up to 10 action steps [EX]
- Messages: warning or error messages will be displayed here [EX]
Toolbar: Data Analysis
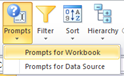
- Prompts: Reset Initial filter for one query or complete workbook [EX]
- Like in Data Source à Refresh All à Reset DataSource“ area:
- Prompt datasource: change filter for marked query in result area
- Prompt workbook: change filter for all queries in workbook
- Like in Data Source à Refresh All à Reset DataSource“ area:
- Filter: depending on marked field in result area: [RA; DP]
- Filter by Member: marked Characteristic Filter/ Display Key Figure
- Filter by Measure: create rule for marked Key Figure .
- Filter by Member: marked Characteristic Filter/ Display Key Figure
- Sort: change sort direction of marked element in result area [RA]
- ascending or descending by key figure,
- by key or text of characteristic or attribute
- ascending or descending by key figure,
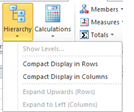
- Hierarchy: by first element in the row or in the column [EX]
- expand by second element in rows or columns
- collapse by second element in rows or columns
- expand by second element in rows or columns
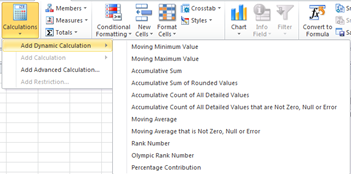
- Calculations: key figure calculations based measure marked in result area [RA]
- ADD Dynamic Calculation: new measure with new single values
- ADD Calculation: new measure based on simple calculation between two marked key figures in result area
- ADD Advanced Calculation: new measure based on calculations between available key figures in the query
- ADD Restriction function is not available.
- ADD Dynamic Calculation: new measure with new single values
Toolbar: Display
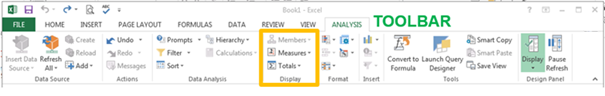
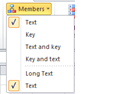
- Members: show key and/or text of marked characteristic in result area [RA]
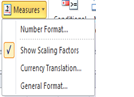
- Measures: adjust properties of marked key figure in result area [RA]
- number format: scaling factor, decimal places
- Show or Hide scaling factors
- general key figures format: display of negative values and zeros
- number format: scaling factor, decimal places
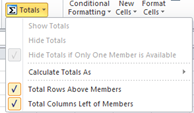
- Totals: show/ position/ calculation
- hide/ show totals for a characteristic in result area
- change totals position in rows and columns
- change totals calculation behavior of characteristic (mark header)
- hide/ show totals for a characteristic in result area
Toolbar: Format
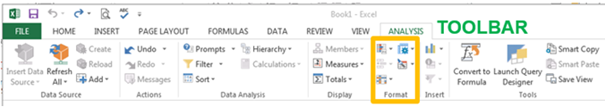
- Conditional Formatting [EX]:
- format value cells depending on key figures and characteristics
- New Cells [RA]: add new layout lines depending on marked cell in result area
- Format Cells [RA]: format marked characteristic or value cells in result area
- Crosstab [EX]: general format of result area
- Apply Default Formats/ Symbols for Parent Members of Hierarchies
- Optimum Cell Width/ Height
- Repeat Members: always show values of characteristics
- Apply Default Formats/ Symbols for Parent Members of Hierarchies
- Styles [EX] : apply, change, save, delete, import, export style for the result area
Toolbar: Insert
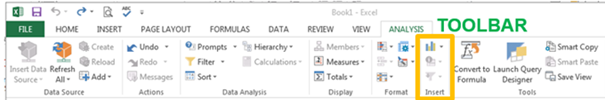
- Chart: insert for marked query in result area different chart types
- Info Field: insert BI Info field i.e. „Last Data Update“ outside ouf result area
- Filter: insert characteristic filter outside of result area in the excel sheet
Toolbar: Tools
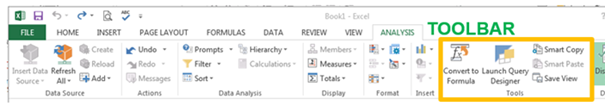
- Convert to Formula:
- useful to use excel formatting, cut and paste result area cells, insert additional excel formulas, etc…
- restrictions: no context menu, no drag & drop available
- useful to use excel formatting, cut and paste result area cells, insert additional excel formulas, etc…
- Launch Query Designer: show design of report
- Smart Copy/ Smart Paste: copy result area and paste into another excel sheet i.e.
- Save View: Save Query View to the BI Server
- Toolbar: Design Panel
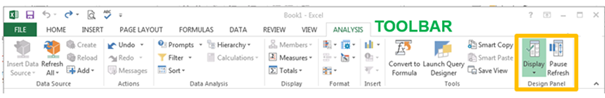
- Display:
- show or hide design panel
- show/ hide properties of marked key figures or characteristics
- show or hide technical names in design panel
- Pause Refresh: deactivate/ activate refresh after every navigation step
- Toolbar: Hide
- Hide Toolbar: press up button
- Show Toolbar: press Analysis Tab
- Hold Analysis Tollbar: press pin button


