In datasets with multiple features, one typical type of outliers are those corresponding to extreme values in numerical features. In this blog post, we will show how to use statistical tests algorithms in Python machine learning client for SAP HANA(i.e. hana_ml) to detect such outliers.
In this blog post, you will learn:
- Outlier detection using variance test
- Outlier detection using IQR test
Introduction
Outliers are points in datasets that are significantly different from others observations. Their appearance could be the result of many reasons, like measurement variability, experimental error, unexpected event, etc. Outliers do not always linked with errors or bad things, sometimes they are equivalent to ‘outstanding’ and worth more of our investigation. However, since their existence often poses some difficulty for statistical analysis of the dataset, the detection of outliers is often desired for dataset preprocessing. The detected outliers could then be removed from the dataset, or analyzed by more careful studies, based on what role the outliers play in different datasets.
The detection of outliers typically depends on the modeling inliers that are considered indifferent from most data points in the dataset. A typical case is: for a collection of numerical values, values that centered around the sample mean/median are considered to be inliers, while values deviates greatly from the sample mean/median are usually considered to be outliers. In this tutorial we consider the detection of such type of outliers using statistical tests.
There are many other statistical test algorithms for detecting outliers, like variance test, inter-quartile-range(IQR) test, extreme studentized deviate(ESD) test, etc. Among them, the following two algorithms are the main focus of this blog post:
- Variance Test – Perhaps the most simple yet popular approach for outlier detection. Given a colletion of numerical values, the sample mean ?̃ and sample ?̃ is firstly computed, with a pre-specified positive multiplier ?α, a range of normality [?̃ −??̃ ,?̃ +??̃ ] is defined. If a point is within this range, then it is labeled as a inlier, otherwise it is labeled as an outlier.
- IQR Test – Simliar to variance test, it also specify a range to contain inlier points, while outliers are points outside the specified range. Two quartiles ?1 (25th percentile) and ?3 (75th percentile) and the quartile range ?=?3−?1 is used to define the interval for inliers: [?1−??,?3+??] , where ? is a pre-specified positive multiplier that is usually set to 1.5. The estimation of quartiles is much more robust to the presence of extreme outliers compared to mean/variance, so the detection also becomes more robust.
Solutions
The two statistical test algorithms mentioned in the previous section are only for 1D numerical values. For datasets with multiple numerical features, we can inspect each intested feature separately for outlier detection, and then aggregate the detection results as a whole. In this way we would potentially detect a fair amount of outliers from the dataset.
The two test algorithms natually leads to the two use case that will be illustrated in this section. We will elaborate variance test for outliers detection in the first use case, with illustration of a possible weakness. IQR test for outlier detection, which is not sufferred from such weakness, will be elaborated in the 2nd use case.
Before we go to detalied use cases, we firstly need to establish a sound connection to SAP HANA.

The established ConnectionContext object cc is a connection to SAP HANA, with which we can send out queries to the database and fetch the corresponding result.
Use Cases
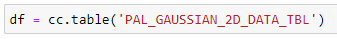
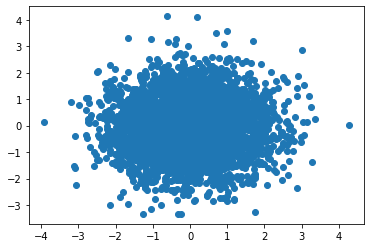
The dataset applied in both use cases is a two-variate dataset Generated from a 2D Gaussian distribution. Here we assumed it is stored in a HANA table with name of “PAL_GAUSSIAN_2D_DATA_TBL”. Then, we can get the handle of it in python client using the table() function in the established ConnectionContext object.
The handle df itself is a hana_ml DataFrame object, which contains the information of data in database. We can apply the collect() method of hana_ml DataFrame to fetch the data from database to the Python client.
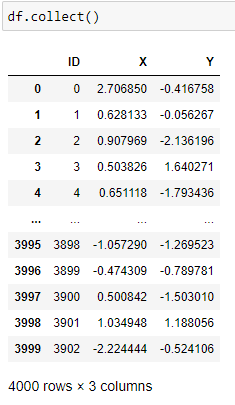
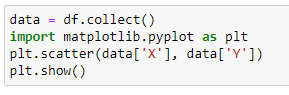
The dataset has 3 columns: one ID column and two feature columns with name X and Y, respectively. Then, we can get a shallow impression of the dataset using the scatter plot functionality in Python.
Outlier Detection using Variance Test
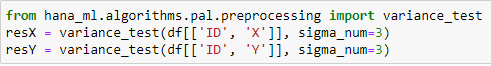
Variance test is categorized as a preprocessing algorithm in hana_ml, we import it from hana_ml and apply it to the two feature columns X and Y, respectively.
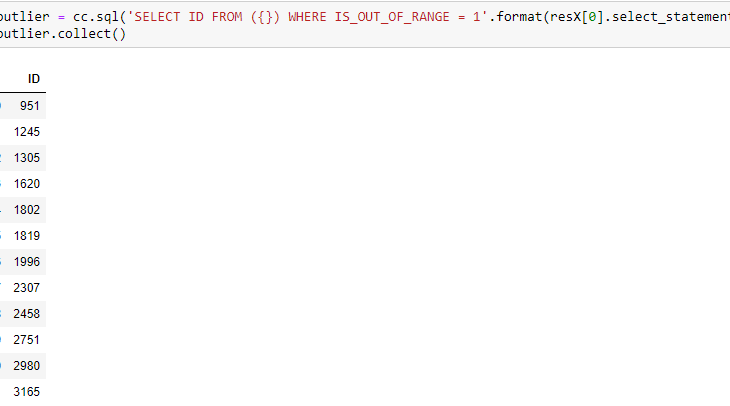
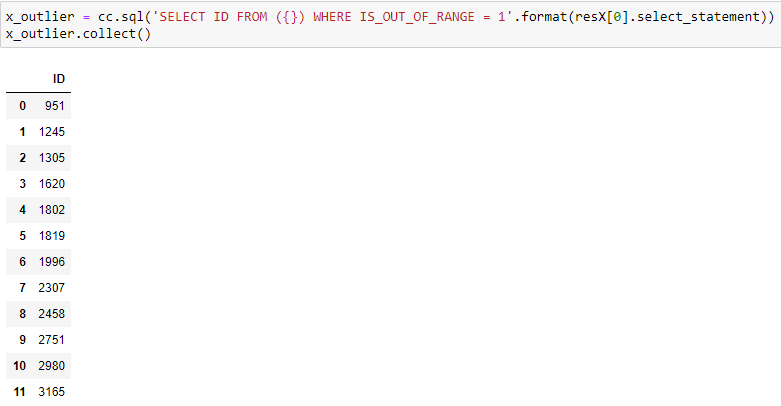
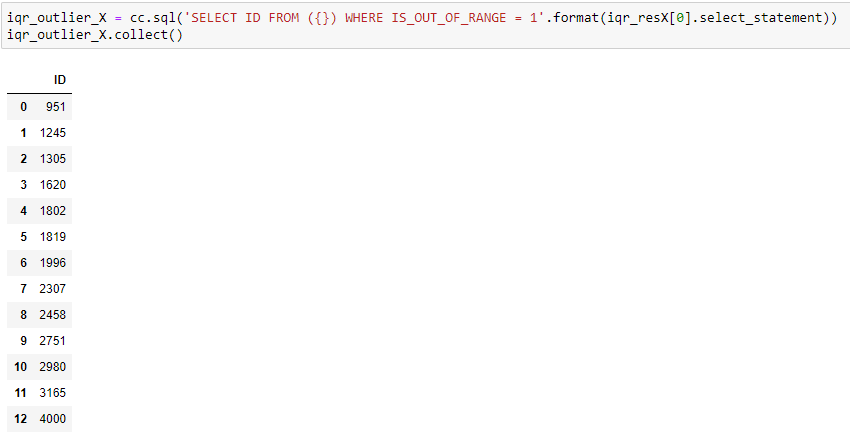
Variance test returns a tuple of two hana_ml DataFrames, where the first one is the outlier detection result, and the second one is related statistics of the data involved in outlier detection. For each detection result, the ID column is there along with a new column of the name ‘IS_OUT_OF_RANGE’. The IS_OUT_OF_RANGE column contains 0s and 1s, where 0 is for inlier and 1 for outlier. We can check the detected outliers in X values via a SQL query statement as follows:
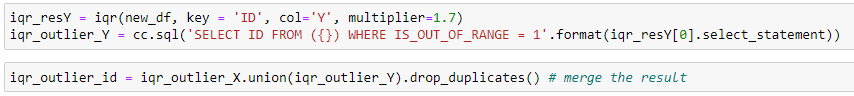
The detection of outliers in the Y column can be done in a similar way. Consequently, the two detection result could be unified to form the overall detection result of outliers(using the union() function for hana_ml DataFrames). However, there might be some data points that are recognized as outliers in both X and Y values, which creates duplicated values in the unified detection result. We need to apply the drop_duplicates() function for the removal of duplicated values in this case. The entire procedure is illustrated as follows:


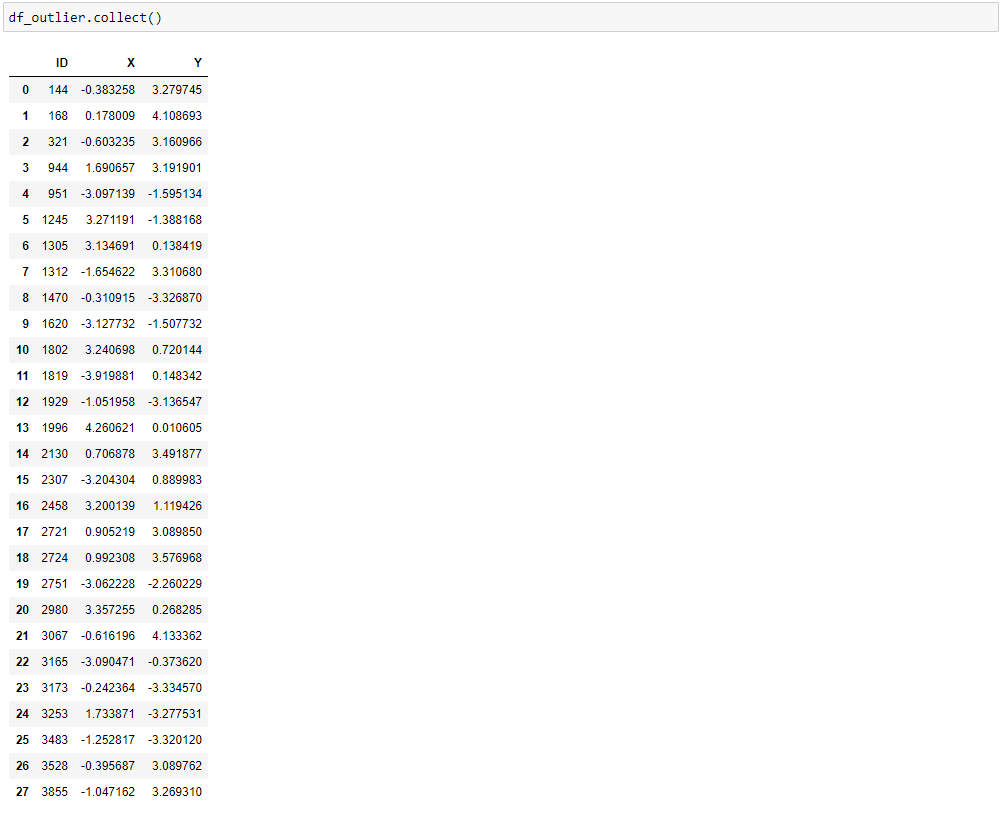
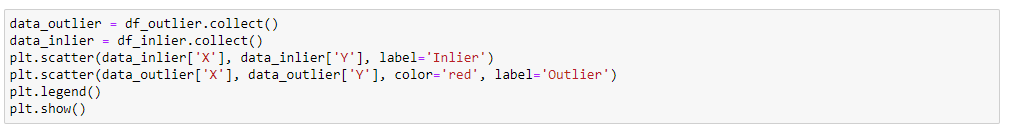
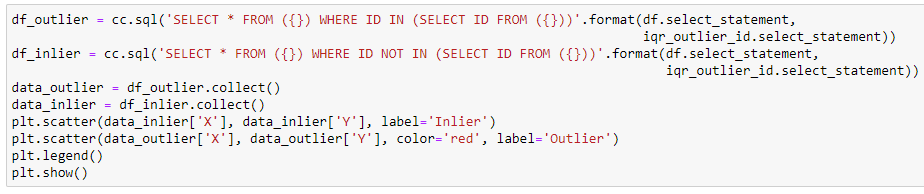
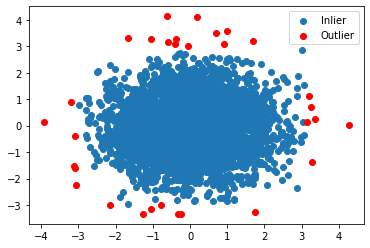
Finally, we draw the scatter plot of the detected outliers as follows:


However, it is known that the effectivity of variance test is easily affected by the existence of extreme outliers. For example, we add an additional point to the 2D Gaussian dataset used above as follows:
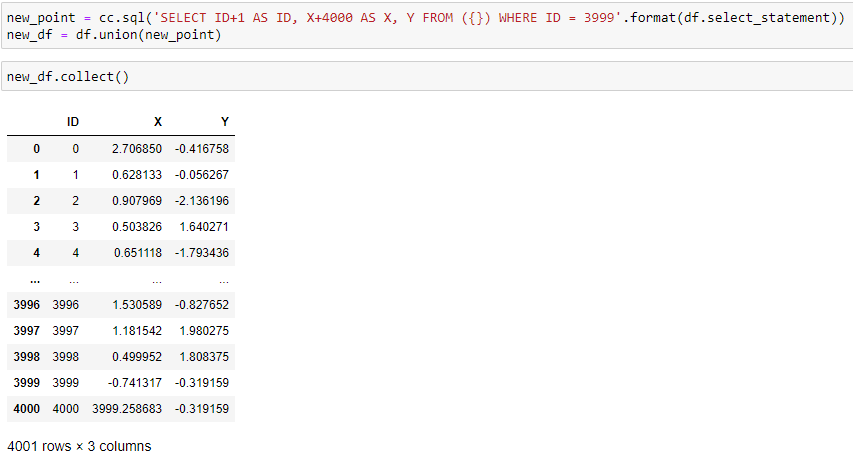
The augmented dataset contains a new data point with ID 4000, which has very large X value(~4000, other data points have X values centered around 0, commonly no greater than 5 in absolute sense). Then, if we apply variance test with the X values in the augmented dataset, we will obtain the following result:
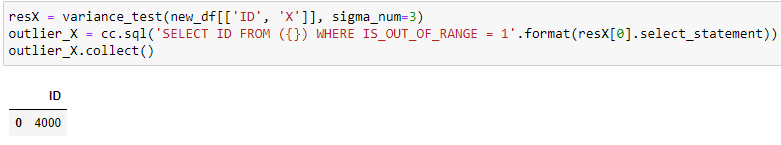
So the variance test on X results in the detection of only the newly added extreme outlier. Intrinsically, this happens because the newly added extreme outlier makes the originally detected outliers look much more ‘normal’; while numerically, variance test depends on the calculation of sample mean and variance, both are very sensitive to existence of extreme values in the dataset.
In the following section we introduce an outlier detection approach called inter-quartile-range(IQR) that is much more robust to the existence of extreme outliers.
Outlier Detection using Inter-Quartile-Range(IQR) Test
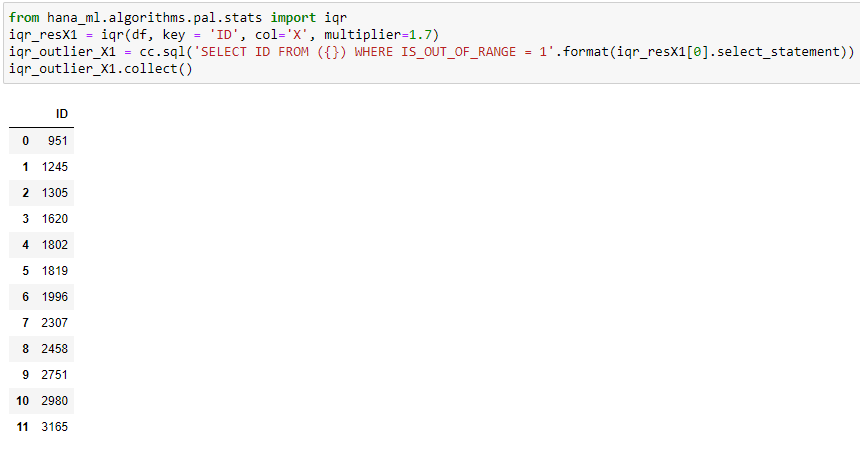
IQR is categorized as an statistics algorithm in hana_ml, we can import it and then apply it to any data values of interest. However, for the ease of comparison between variance test and IQR test, we first manually tune a multiplier for IQR, so that IQR test will detect similar number of outliers in X column as variance test for the origin dataset. We find that a multiplier around 1.7 satisfies our constraint, illustrated as follows:
Next, we apply IQR test with multiplier 1.7 to the augmented dataset with an added extreme X-valued point in the previous section.

Following is the illustration of the detection result.
So under IQR test, the introduction of a new extreme outlier only results in the added detection of this point itself, and all other originally detected outliers remain to be detected.
For completeness, let us continue the outlier detection on Y, and then view the overall detection results on the original dataset. The procedure is similar to that of variance test.
The detection result is quite similar to that of variance test on the original dataset, which is not at all affected by the introduction of the extreme outlier in X-value.


