Introduction:
Inventory ageing report gives an overview about the distribution of available stock of materials from over a period of time, from a selected key date in reverse chronological manner.
For example, a particular material might have a stock of 100 PCS on a selected key date. This stock could have been purchased in 2 lots of 50 and 50 between 6 to 12 months and before 12 months. This material might not have been consumed and laying in stock as non moving item.
Also Read: SAP MM Certification Preparation Guide
This report aims at giving details of such stock distributions plotted over different periods known as buckets.
By segregating and analysing such materials, the finance and purchasing teams will be able to plan and manage inventories in an efficient manner.
The buckets of time could be anything within a month, within 6 months or for more than a year .
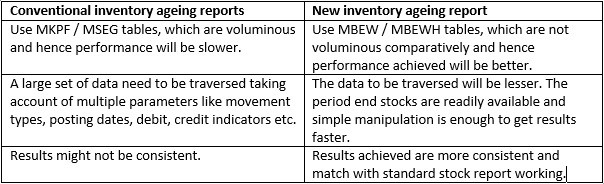
How the New Inventory ageing report logic differs from the regularly used custom ageing reports:
Brief overview of the logic employed in the new ageing report:
The report does three activities predominantly.
- Calculating the stock of the material on a selected key date.
- Deriving the periods of time, otherwise known as buckets like stocks within a month, within 2 months….etc, dynamically based on the inputs given on the selection screen.
- Calculating the stocks of the material in the various bucket periods, arrived in previous step, and giving the output.
Logic of working in detail:
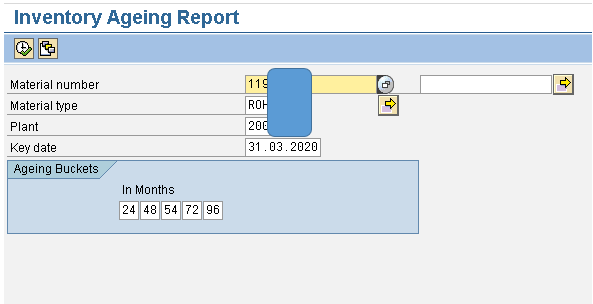
Please refer the input screen.
1. Once the plant / material types and key date is entered, valid materials in the selected plant and material type are fetched.
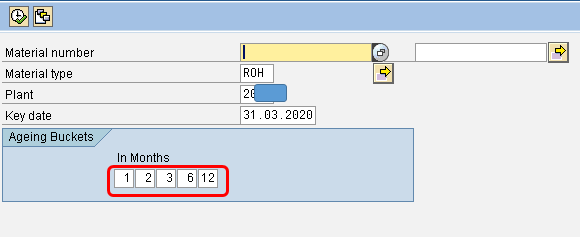
The encircled (red) fields represent the buckets or periods to be analysed.
The buckets are flexible, and can be changed by user as per requirement.
(For better results and practical reasons, it is suggested to set key date as last date of previous month and report be executed in 1st week of current month. This is to get optimum results improvising the working logic of MBEWH table, in which stock is updated only at the close of the month.)
For the above entered combination of buckets and key date, the ageing buckets derived automatically by the system will be like:
| Buckets | In months | From Year / period | To Year period |
| 1 | Within 1 month | 2019 / 11 | 2019 / 12 |
| 2 | Between 1 to 2 months | 2019 / 10 | 2019 / 11 |
| 3 | Between 2 to 3 months | 2019 / 09 | 2019 / 10 |
| 4 | Between 3 to 6 months | 2019 / 06 | 2019 / 09 |
| 5 | Between 6 to 12 months | 2018 / 12 | 2019 / 06 |
| 6 | Greater than 12 months | 2018 / 12 |
2. Calculation of material stock on key date:
Note: The company code in example uses an april to march fiscal year period.
Pass the material / plant (bwkey) field to MBEW table and fetch fiscal year and period.
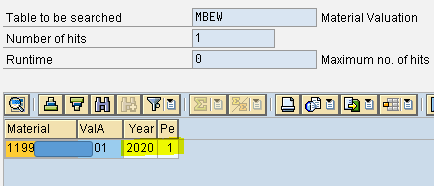
The year / period for material as per MBEW is 2020 / 01, and year / period of the key date given (31.03.20) is 2019 / 12.
1. If the year / period fetched in MBEW is greater than key date year / period, we need to take the stock on key date by passing the respective key date year / period to MBEWH table and get the stock from LBKUM field.
2. If the year / period fetched in MBEW is less than or equal to the year / period of key date then fetch the stock of the material from LBKUM field of MBEW table. This is the key date stock in this case.
3. Constructing the stock details for missing periods per fiscal year.
Please note the below screen shot.

Fiscal Year 2019 has one entry for period 12. There no entries for other periods in year 2019. Similarly in fiscal year 2018, periods stocks in 12, 11, 10, 6, 5 are only listed.
The logic for building the stock details in missing year / period is as below:
The stocks in year / periods not listed have same stock as that of immediately available / listed year / period above the missing period.
If we take year 2017, we have stocks on period 10 and 12. But details for year 11 is missing.
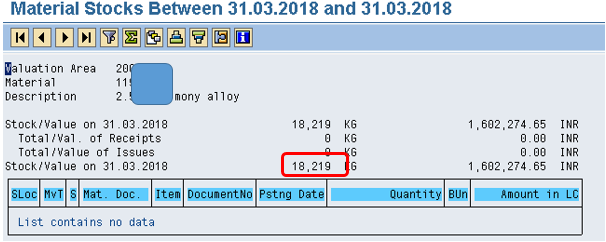
As per above logic the stock in period 11 is simply the stock in immediate available period just above 11, i.e 12 which is 18,219.00.
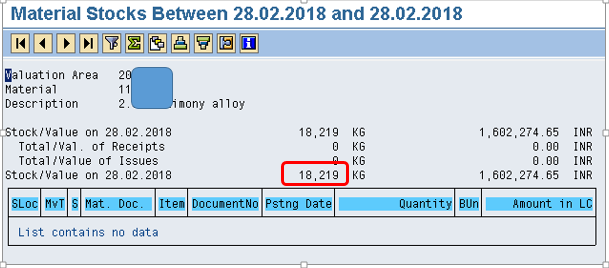
Note: 2017 / 11 is 28.02.18 and 2017 / 12 is 31.03.18.
Stock on 31.03.18 for material :
Stock on 28.02.18 for material :
The stock details are built for the periods determined automatically by the system in step 1.
4. Building the bucket stock information.
The bucket stocks are filled using following logic.
| Buckets | From Year / period | To Year period | Bucket stock derivation |
| 1 | 2019 / 11 | 2019 / 12 | Stock in period 2019/12 – stock in period 2019/11 |
| 2 | 2019 / 10 | 2019 / 11 | Stock in period 2019/11 – stock in period 2019/10 |
| 3 | 2019 / 09 | 2019 / 10 | Stock in period 2019/10 – stock in period 2019/09 |
| 4 | 2019 / 06 | 2019 / 09 | (Stock in period 2019/09 – stock in period 2019/08) + (Stock in period 2019/08 – stock in period 2019/07) + (Stock in period 2019/07- stock in period 2019/06). |
| 5 | 2018 / 12 | 2019 / 06 | (Stock in period 2019/06 – stock in period 2019/05) + (Stock in period 2019/05 – stock in period 2019/04) + (Stock in period 2019/04- stock in period 2019/03) + (stock in period 2019/03 – stock in period 2019/02)+ (Stock in period 2019/02 – stock in period 2019/01)+ (Stock in period 2019/01 – stock in period 2018/12). |
| 6 | 2018 / 12 | Stock in period 2018/12. |
Here for e.g., stock in period 2018/12 means stock at end of the 2018/12.
To check above logic with standard MB5B.
Suppose we have input bucket months as 24, 48, 54, 72, 96 for material .
The bucket details will be as below.
| Buckets | In months | From Year / period | To Year period |
| 1 | Within 24 month | 2017 / 12 | 2019 / 12 |
| 2 | Between 24 to 48 months | 2015 / 12 | 2017 / 12 |
| 3 | Between 48 to 54 months | 2015 / 06 | 2015 / 12 |
| 4 | Between 54 to 72 months | 2013 / 12 | 2015 / 06 |
| 5 | Between 72 to 96 months | 2011 /12 | 2013 /12 |
| 6 | Greater than 96 months | 2011 / 12 |
Converting the year / period info to dates.
Bucket 1: 2017/12 – 31.3.18 2019/12 – 31.3.20
Bucket 2: 2015/12 – 31.3.16 2017/12 – 31.3.18
Bucket 3: 2015/06 – 30.9.15 2015/12 – 31.3.16
Bucket 4: 2013/12 – 31.3.14 2015/06 – 30.09.15
Bucket 5: 2011/12 – 31.3.12 2013/12 – 31.3.14
For bucket 6 the stock on 2011/11 – 31.3.12 is taken.
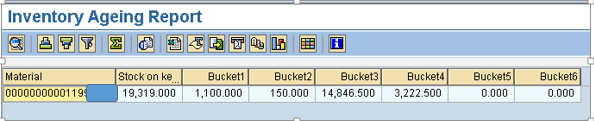
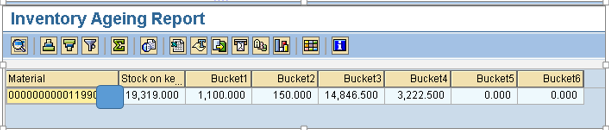
The ageing report output obtained is :
Comparing the above report with standard MB5B within the same periods:
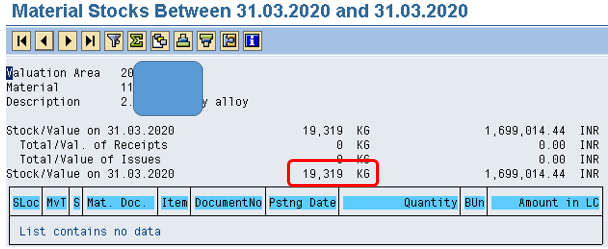
Stock on key date 31.3.20 as per report : 19319.
Stock as per MB5B.
Bucket 1 period stock comparison:
Bucket 1 period : Bucket 1: 2017/12 – 31.3.18 to 2019/12 – 31.3.20
Note: For bucket stock calculation , the difference of total goods receipt and issues within the period must be considered in MB5B.
Stock as per report : 1100.
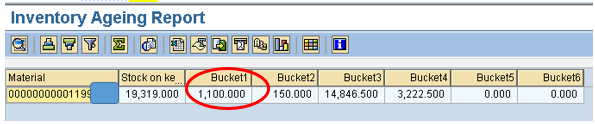
Stock as per MB5B: (1100 = 1100 -0) / (Total Receipts – Total issues) in this period.
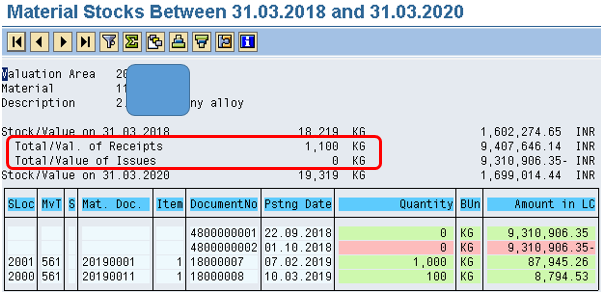
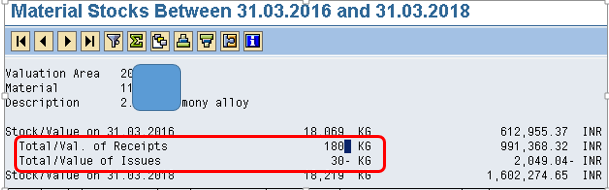
Bucket 2 period stock comparsion:
Bucket 2 period: 2015/12 – 31.3.16 to 2017/12 – 31.3.18
As per report: 150.
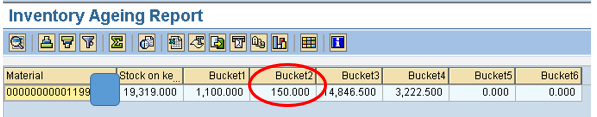
As per MB5B: (150 = 180 – 30)
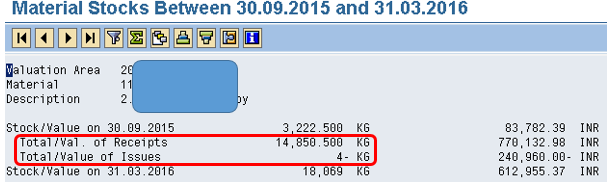
Bucket 3 period stock comparison:
Bucket 3 period : 2015/06 – 30.9.15 to 2015/12 – 31.3.16
Stock as per report : 14846.5
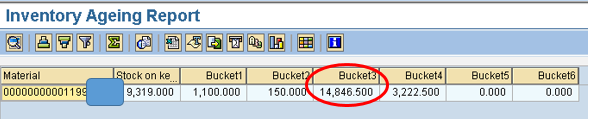
As per MB5B : (14846.5 = 14850.5 – 4)
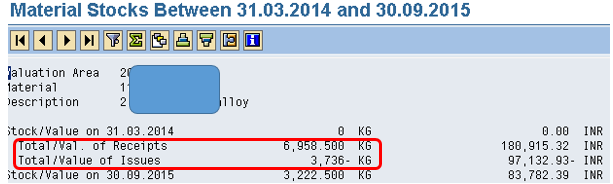
Bucket 4 stock comparison:
Bucket 4 period: 2013/12 – 31.3.14 to 2015/06 – 30.09.15
Stock as per report: 3222.5
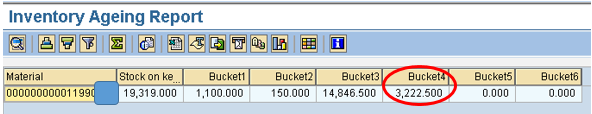
Stock as per MB5B : (3222.5 = 6958.5 – 3736)
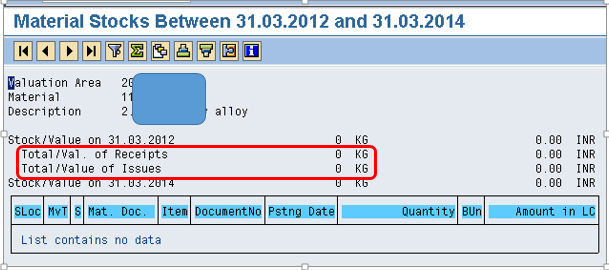
Bucket 5 stock comparison:
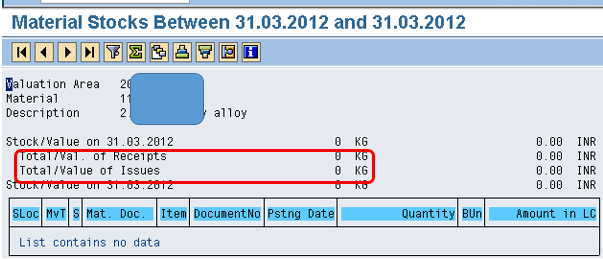
Bucket 5 period: 2011/12 – 31.3.12 to 2013/12 – 31.3.14
Stock as per report: 0
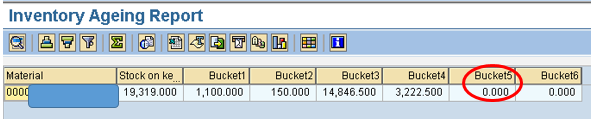
Stock as per MB5B: 0.
Bucket 6 stock comparison:
Bucket 6 is stock on 2011 / 11 – 31.3.12.
Stock as per report : 0.
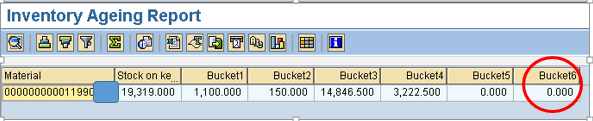
Stock as per MB5B: 0
Sum of bucket stocks matches with stock on key date.