Introduction
On production environment, you can check primary database DTU size and monitor usage with standard Dynatrace dashboards.
Here is an example from SAP – Infra Usage dashboard.

This dashboard does not show the read-only replica database that is available with any production environment.
In this article, we will explain how to create a dedicated dashboard for this.
SAP – Read replica db dashboard
Manually create the dashboard
Here are the instructions to create a new dashboard to monitor read replica database.
- Connect to Dynatrace on the lower environment
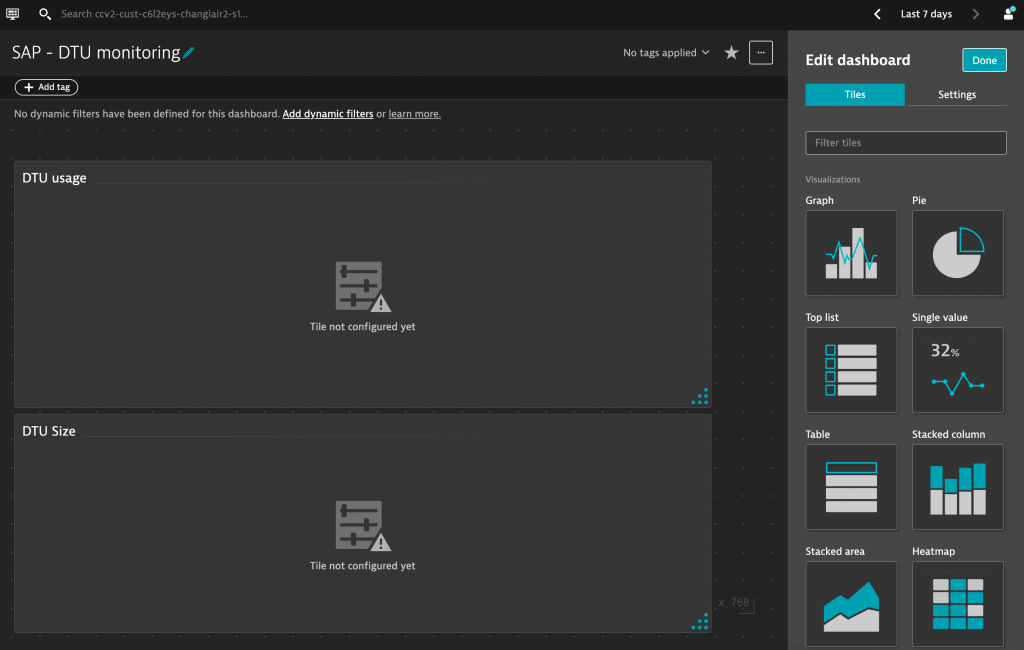
- Go to Dashboard > Create Dashboard
- Enter Dashboard Name: “SAP – Read replica DB”
- Add 3 graphs:
- “Azure DTU”
- “Redo Queue Size (KB)”
- “Replica lag”
- For DTU usage, add the metric ReadOnlyAverageAzureDtu, click Run query and click Saves changes to dashboard
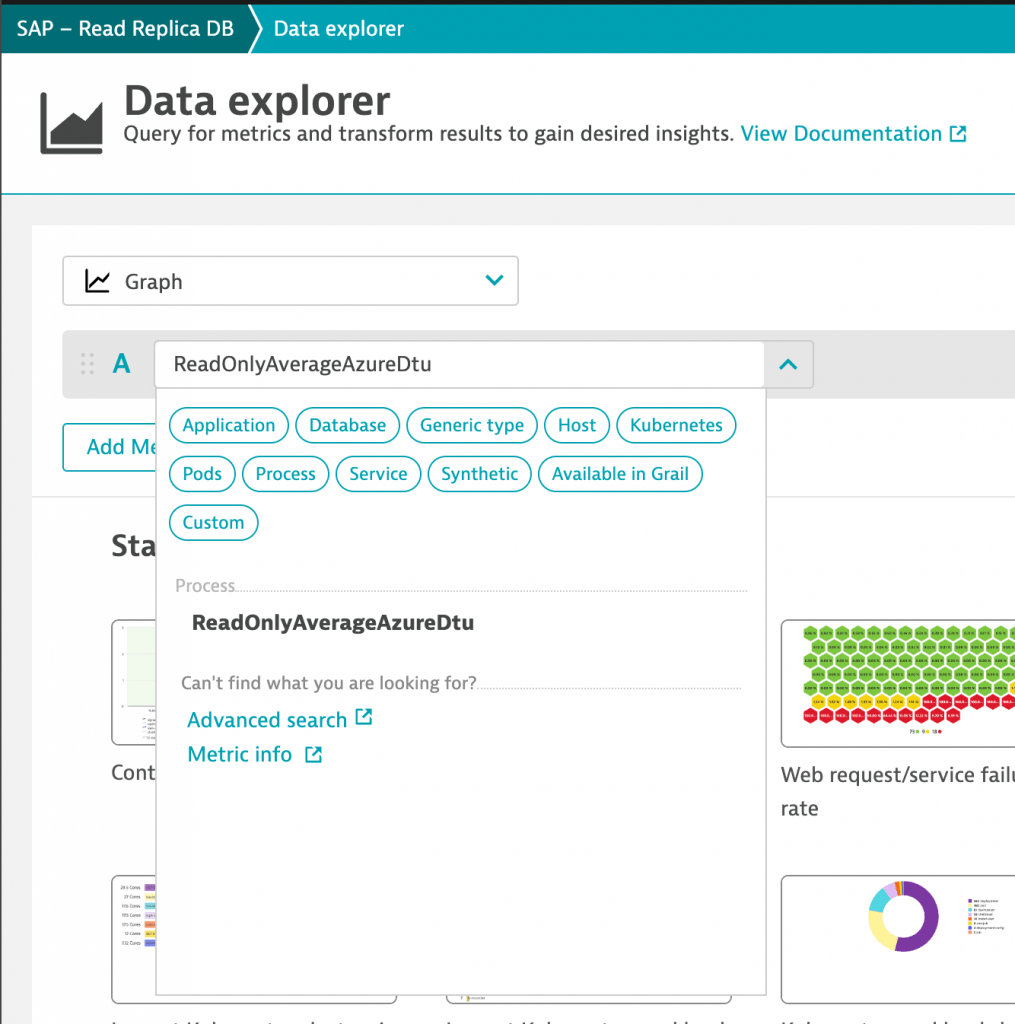
- Do the same for ReadOnlyRedoQueueSizeInKB and ReadOnlySecondaryReplicaLag
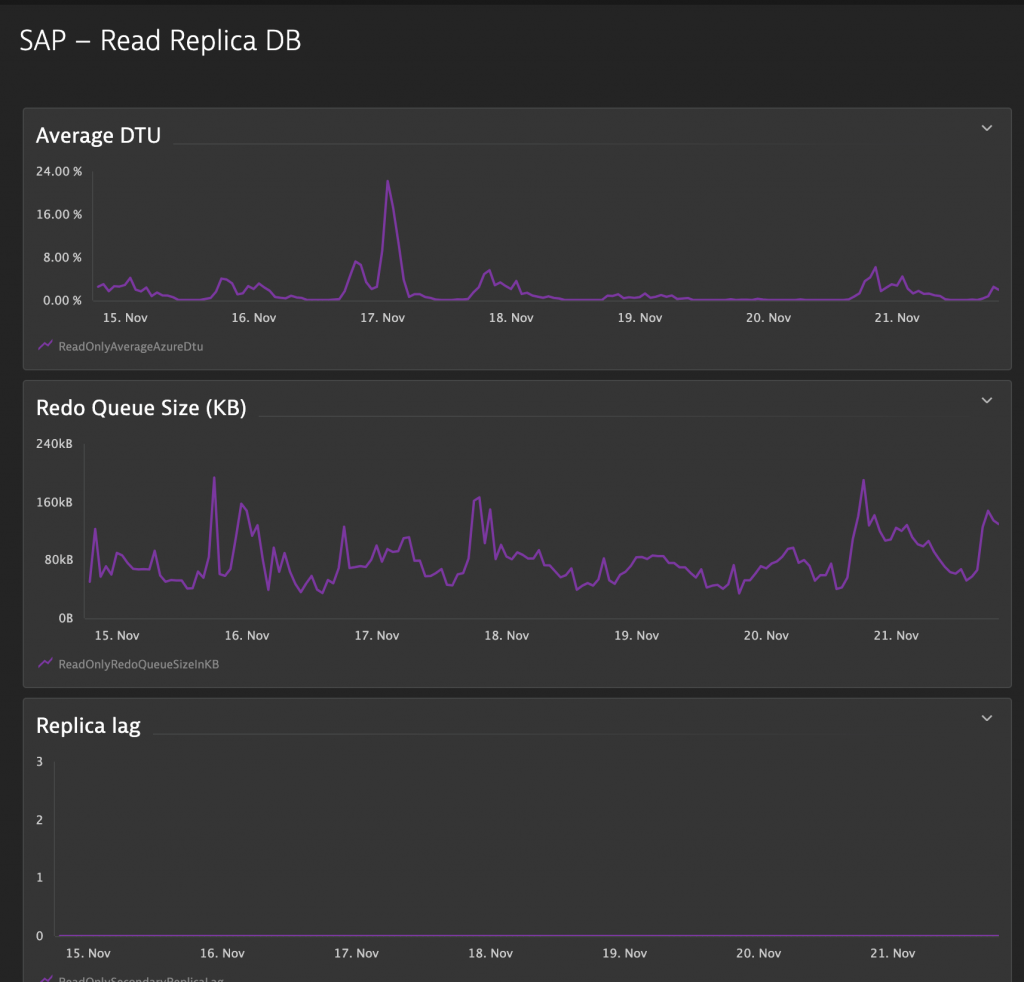
Here is the result:
Import the dashboard
If you want to quickly create the dashboard, you can also import the following JSON file into Dynatrace (Go to Dashboard and click Import dashboard button).
{
  "metadata": {
    "configurationVersions": [
      7
    ],
    "clusterVersion": "1.276.214.20231011-173514"
  },
  "id": "e2c9e980-4182-4d16-80e1-cd3663e11c4f",
  "dashboardMetadata": {
    "name": "SAP – Read Replica DB",
    "shared": false,
    "owner": "i303937",
    "hasConsistentColors": false
  },
  "tiles": [
    {
      "name": "Average DTU",
      "tileType": "DATA_EXPLORER",
      "configured": true,
      "bounds": {
        "top": 0,
        "left": 0,
        "width": 836,
        "height": 228
      },
      "tileFilter": {},
      "isAutoRefreshDisabled": false,
      "customName": "Data explorer results",
      "queries": [
        {
          "id": "A",
          "metric": "ext:custom.jmx.AzureDatabases.metric_ReadOnlyAverageAzureDtu",
          "spaceAggregation": "AUTO",
          "timeAggregation": "DEFAULT",
          "splitBy": [],
          "sortBy": "DESC",
          "sortByDimension": "",
          "filterBy": {
            "nestedFilters": [],
            "criteria": []
          },
          "limit": 20,
          "rate": "NONE",
          "enabled": true
        }
      ],
      "visualConfig": {
        "type": "GRAPH_CHART",
        "global": {},
        "rules": [
          {
            "matcher": "A:",
            "properties": {
              "color": "DEFAULT"
            },
            "seriesOverrides": []
          }
        ],
        "axes": {
          "xAxis": {
            "displayName": "",
            "visible": true
          },
          "yAxes": [
            {
              "displayName": "",
              "visible": true,
              "min": "AUTO",
              "max": "AUTO",
              "position": "LEFT",
              "queryIds": [
                "A"
              ],
              "defaultAxis": true
            }
          ]
        },
        "heatmapSettings": {
          "yAxis": "VALUE",
          "showLabels": false
        },
        "singleValueSettings": {
          "showTrend": true,
          "showSparkLine": true,
          "linkTileColorToThreshold": true
        },
        "thresholds": [
          {
            "axisTarget": "LEFT",
            "rules": [
              {
                "color": "#7dc540"
              },
              {
                "color": "#f5d30f"
              },
              {
                "color": "#dc172a"
              }
            ],
            "visible": true
          }
        ],
        "tableSettings": {
          "hiddenColumns": []
        },
        "graphChartSettings": {
          "connectNulls": false
        },
        "honeycombSettings": {
          "showHive": true,
          "showLegend": true,
          "showLabels": false
        }
      },
      "queriesSettings": {
        "resolution": ""
      },
      "metricExpressions": [
        "resolution=null&(ext:custom.jmx.AzureDatabases.metric_ReadOnlyAverageAzureDtu:splitBy():sort(value(auto,descending)):limit(20)):limit(100):names"
      ]
    },
    {
      "name": "Replica lag",
      "tileType": "DATA_EXPLORER",
      "configured": true,
      "bounds": {
        "top": 494,
        "left": 0,
        "width": 836,
        "height": 266
      },
      "tileFilter": {},
      "isAutoRefreshDisabled": false,
      "customName": "Data explorer results",
      "queries": [
        {
          "id": "A",
          "metric": "ext:custom.jmx.AzureDatabases.metric_ReadOnlySecondaryReplicaLag",
          "spaceAggregation": "AUTO",
          "timeAggregation": "DEFAULT",
          "splitBy": [],
          "sortBy": "DESC",
          "sortByDimension": "",
          "filterBy": {
            "nestedFilters": [],
            "criteria": []
          },
          "limit": 20,
          "rate": "NONE",
          "enabled": true
        }
      ],
      "visualConfig": {
        "type": "GRAPH_CHART",
        "global": {},
        "rules": [
          {
            "matcher": "A:",
            "properties": {
              "color": "DEFAULT"
            },
            "seriesOverrides": []
          }
        ],
        "axes": {
          "xAxis": {
            "displayName": "",
            "visible": true
          },
          "yAxes": [
            {
              "displayName": "",
              "visible": true,
              "min": "AUTO",
              "max": "AUTO",
              "position": "LEFT",
              "queryIds": [
                "A"
              ],
              "defaultAxis": true
            }
          ]
        },
        "heatmapSettings": {
          "yAxis": "VALUE",
          "showLabels": false
        },
        "singleValueSettings": {
          "showTrend": true,
          "showSparkLine": true,
          "linkTileColorToThreshold": true
        },
        "thresholds": [
          {
            "axisTarget": "LEFT",
            "rules": [
              {
                "color": "#7dc540"
              },
              {
                "color": "#f5d30f"
              },
              {
                "color": "#dc172a"
              }
            ],
            "visible": true
          }
        ],
        "tableSettings": {
          "hiddenColumns": []
        },
        "graphChartSettings": {
          "connectNulls": false
        },
        "honeycombSettings": {
          "showHive": true,
          "showLegend": true,
          "showLabels": false
        }
      },
      "queriesSettings": {
        "resolution": ""
      },
      "metricExpressions": [
        "resolution=null&(ext:custom.jmx.AzureDatabases.metric_ReadOnlySecondaryReplicaLag:splitBy():sort(value(auto,descending)):limit(20)):limit(100):names"
      ]
    },
    {
      "name": "Redo Queue Size (KB)",
      "tileType": "DATA_EXPLORER",
      "configured": true,
      "bounds": {
        "top": 228,
        "left": 0,
        "width": 836,
        "height": 266
      },
      "tileFilter": {},
      "isAutoRefreshDisabled": false,
      "customName": "Data explorer results",
      "queries": [
        {
          "id": "A",
          "metric": "ext:custom.jmx.AzureDatabases.metric_ReadOnlyRedoQueueSizeInKB",
          "spaceAggregation": "AUTO",
          "timeAggregation": "DEFAULT",
          "splitBy": [],
          "sortBy": "DESC",
          "sortByDimension": "",
          "filterBy": {
            "nestedFilters": [],
            "criteria": []
          },
          "limit": 20,
          "rate": "NONE",
          "enabled": true
        }
      ],
      "visualConfig": {
        "type": "GRAPH_CHART",
        "global": {},
        "rules": [
          {
            "matcher": "A:",
            "properties": {
              "color": "DEFAULT"
            },
            "seriesOverrides": []
          }
        ],
        "axes": {
          "xAxis": {
            "displayName": "",
            "visible": true
          },
          "yAxes": [
            {
              "displayName": "",
              "visible": true,
              "min": "AUTO",
              "max": "AUTO",
              "position": "LEFT",
              "queryIds": [
                "A"
              ],
              "defaultAxis": true
            }
          ]
        },
        "heatmapSettings": {
          "yAxis": "VALUE",
          "showLabels": false
        },
        "singleValueSettings": {
          "showTrend": true,
          "showSparkLine": true,
          "linkTileColorToThreshold": true
        },
        "thresholds": [
          {
            "axisTarget": "LEFT",
            "rules": [
              {
                "color": "#7dc540"
              },
              {
                "color": "#f5d30f"
              },
              {
                "color": "#dc172a"
              }
            ],
            "visible": true
          }
        ],
        "tableSettings": {
          "hiddenColumns": []
        },
        "graphChartSettings": {
          "connectNulls": false
        },
        "honeycombSettings": {
          "showHive": true,
          "showLegend": true,
          "showLabels": false
        }
      },
      "queriesSettings": {
        "resolution": ""
      },
      "metricExpressions": [
        "resolution=null&(ext:custom.jmx.AzureDatabases.metric_ReadOnlyRedoQueueSizeInKB:splitBy():sort(value(auto,descending)):limit(20)):limit(100):names"
      ]
    }
  ]
}
Rating: 0 / 5 (0 votes)


