Inspired by Devtoberfest 2021 – congrats to the organizers for their great work! – I wanted to get familiar with SAP Business Technology Platform (BTP) and SAP Business Application Studio (BAS) by implementing a practical example.
SAP BTP is the platform for the entire SAP ecosystem for both cloud and hybrid environments, and can be considered the successor of SAP Cloud Platform (SCP).
SAP BAS is a development environment available on SAP BTP, and it is considered the evolution of SAP Web IDE.
And the practical example will be how to implement data persistence in HANA using flowgraphs.
A possible use case for data persistence is when we have to take daily or monthly snapshots for historical reports. As we will see, a flowgraph is an excellent operator to achieve this.
To implement this functionality, we will create an SAP HANA Native Application using SAP BTP and SAP BAS.
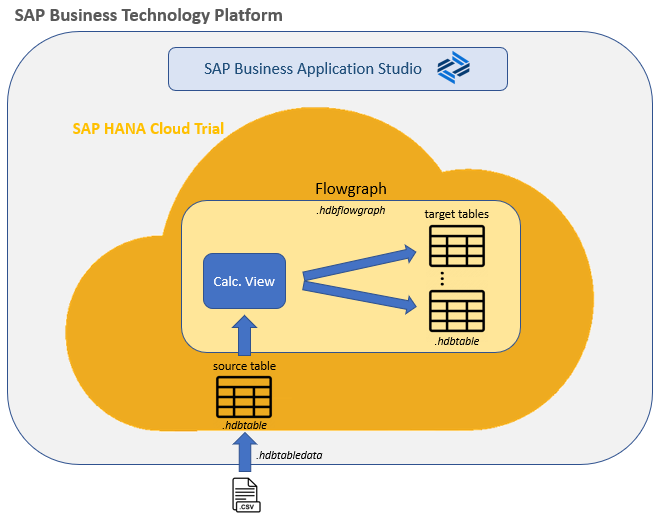
This application will be very simple. In the absence of an ERP system, we will use a file load as a data source. Then we will load this data from a calculation view to several target tables by using a flowgraph, as shown in the diagram below:
This blogpost is divided in three parts:
- Set up SAP BTP trial and BAS
- Create the data model
- Create and run the flowgraph
Remember you can find more information on developers.sap.com, the central access to free tutorials, trials, downloads and technical production information:
- Part 1: Set Up Your SAP HANA Cloud, SAP HANA Database Trial and Understand the Basics link, Set Up an SAP BTP Account for Tutorials link, Configure Essential Web-Based Development Tools link
- Part 2: Create a Database Multi-Target Application with SAP HANA service for SAP BTP link, Create Database Artifacts in SAP HANA Cloud link
- Part 3: Create a Flow Graph to Replicate Data link, Get Started with the SAP HANA Database Explorer link

Step 1.1. Start with the free tier model for SAP BTP by clicking the Sign-up button.
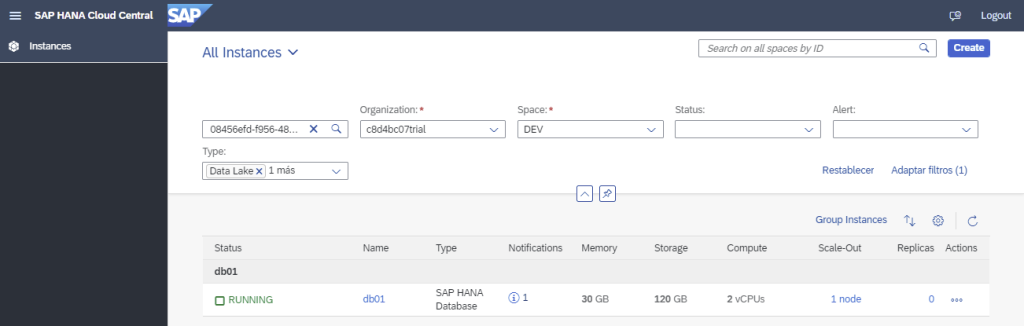
Step 1.2. Once the subaccount is created, create a space and an SAP HANA database instance:
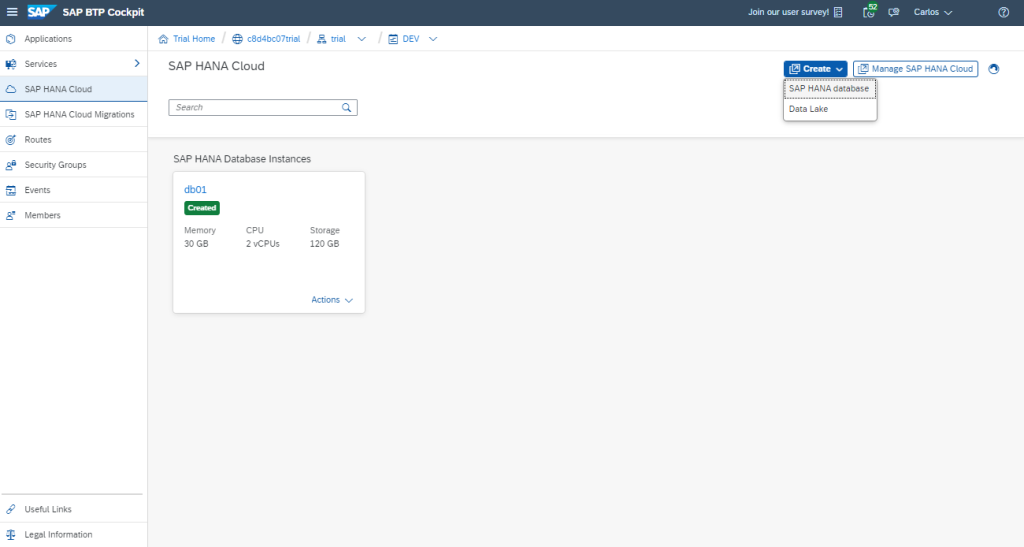
Remember that it has to be always Running:
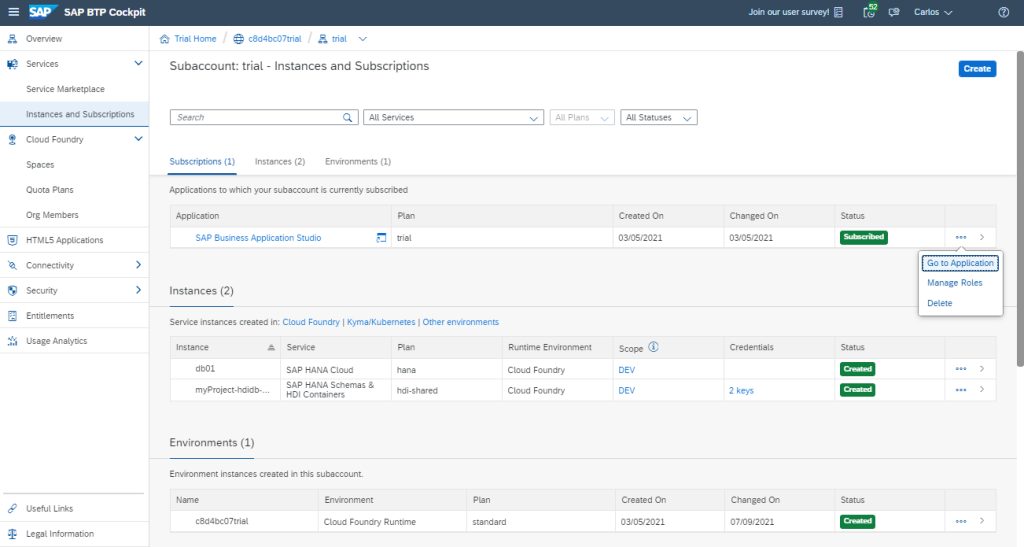
Step 1.3. Open SAP BAS from Subaccount: trial –> Services –> Instances and Subscriptions:
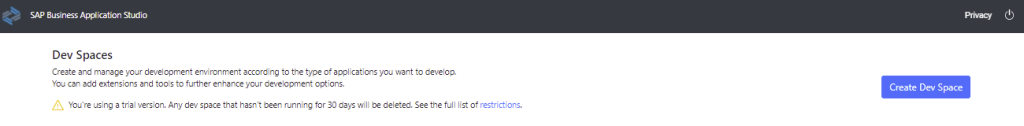
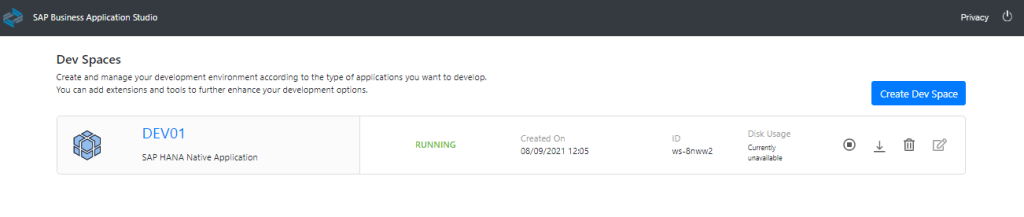
Step 1.4. Create a Dev Space in SAP BAS. It will be a development environment with all the tools, capabilities and resources needed for developing our application:
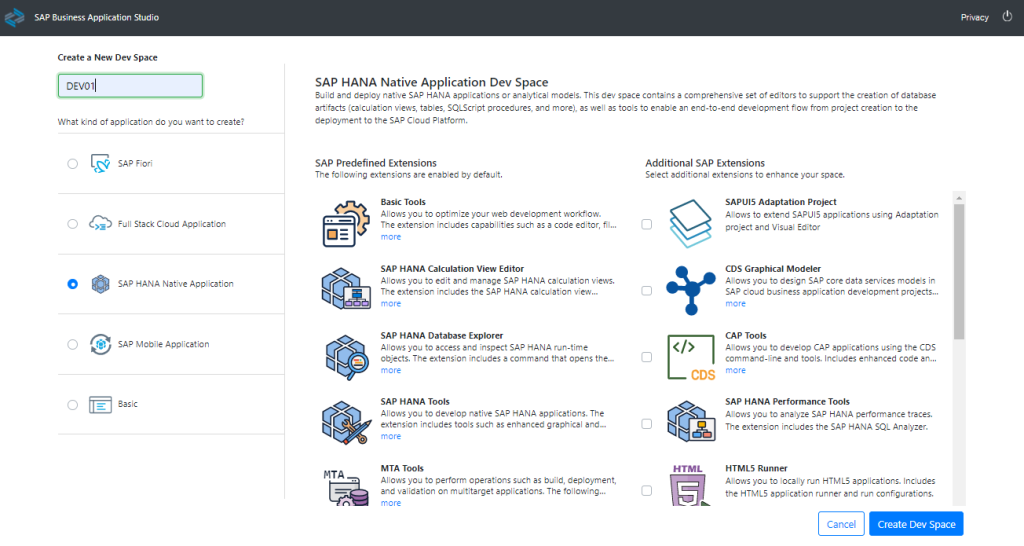
Select SAP HANA Native application and click on Create Dev Space:
Remember that the Dev Space has to be always Running:

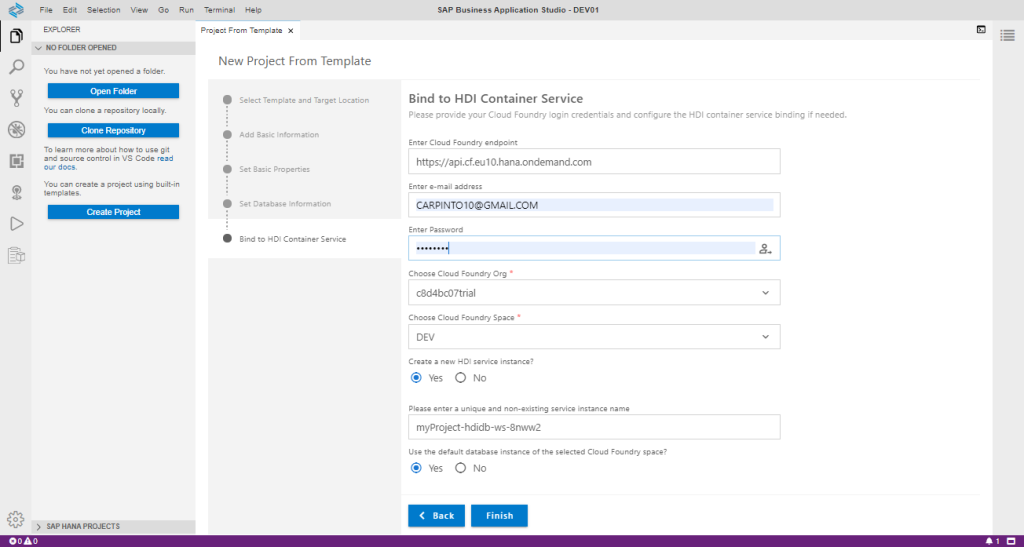
Step 2.1. Create an SAP HANA database Project:
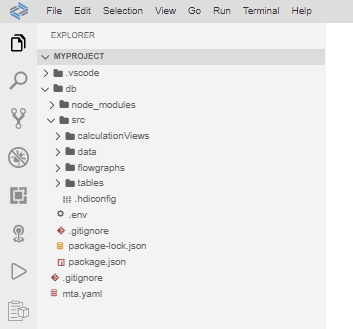
Step 2.2. Create folders for the calculation views, the data, the flowgraphs and the tables (right click on the ‘src’ folder, and click on New Folder).
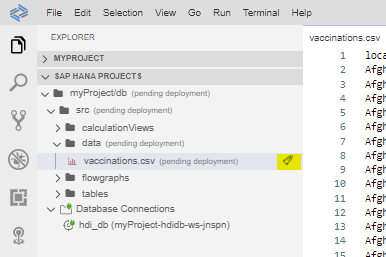
Step 2.3. Upload a CSV file to the ‘data’ folder (right click on the ‘data’ folder, and click on Upload Files…).
For this exercise, I have used data on COVID-19 vaccination in the EU/EEA. The dataset can be downloaded on this link (source: Our World In Data).
Always remember to deploy your objects or folders after any change:
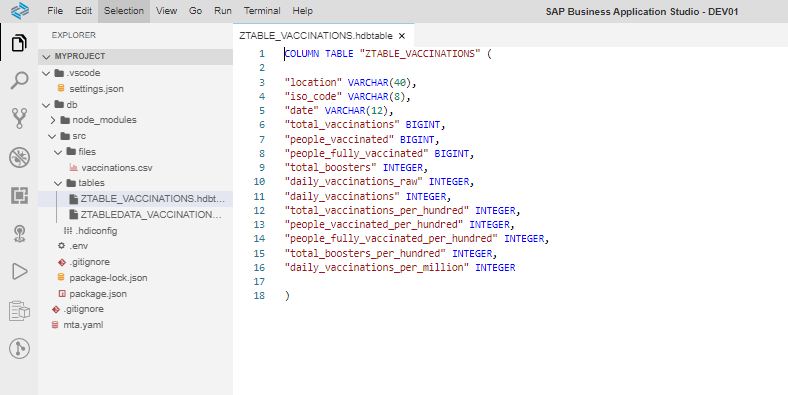
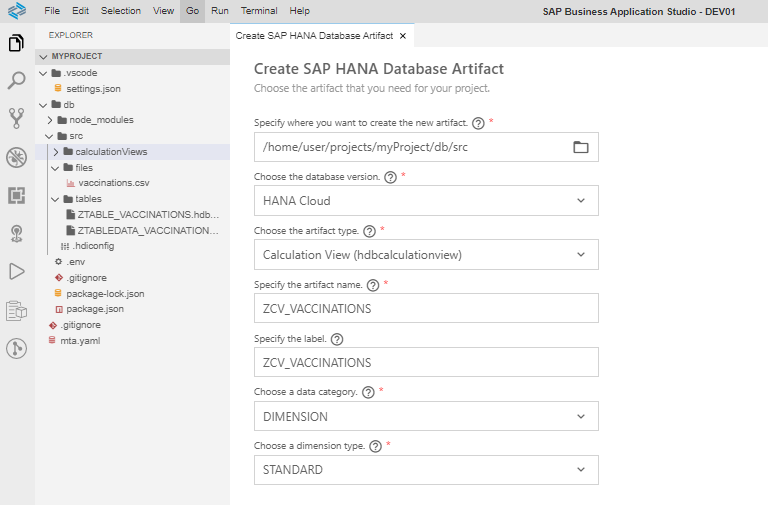
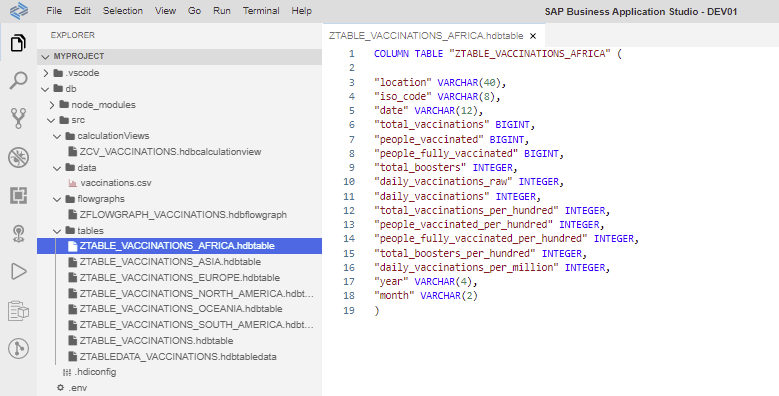
Step 2.4. Create a table in the ‘table’ folder, with the same structure than the file: View –> Find command –> Create SAP HANA Database Artifact.
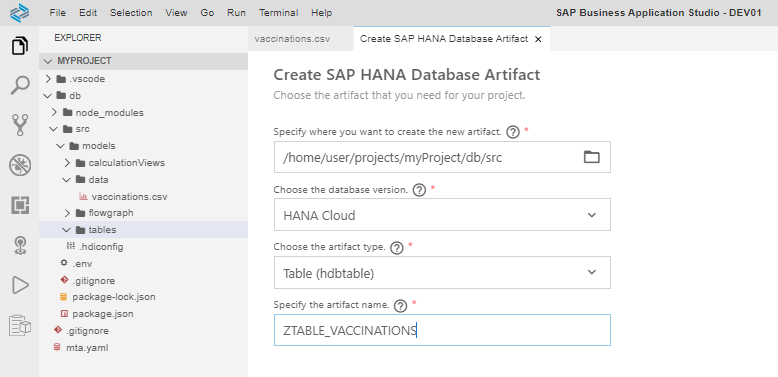
This will be the source table:
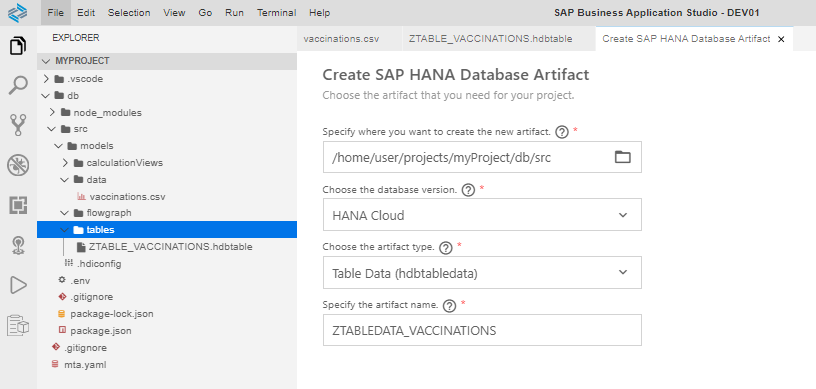
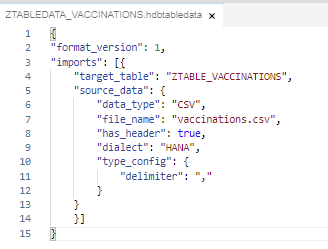
Step 2.5. Insert the data from the CSV file into the table by creating and deploying a Table Data artifact (.hdbtabledata): View –> Find command –> Create SAP HANA Database Artifact.
The code looks as follow:
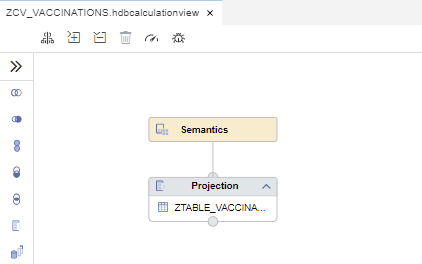
Step 2.6. Create a calculation view of type Dimension on top of the table: View –> Find command –> Create SAP HANA Database Artifact:
Add the source table created in the step 2.4 as a datasource:
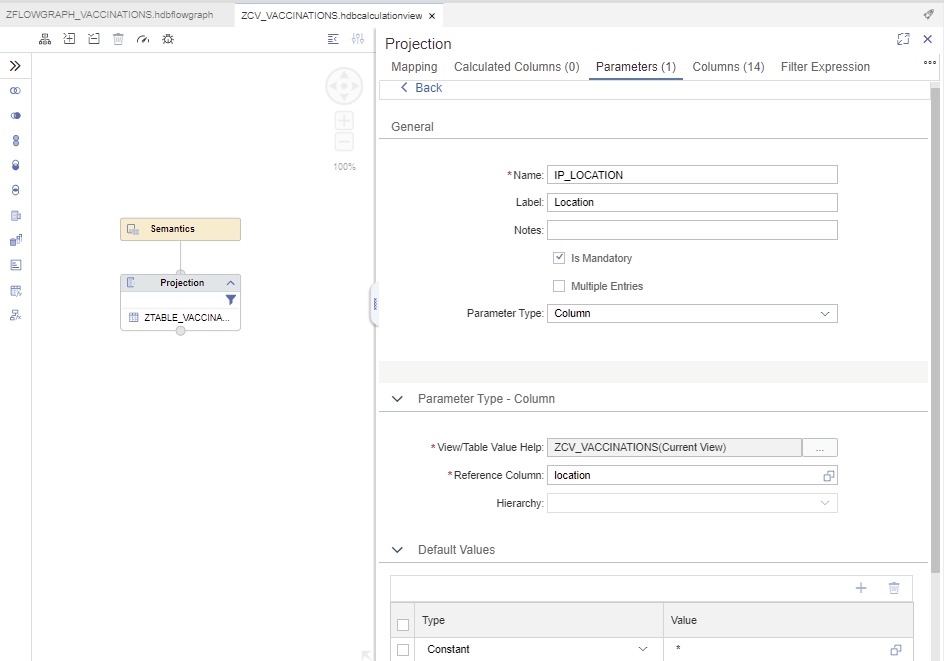
Create a Parameter of type Column (e.g., location):
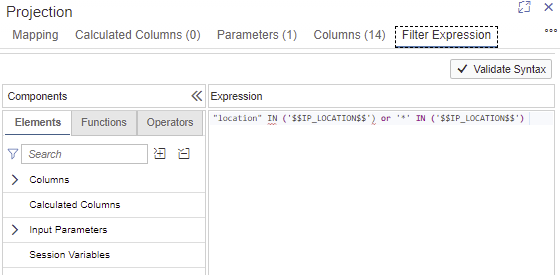
Finally define the filter expression in the Projection node:
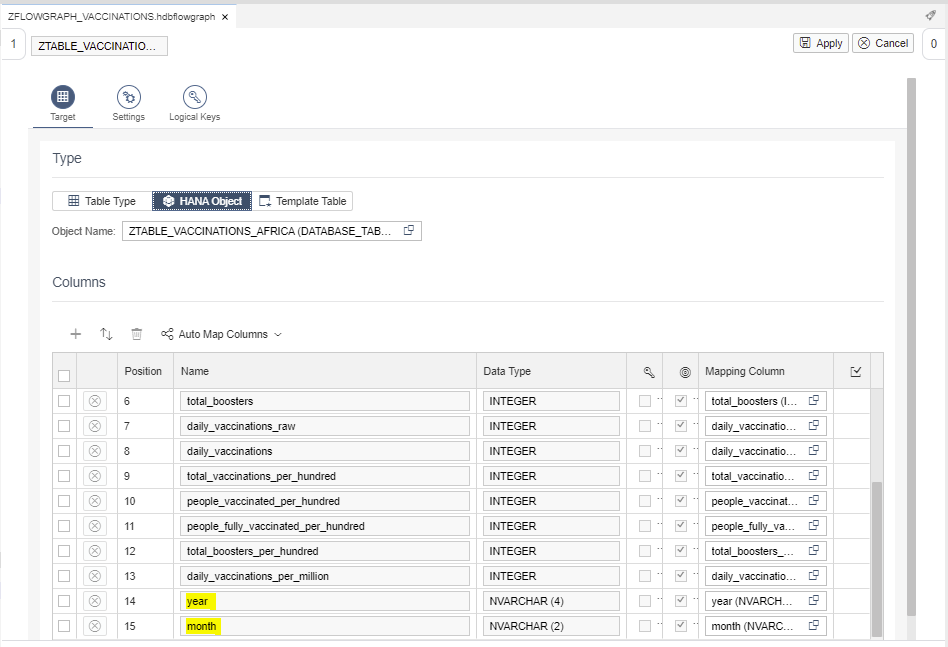
Step 2.7. Create six tables in the ‘table’ folder, with the same structure than the file: View –> Find command –> Create SAP HANA Database Artifact.
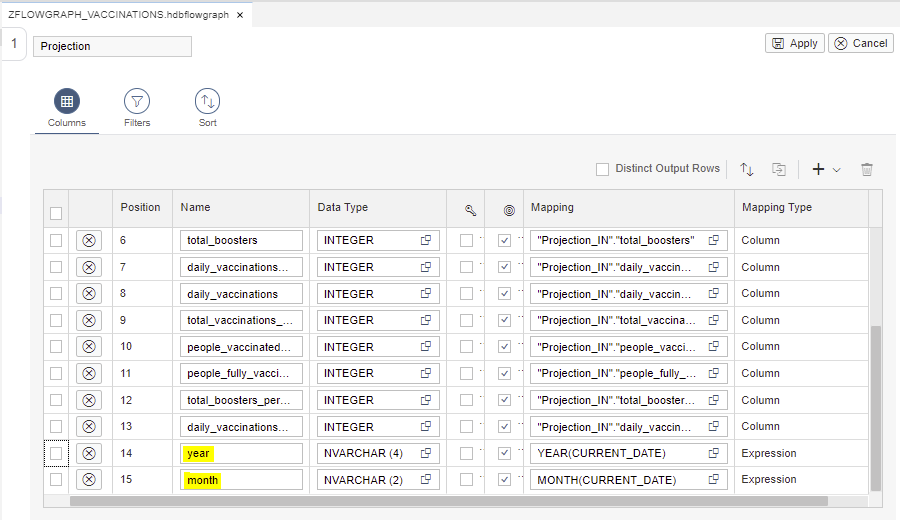
Also, we will add two new fields: year and month.
These tables will be the target tables.

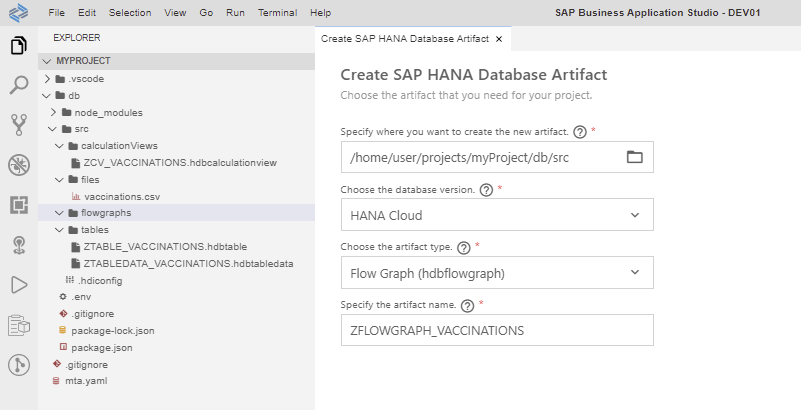
Step 3.1. Create a flowgraph to insert the data from the source table into the target tables: View –> Find command –> Create SAP HANA Database Artifact.
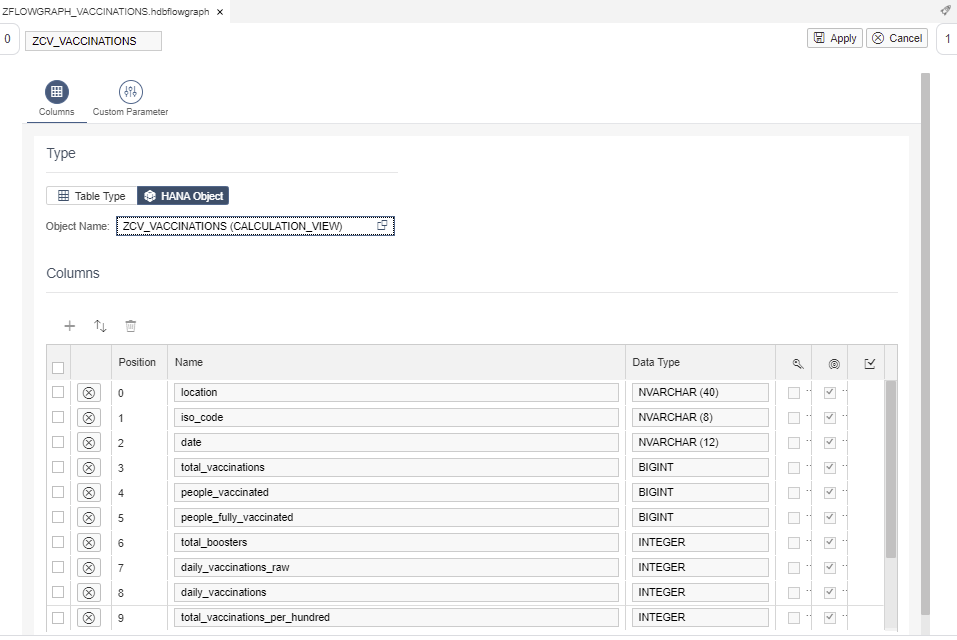
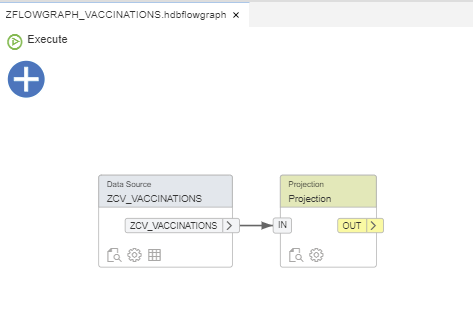
Step 3.2. Add a Data Source node and select the calculation view as HANA object:
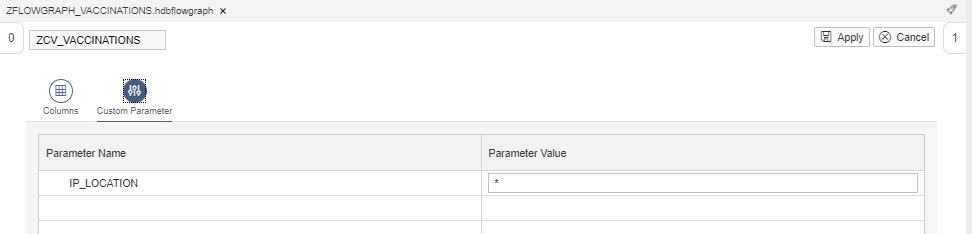
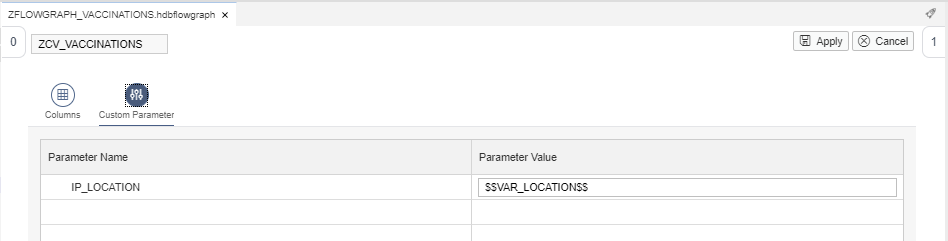
As shown below, the Parameter of the calculation view appears as Custom Parameter of the flowgraph:
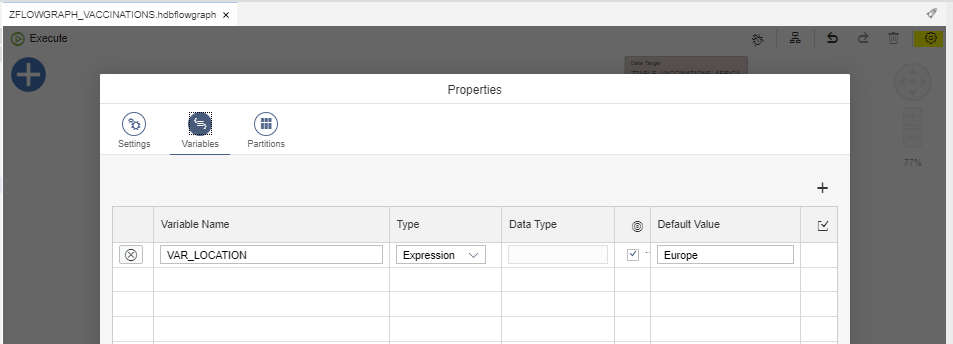
To pass the parameter dynamically from the flowgraph to the calculation view, we need to define a Variable in the flowgraph Properties:
And put this variable (between double dollar signs) as Parameter Value in the Data Source node:
Step 3.3. Add a Projection node and link it with the Data Source node:
For this example, we will create a filter by date (e.g., “date” > ‘20210101’):
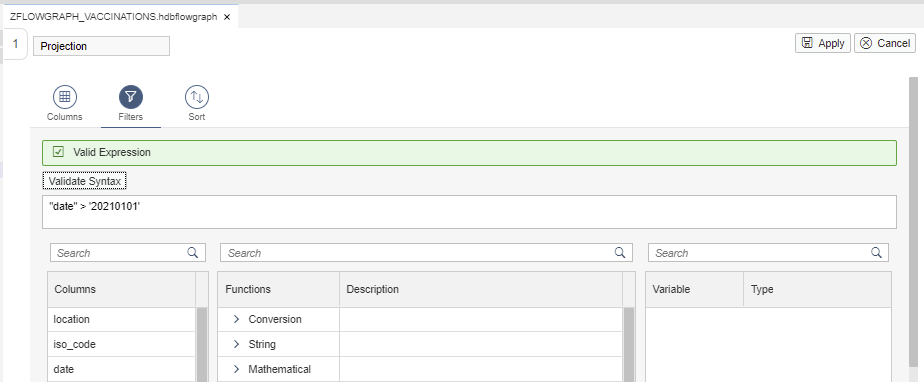
Also, we will create two new columns, year and month, using the Date Functions: YEAR(), MONTH() and CURRENT_DATE.
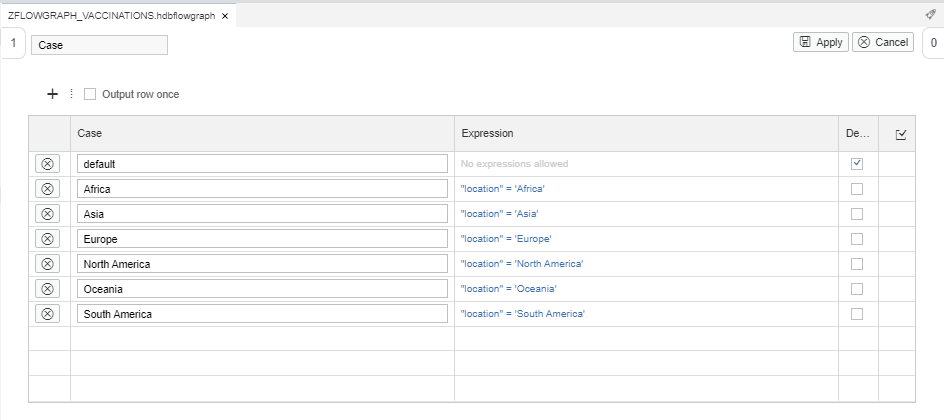
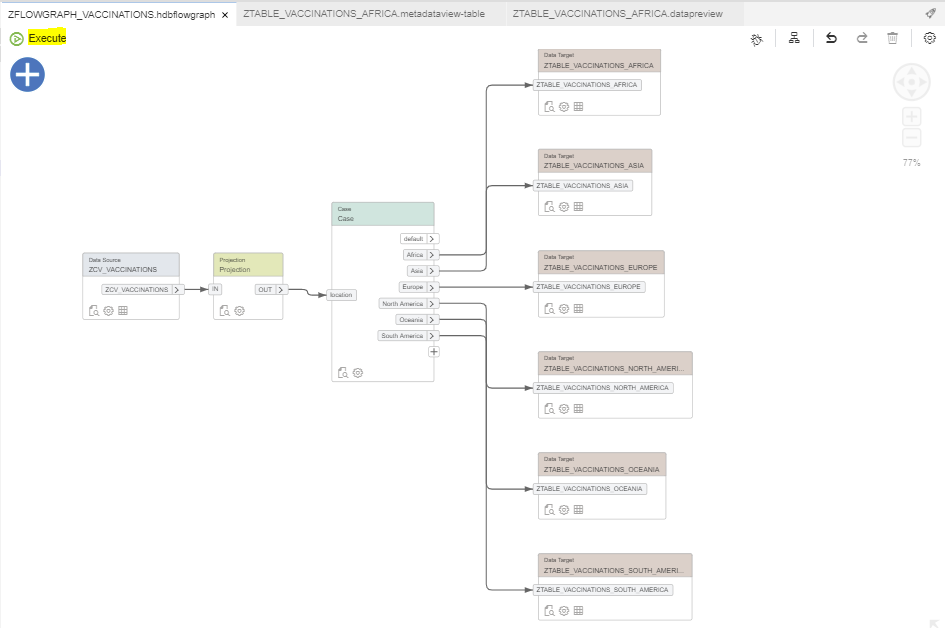
Step 3.4. Add a Case node and link it with the Projection node:
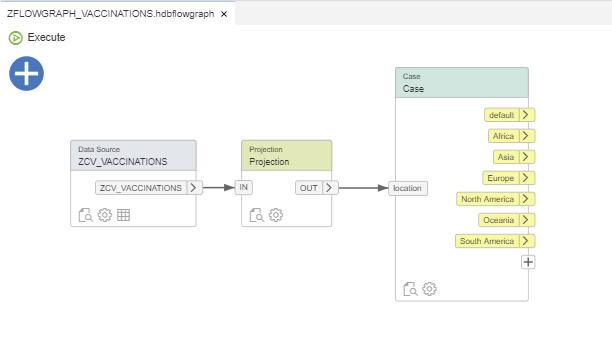
We will do a split by location, so we will create a case for each target table with its corresponding expression:
Step 3.5. Add six Data Target nodes, one for each target table, and link them to the corresponding port of the Case node:
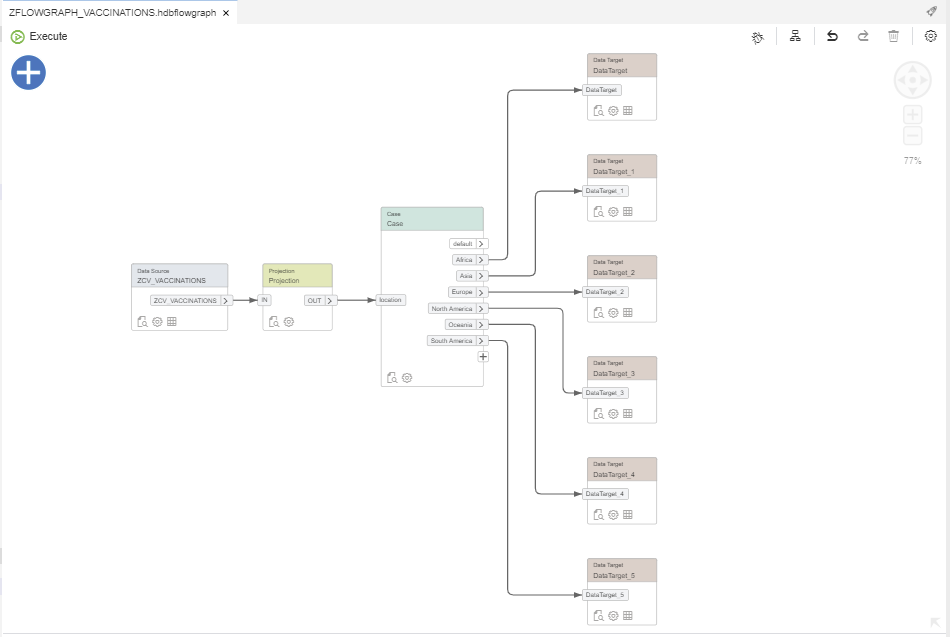
For each Data Target node, select the corresponding target table as HANA object. As you can see, the columns are automatically mapped:
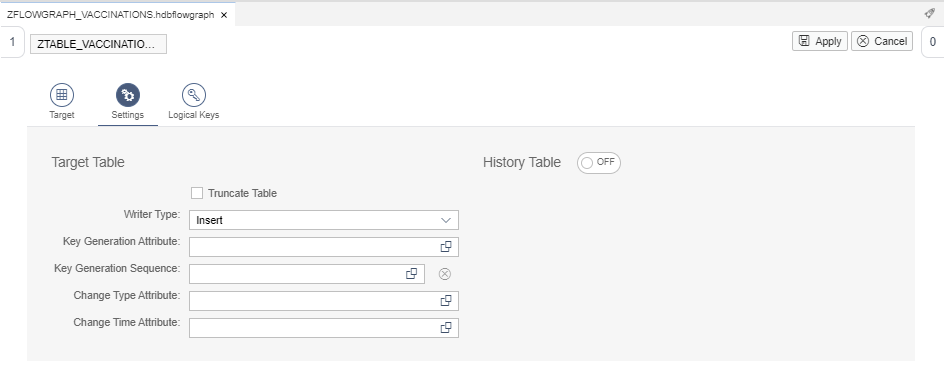
In Settings tab, based on the requirements, we can choose between three different Writer Types: Insert, Update and Upsert (a combination of both). For this example, we will use Insert:
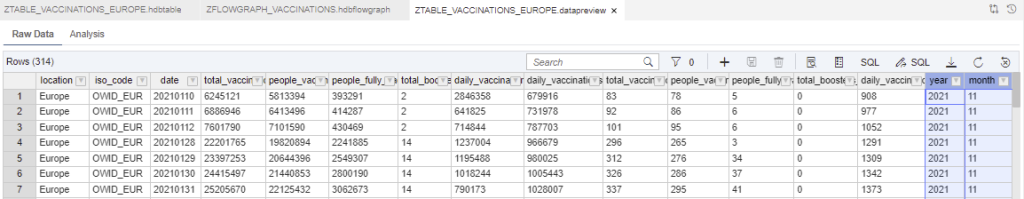
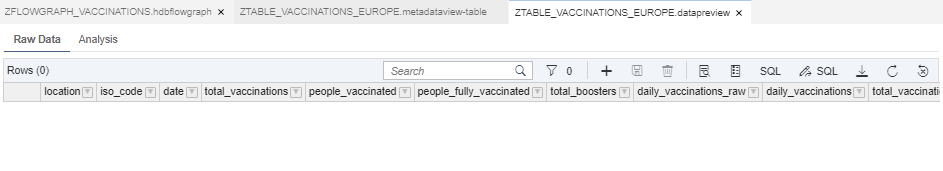
If we do the data preview of the data target (preview –> Open Data), in this case the target table for Europe, we will check that the table is empty:
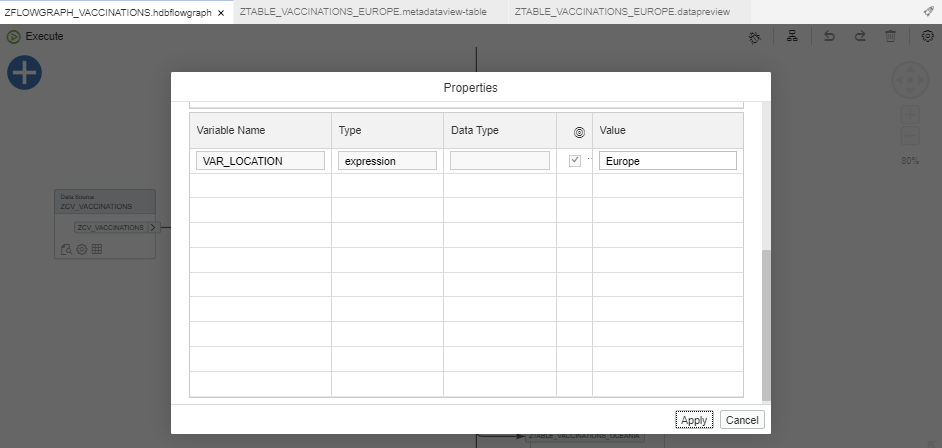
Step 3.6. Run the flowgraph:
Enter the Variable Value (e.g., Europe):
In the output, you can see that the flowgraph has been executed successfully:

If you refresh the data preview of the data target, you will check that the table for Europe is now loaded:
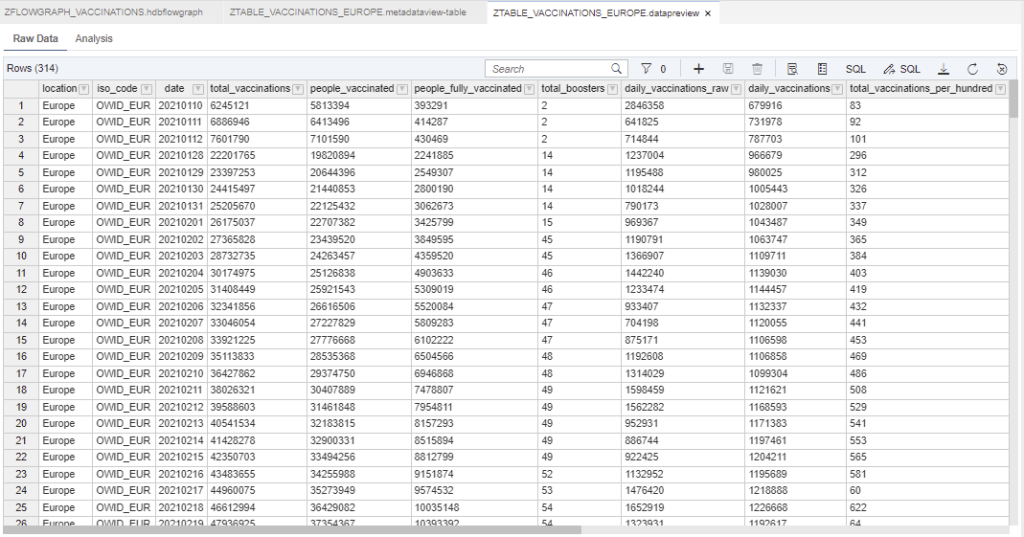
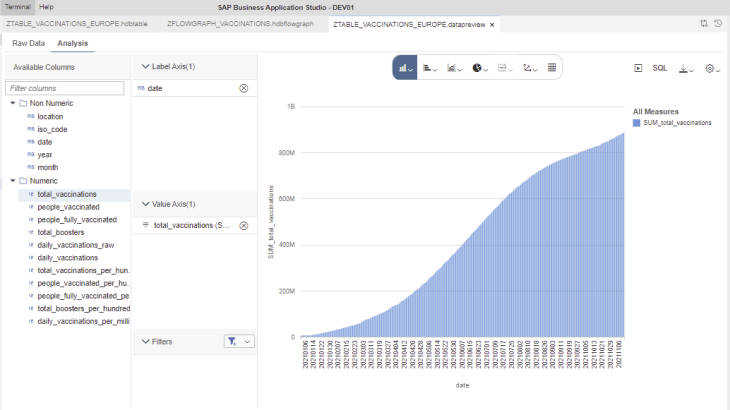
This would be a quick analysis of the Total of Vaccinations in Europe by date:

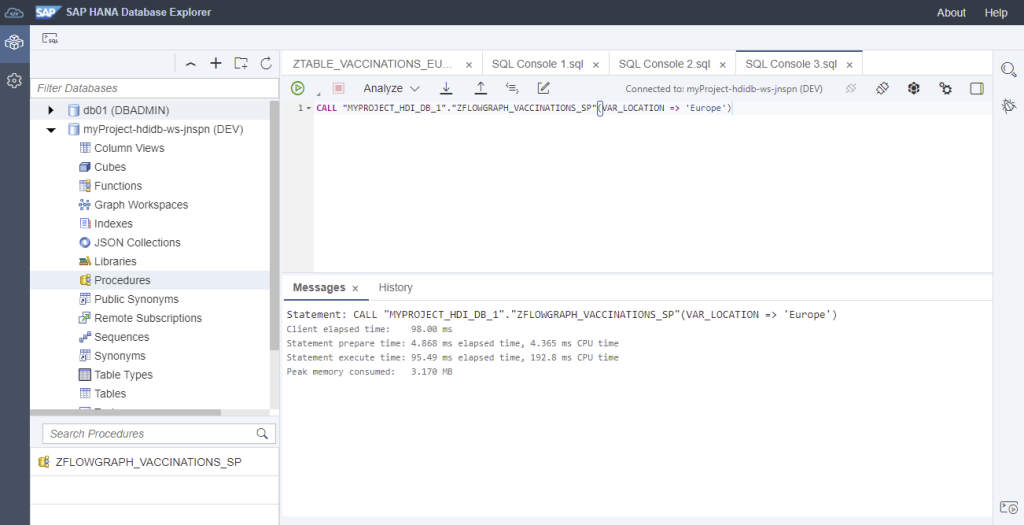
Remember that you can also execute the flowgraph by generating the CALL statement and running it from the Database Explorer:
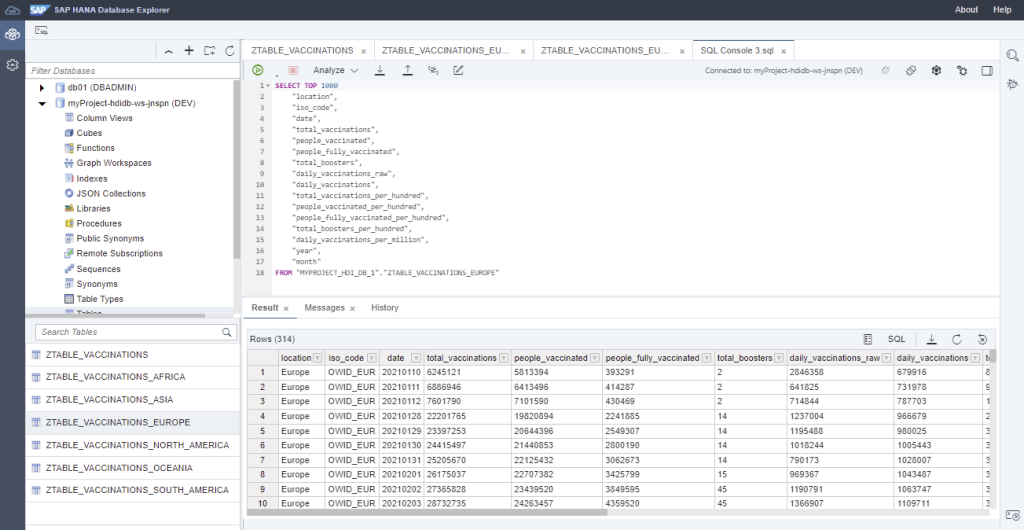
And view or delete the data of the tables by generating or writing manually SQL statements:
Also, you can call the flowgraph from a procedure by using a START TASK statement.
Conclusion
As mentioned in the introduction, a possible use case for these flowgraphs can be taking snapshots to know what the situation of the data was at a certain moment.
Note that when the flowgraph was executed, the year and month were filled in with the year and month of the execution moment.
If the flowgraph is scheduled on the last day of the month, we would be taking monthly snapshots, which we could use for example for historical reports.