
Abstract
In SAP MDG on S/4HANA 2020, a new process analytics framework is delivered: change request analytics by master data attributes. With it, you can provide analytics capability to enable your master data specialists to get real time insights into change request processes by master data attributes and organizations.
With this analytics capability, you can monitor open and completed change requests for your master data by attributes and organizations, and identify and fix process gaps, bottlenecks, and errors.
You can also get process transparency for different master data dimensions and analyze and compare process efficiency, answering the following questions: How fast are different processes executed, and is performance improving or decreasing among different master data dimensions?
Framework Highlights:
- Easy-to-use configuration to meet various business needs
- Integrated authorization control on master data and segmentation
- Enabled for SAP delivered models and custom data models
- Enablement of most analytics tools with standard analytics annotations, e.g. S/4 Smart Business, SAP Analytics Cloud
This blog will guide you through the process analytics configuration by using this framework together with SAP S/4HANA Smart Business.
Overview
Before getting into the details, here is an explanation of the targeting solution architecture and an overview of the steps.
The solution is based on analytics CDS views which is a widely used technology in S/4 analytics. The main purpose of the framework is to support you in generating such analytics CDS views for your data model entity type. Based on the analytics CDS views, various analytics tools e.g. Smart Business Generic Drilldown reports, Web Query, Analytics Path Framework, SAP Analytics Cloud etc., can be used as a UI layer.
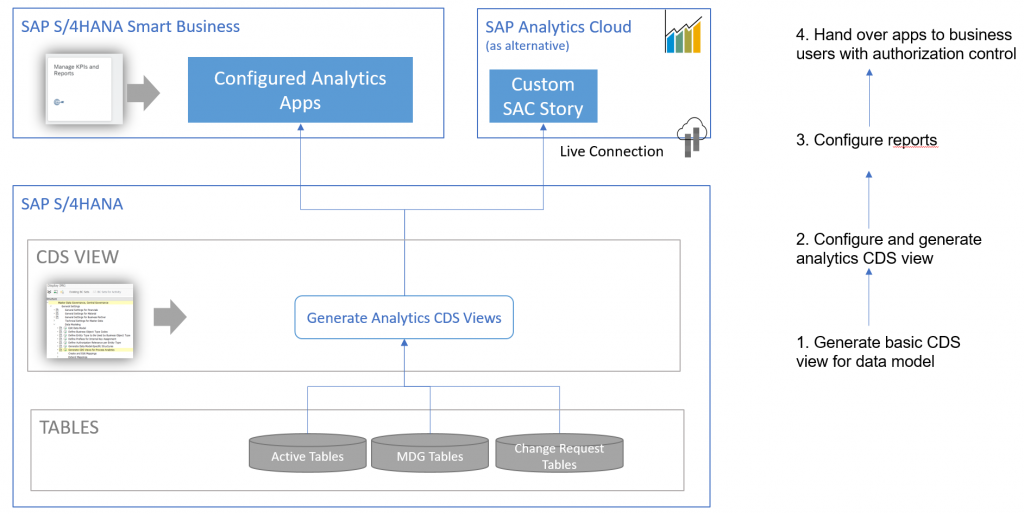
Follow these steps to start your configuration:
- Generate basic CDS view for data model
- Configure and generate analytics CDS views
- Configure analytics report
- Configure role and authorization control
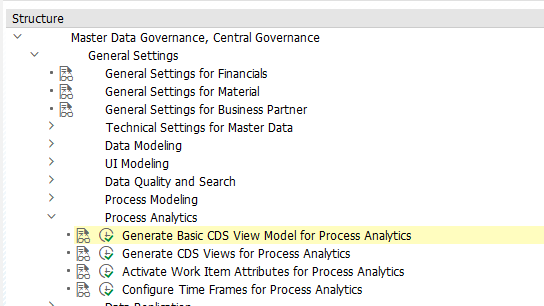
1. Generate Basic CDS views
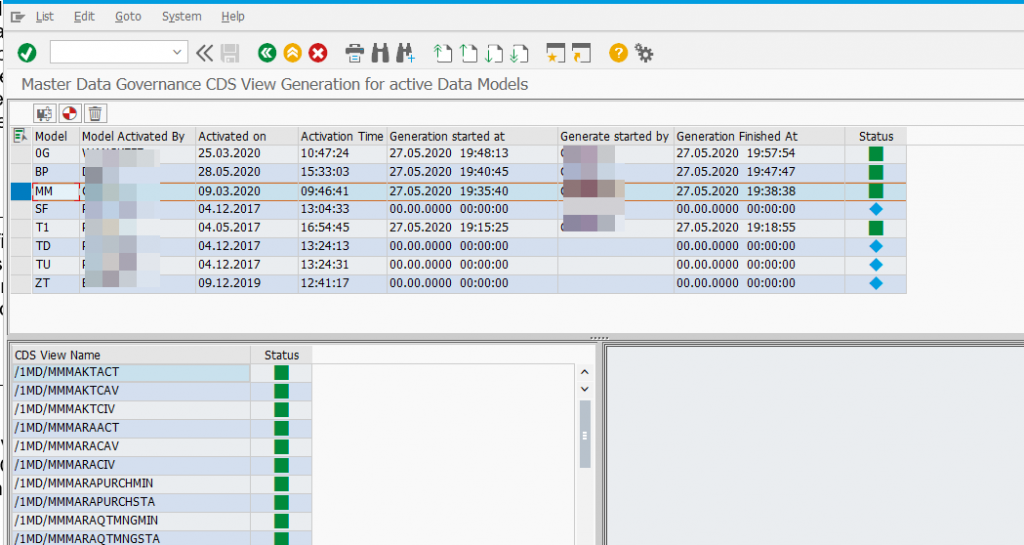
Before we create analytics CDS views, you need to generate basic CDS views for the data model. You need to execute this step once, before you configure and generate any analytics CDS views.
Note: Regardless of whether you’re in a Dev, Test or Production system, the MDG data model must be activated individually. Therefore, your configured CDS view also needs to be individually generated in each system.
Note: If you have added new attributes to the data model after basic CDS views generation, please regenerate the Basic CDS view again.
Go to transaction MDGIMG, General Setting >> Process Analytics à Generate Basic CDS Views for Process Analytics.
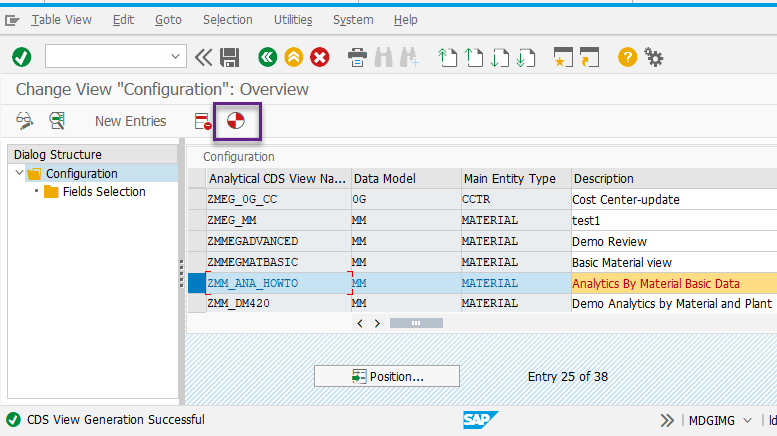
2. Generate Analytics CDS Views
Now, you are ready to configure the core artifact for your analytics report with just a few clicks.
Go to transaction MDGIMG, Process Analytics >> Generate CDS Views for Process Analytics.
Choose a name, a data model, and a main entity type for your data analytics query and enter a local package to store the generated CDS views.
On the second level, choose attributes in Field Selection that you would like to use to drill down the master data (e.g. Product, Business Partner, G/L Account etc.) and further analyze the change request.
Note: In the analytics report, it always shows the final value of the master data, no matter which intermediate values have been processed by the change request.
Note: Regardless of whether you’re in a Dev, Test or Production system, the MDG data model must be activated individually. Therefore, your configured CDS view also needs to be individually generated in each system.
Note: Reducing the number of attributes and entity types under one analytics CDS view may increase performance. As a general recommendation, use only 1 or 2 entity types.
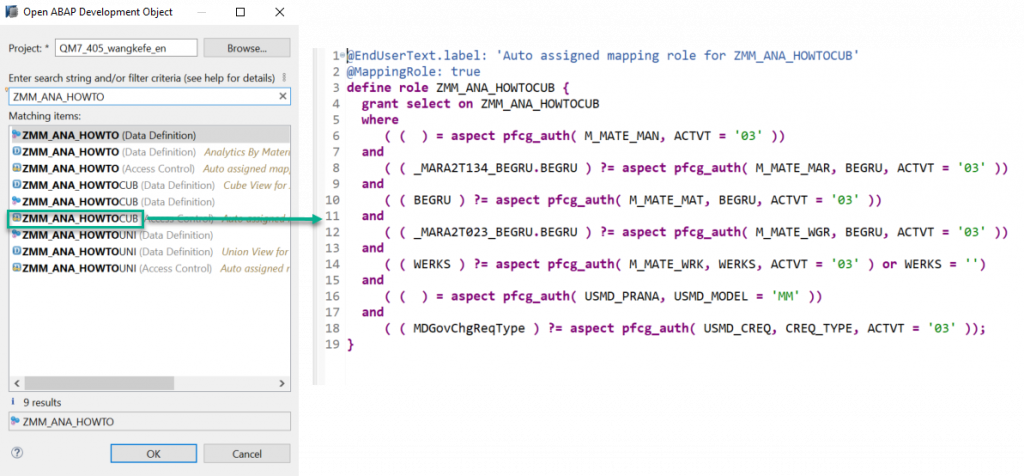
Once you get the success message, you should be able to check the CDS view in ABAP Development Tool or SE11.
Here you can also see the Access Control DCL is generated, which will allow only the authorized user to access the data used in an analytics report.
3. Configure Analytics Report
Based on the analytics CDS views, various analytics tools are supported here to create and configure the reporting UI. Here we use SAP Smart Business Generic Drilldown reports to create one Fiori application for the end user.
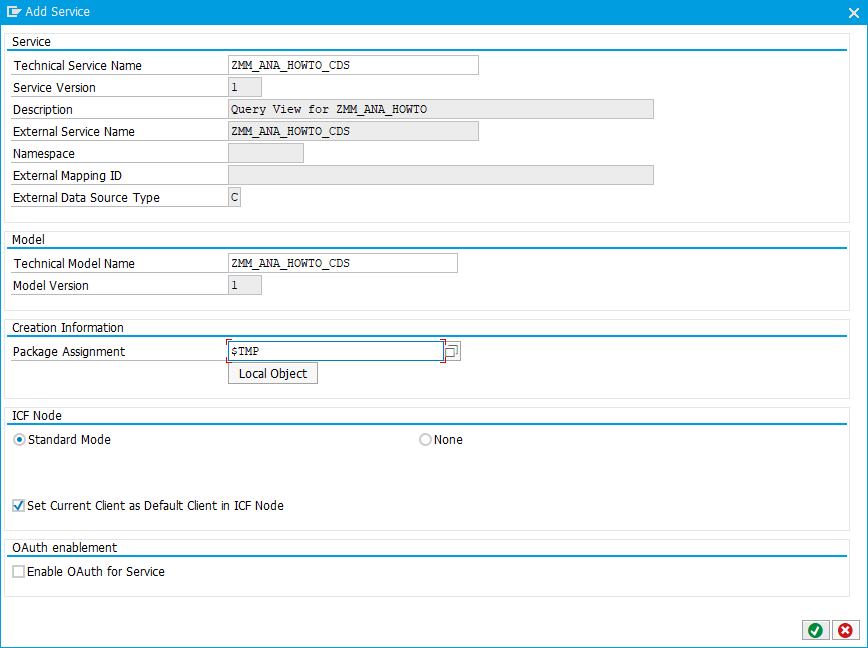
3.1 Preparation: Activate the CDS View oData Service
Before Smart Business configuration, you first need to activate the oData service in the transaction /n/IWFND/MAINT_SERVICE.
When you open Add Service, enter a system alias and your CDS view name (with the suffix *) to search your CDS view oData service.
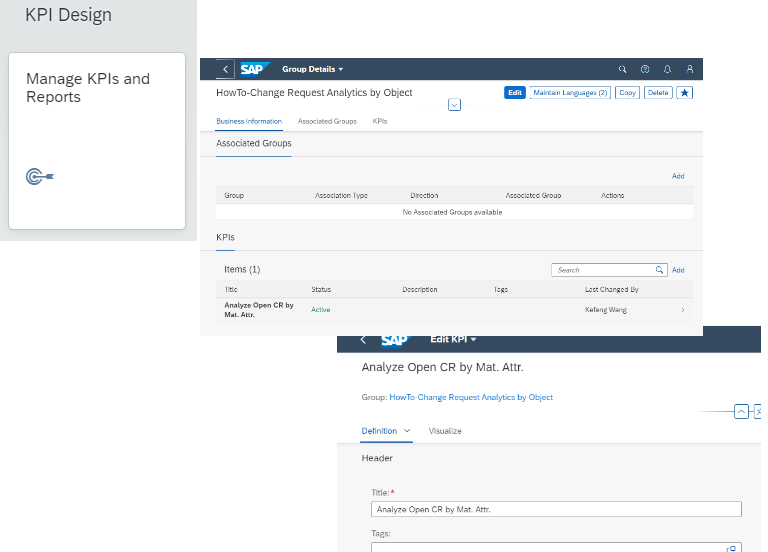
3.2 Create KPI
In the KPI design app Manage KPIs and Reports (located in the business role SAP_BR_ANALYTICS_SPECIALIST), create a new group or use an existing group if you have one already. You can add multiple KPIs into one group.
Add a new KPI >>Define Data Source: Search your CDS view and select it. The oData Service and Entity Type should be filled automatically. If not, wait some seconds and try again.
Select a Value Measure. The following five measures are provided:
- Number of Change Requests
- Average Change Request Processing Time
- Total Change Request Processing Time
- Average Overdue Days
- Total Overdue Days
You need to select one for now, but you can use all these measures in your report.
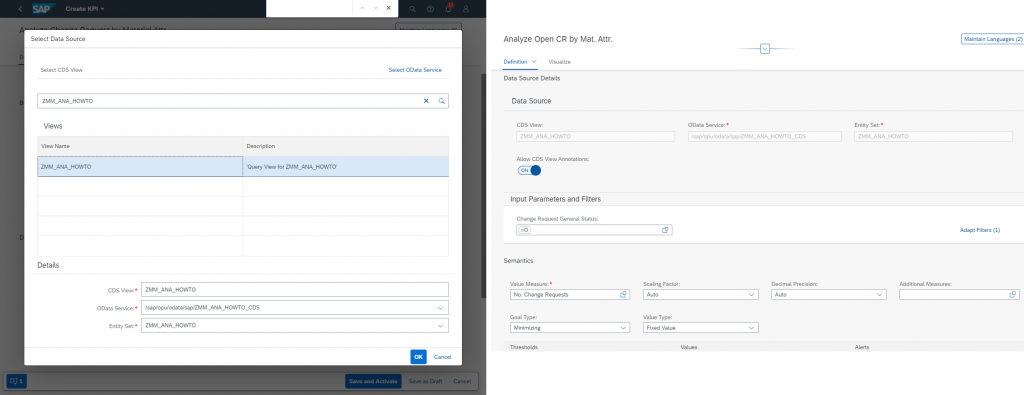
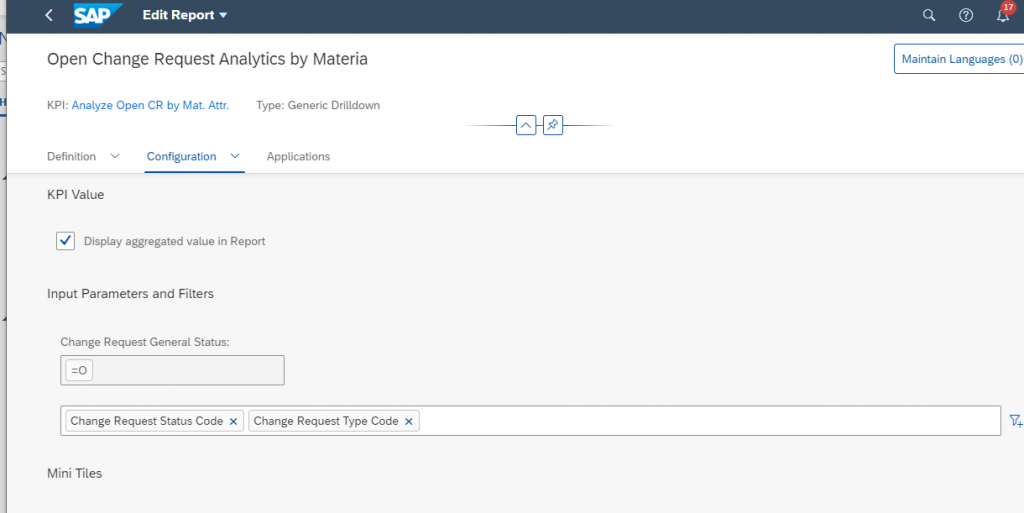
Note: For better performance, during the analytic KPI configuration, it is strongly recommended to use field Change Request General Status or
For better performance, during the analytics report configuration, it is strongly recommended to use the field Change Request General Status or Change Request Status to set the dedicated analytics scenario to either Open Change Request or Completed Change Requests.
to set dedicated analytics scenario either Open Change Request or Completed Change Requests
3.3 Create Generic Drilldown Report
Create a Drilldown report from the KPI, then select additional default filters for the app, such as Change Request Status and Change Request Type.
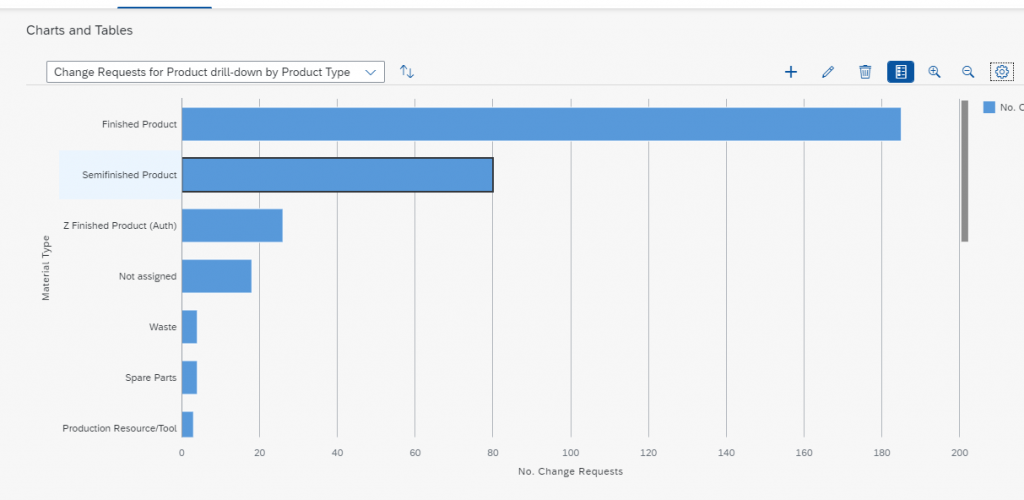
Then, add the charts by selecting the available attributes from the analytics CDS view, which are the core of analytics functions for your end user.
e.g. Change Requests for Product Drilldown by Product Type
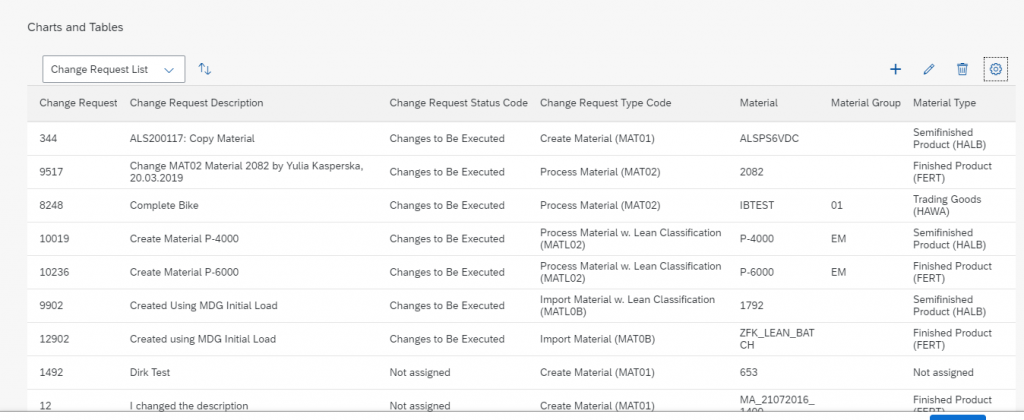
Add a view of type Table to list the selected change request and configure the fields you want to display in the list.
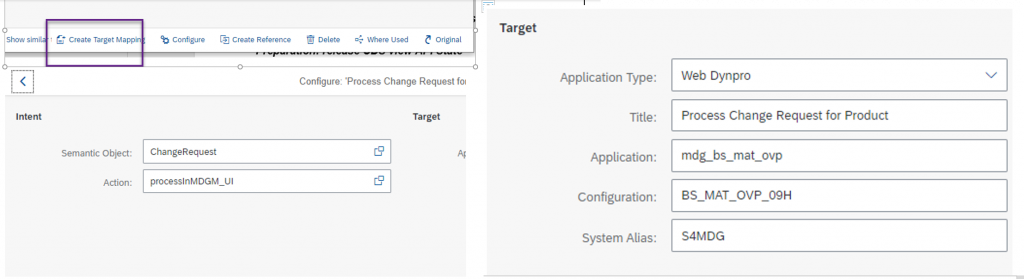
If you want the possibility to navigate to the change request UI from this table, you can add Navigation Intents (with semantic object action) in the report, as shown in the following screenshot:
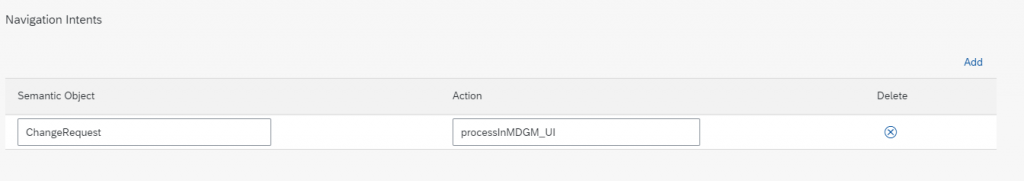
Note: The navigation needs to be created as target mapping in your Fiori catalog (if you don’t know how to do it, see the next section, Configure the Role). Here is an example:
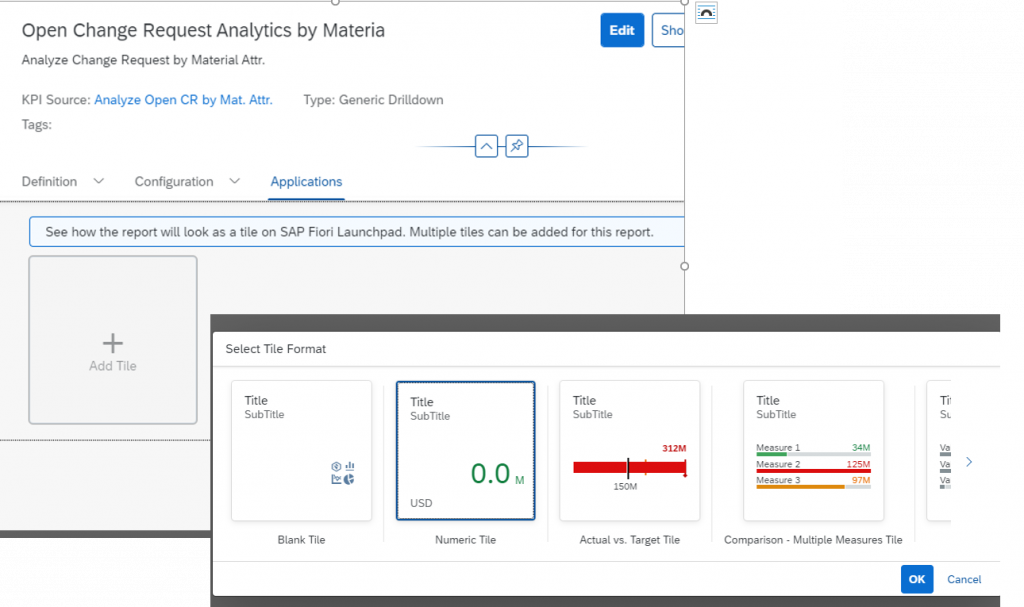
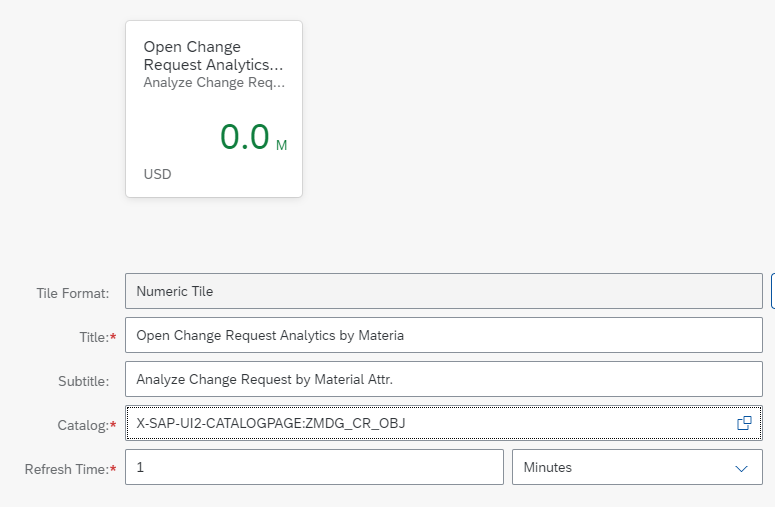
3.4 Create a Tile and Assign It to the Catalog
From your report, select Add Tile. When you select Numeric Tile, you can also configure how often you want the tile number refreshed automatically for the end user.
If you don’t have a catalog yet, you can easily create one from transaction /n/UI2/FLPD_CUST.
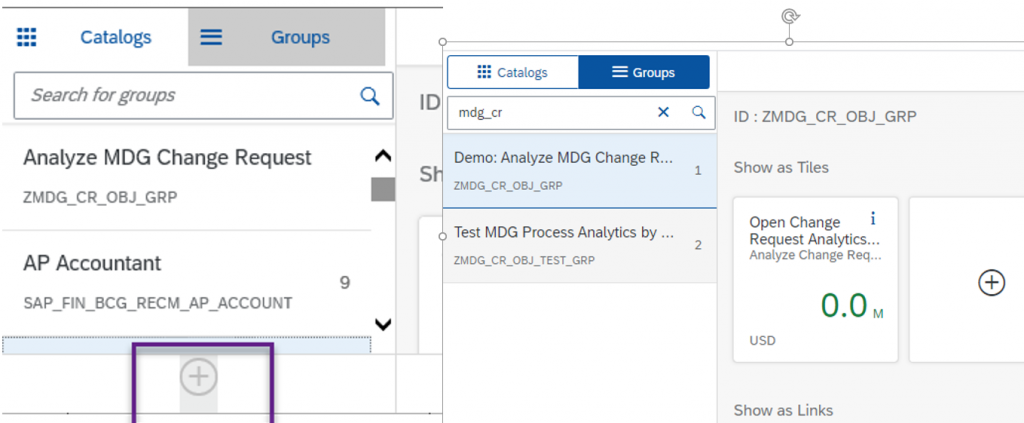
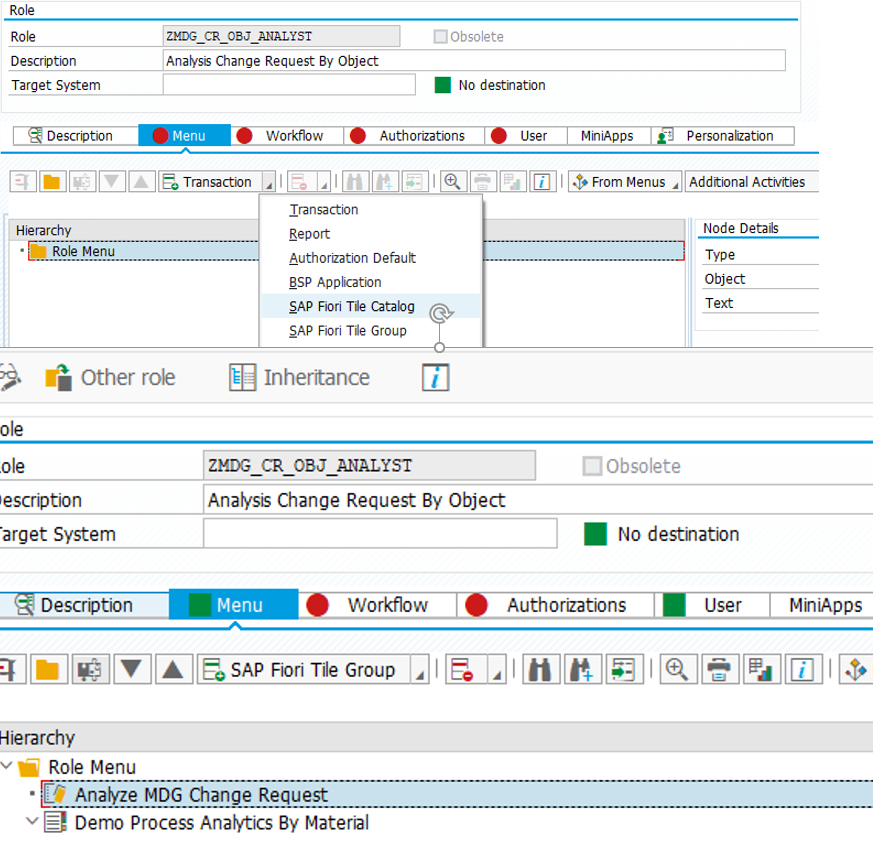
4. Configure Role and Authorization Control
To be able to provide your apps to the end user, you must assign a catalog to a group and assign the catalog and group into a PFCG role.
The PFCG role can then be assigned to your end user, so that your end user will get the app in her/his Fiori launchpad.
In your Fiori system, open transaction /n/UI2/FLPD_CUST, on Groups tab, add a new group
Go to the transaction’s PFCG role or create a new PFCG role if you don’t have one yet.
Add your catalog and group into the menu.
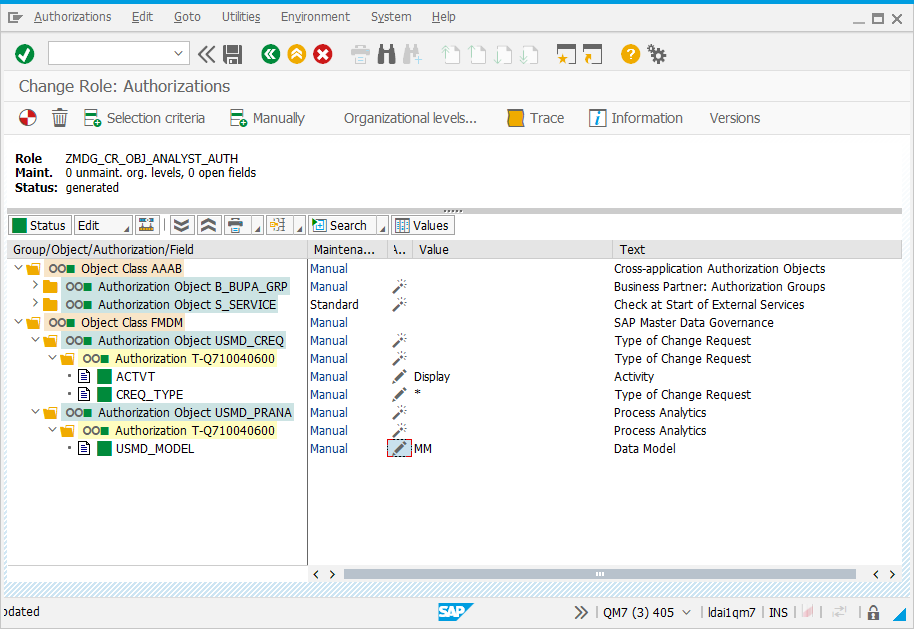
If a new role authorization profile is created, you can also enhance your existing authorization role to include USMD_PRANA with the right data models as parameters.
Then, assign the PFCG role to the end user.


