Abstract
SAP Master Data Governance is a state-of-the-art master data management application.
Data Quality Management in MDG enables you to define master data quality rules, striving for consistent usage across all points of entry and enabling data quality monitoring and remediation.
SAP Analytics Cloudsd (SAC) is a top-tier SaaS solution that combines all your analytics needs, for example, Planning, Predictive, Business Intelligence and more, in one intuitive user interface, saving you time and effort while helping you make better decisions.
From MDG on SAP S/4HANA 2020 and Cloud 2008, two easy-to-use dashboards are delivered for end users, from chief data officer to master data specialist, to get real-time quality abstracts for master data quality as well as history trends:
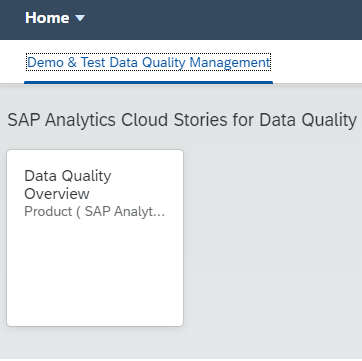
- SAP MDG Data Quality Overview for Products
- SAP MDG Data Quality Overview for Business Partner
These dashboards, with a live data connection to your backend S/4 system, will enable you to monitor data quality score by Category, Dimension and Data Quality Rule. With MDG Data Quality Integration, all details of data quality insight can be explored, as well as how authorization control is integrated.
This blog will guide you on how to use this dashboard with your S/4 system and how to set it up.
SAP MDG Data Quality Overview Dashboard
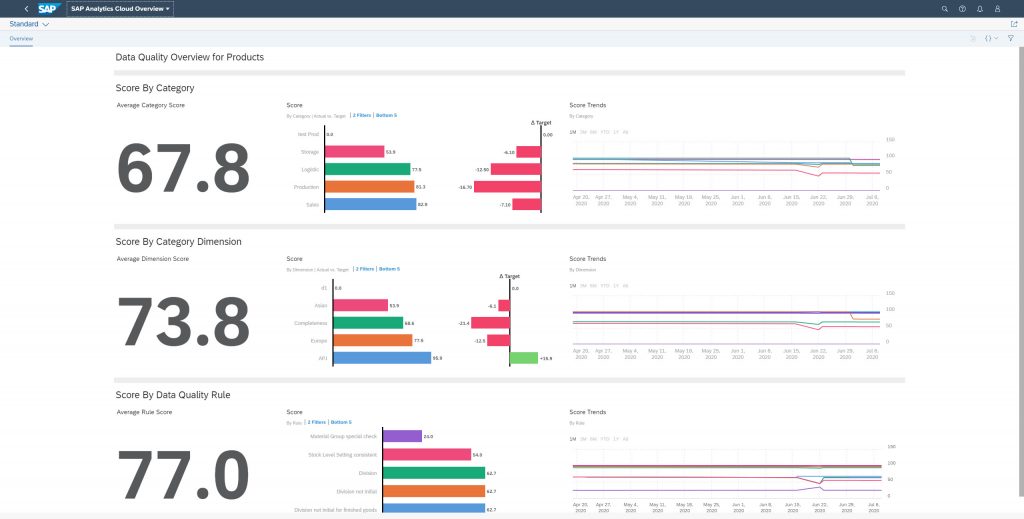
This dashboard overview page contains three levels of information:
- Category is a grouping of dimensions, while Category Score is the average of the scores of the assigned data quality dimensions.
- Dimension is a grouping of rules that assess one aspect of data quality, for example, completeness or correctness. Dimension Score is an aggregation of the scores of the rules assigned underneath.
- Data Quality Rule defines criteria to evaluate data quality. Rule Score indicates the data quality of the evaluated data.
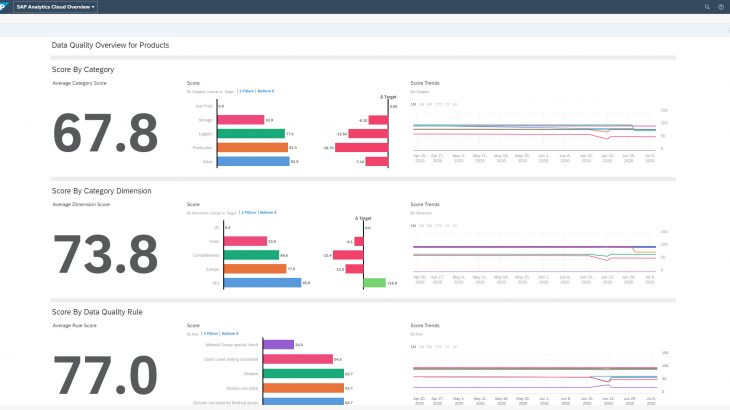
Category Score
The Average Category Score give you the overview quality status of your master data.
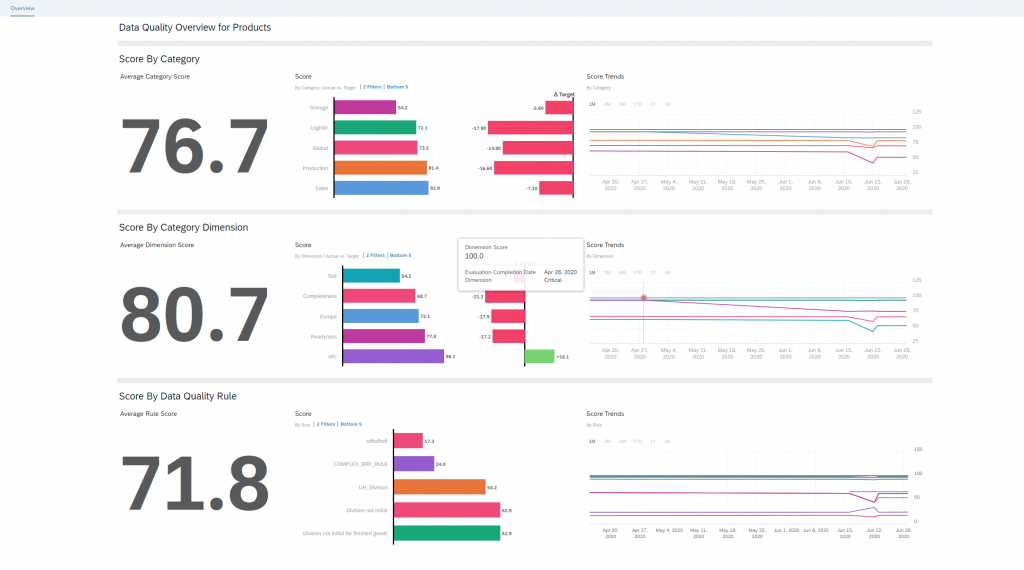
The bar chart shows the five lowest score categories, and the trend chart provides the history of each category. When you click any category in the bar chart, the history trends chart displays only your selected ones with the same color. The dimension score charts and data quality rules charts below are updated accordingly.
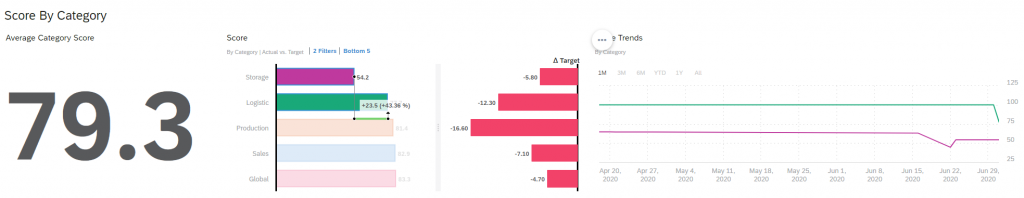
In case you have configured Dashboard access via your S/4 Fiori Launchpad, you can also right click to jump to Configure Data Quality Score app on your selected Category
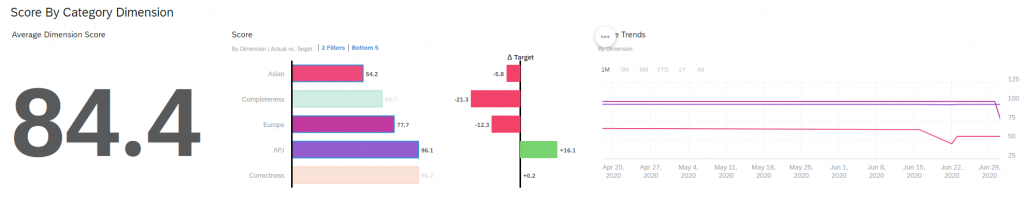
Dimension Score
The Average Dimension Score give you the overview quality of all defined dimensions for your master data.
The bar chart shows the five lowest score dimensions, and the trend chart provides the history of each dimension. When you click any dimension in the bar chart, the history trends chart displays only your selected ones with the same color. The data quality rules chart is updated accordingly.
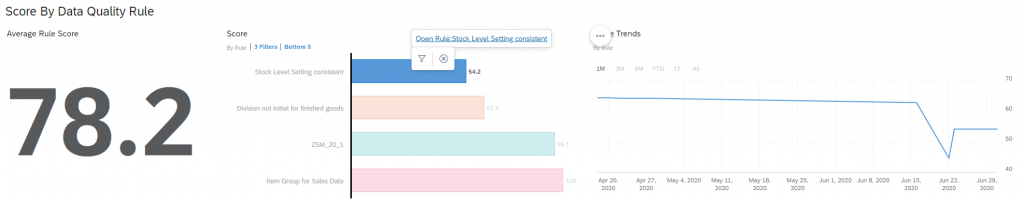
Data Quality Rule Score
The Average Dimension Score give you the overview quality of all defined rules for your master data.
The bar chart shows the five lowest score rules, and the trend chart provides the history of each rule. When you click any rule in the bar chart, the history trends chart displays only your selected ones with the same color.
Additionally, you will get the navigation link on your selected rule. You can click to open the data quality rule application from your S/4 on-premise system.
How To Set Up Dashboard for Your SAC Tenant
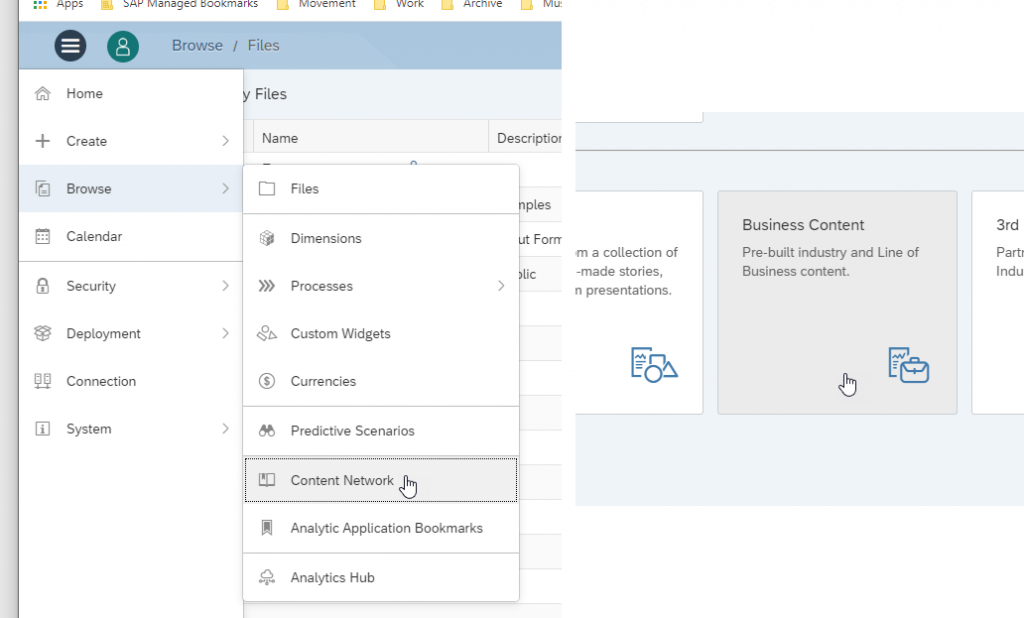
Import the MDG Data Quality Content into Your Tenant
Open Content Network from your tenant, find the SAP Master Data Governance package, and import it.
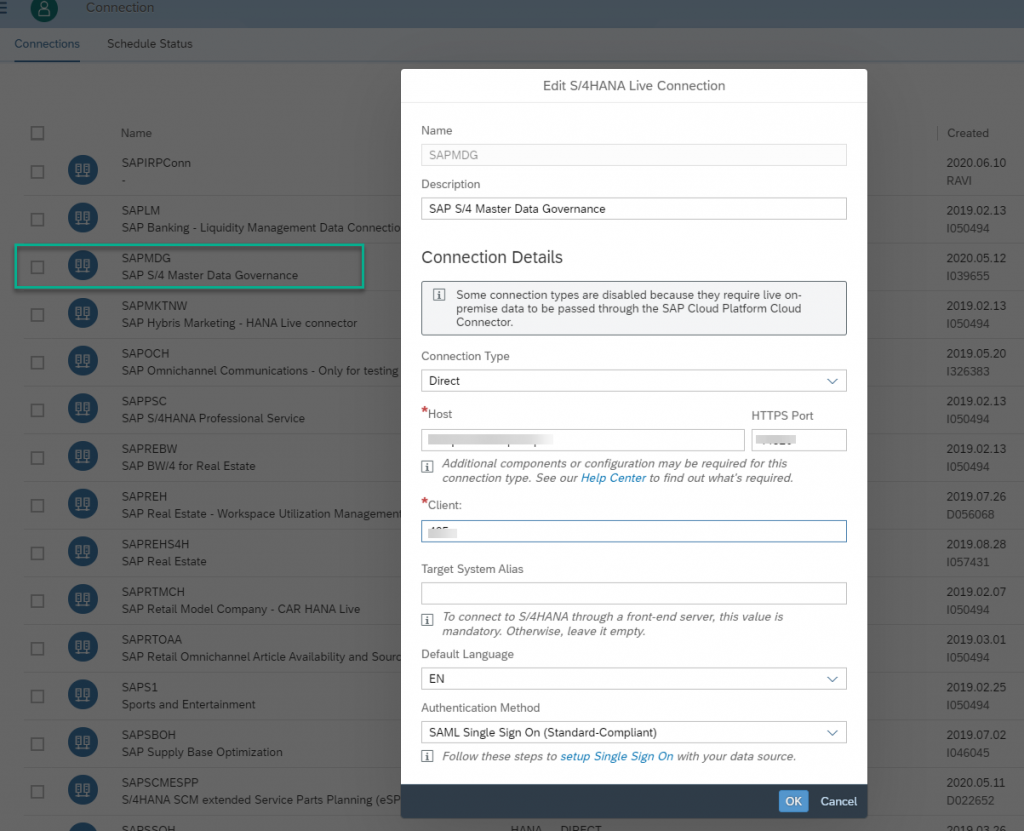
Set Up the Connection to Your S/4 System
After the import, you have created the connection SAPMDG in your tenant. Open it and enter your system info.
Enhance Your Dashboard
There are two stories located under the Public/SAP_Content/SAP_MDG_Master_Data_Governance folder.
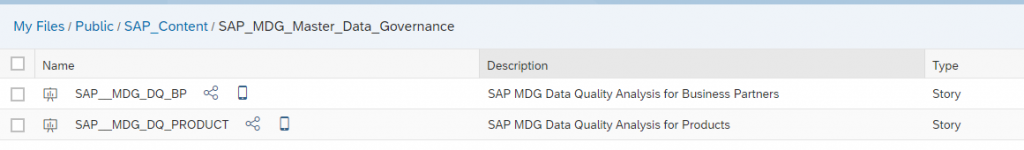
If you want to create a new chart or display more details on the existing chart, you can copy it to your own Story and enhance it there.
Configure the Backend Navigation in Your S/4 On-Premise System
Call up transaction SE38 and execute the program MDQ_MAINT_HOST_PATH. Enter the SAP Fiori host path and execute.
Example: myhost.mycorp/sap/bc/ui5_ui5/ui2/ushell/shells/abap/FioriLaunchpad.html?#Shell-homeAfterwards, you will be able to open data quality rules in your S/4 on-premise system from your SAC tenant.
Configure the Backend Navigation in Your S/4 Cloud Tenant
If you are connecting to MDG on S/4 Cloud, replace the hyperlink in the story chart directly,
<YourS4TenantFioriLaunchpadhomeURL>#MDQualityBusinessRule-manage?MDQltyBusinessObjectTypeCode=194&MDQualityBusinessRule=[Rule Definition ID]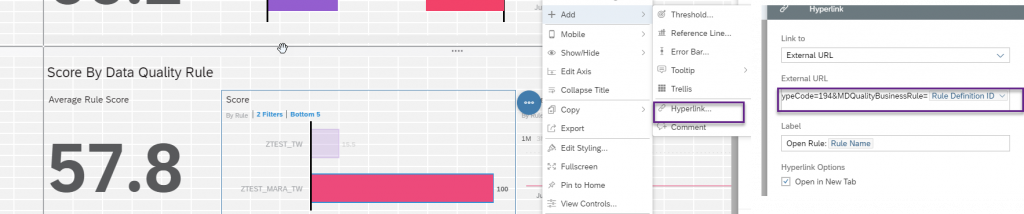
How To Access Dashboard for Your End User
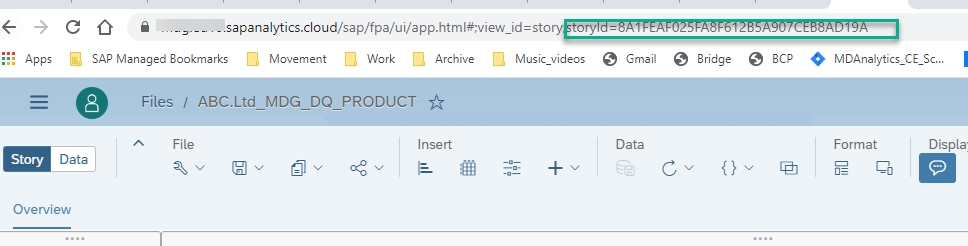
Option 1: Access Your Dashboard via URL
Open the story, the URL now appearing in your browser is also the address for your end user to access the dashboard.
This option fits to casual user who access it time to time.
Option 2: Access Your Dashboard via Your S/4HANA Fiori Launchpad
It is also possible to embed the dashboard into your S/4HANA Fiori launchpad. For more professional users who are mainly working in this environment, they will be able to access the dashboard from here.
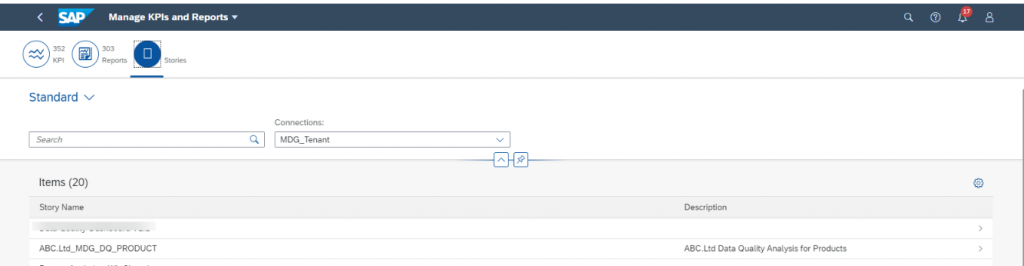
Once setup is done, you can now go to the Manage KPIs and Report app from your Fiori launchpad, open Stories, and select the connection. You will see your story listed there.
Now you can create Fiori applications in the catalog by following note 2919734. Here are my examples:
Target Mapping in Catalog
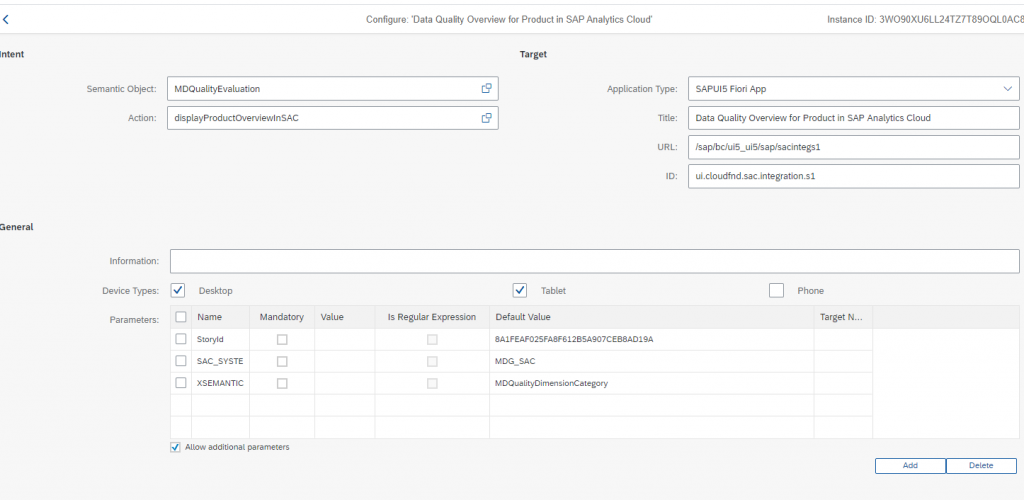
With parameter XSEMANTIC_OBJECTS, with Default value MDQualityDimensionCategory, you will be able to Jump to Configure Score app from the dashboard
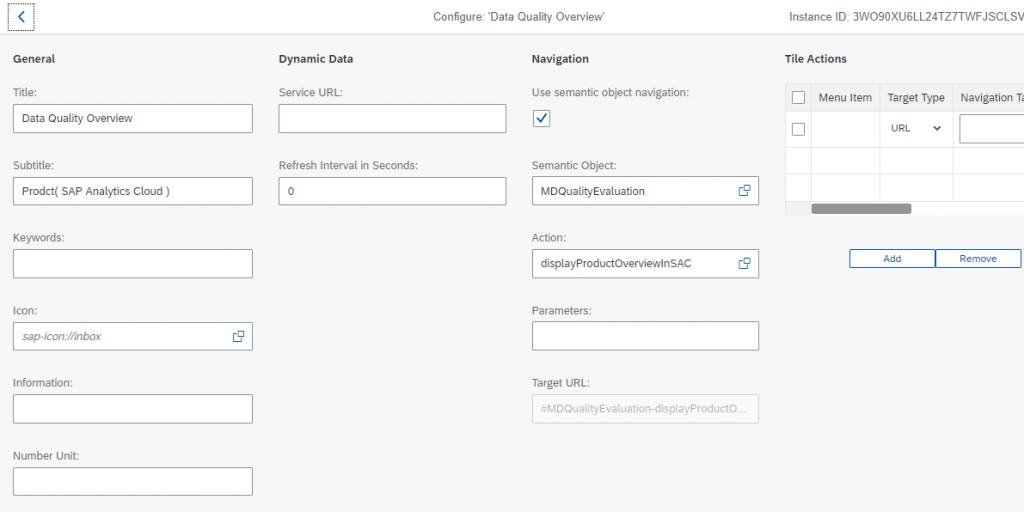
Tile Configuration in Catalog
Afterwards, you can assign the catalog and group to PFCG Role, and assign th PFCG role to the end user and the tile should appear in his or her Fiori launchpad.