Introduction
The Stacked Bar Micro Chart represents related values atop one another in order to visualise the single values as part of a whole. Stacked bar micro chart has responsive design and very low profile height-wise which makes it ideal to use it in Fiori Elements list report.
In this blog, we will look at how to add Stacked Bar Micro Chart in Fiori Elements List Report.
Use Case
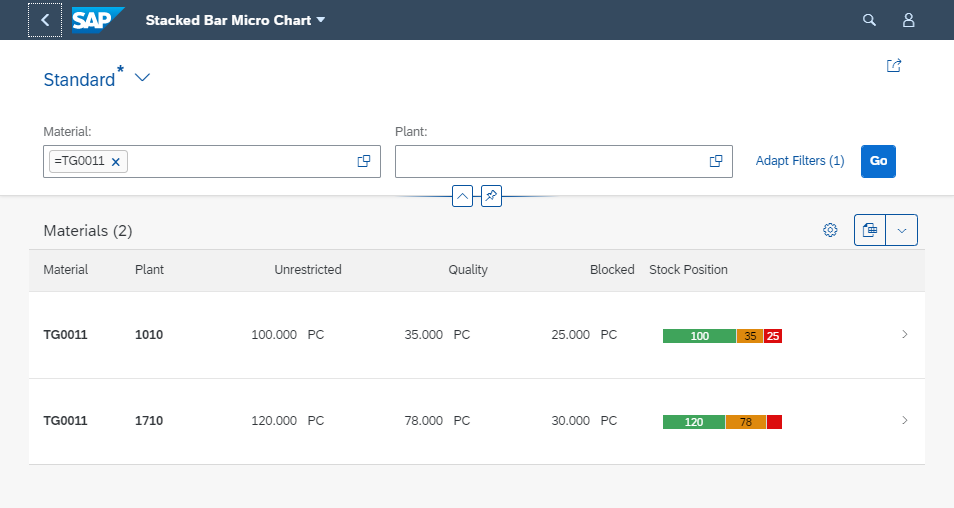
The stock report displays unrestricted, quality and blocked stock for Material at Plant level. It becomes difficult for stock controllers to spot anomalies when they are looking at a page full of materials. Adding a Stacked Bar Micro Chart to report displaying unrestricted, quality and blocked stock will help spot the anomalies e.g where the majority of stock is in quality or blocked or in both.

Solution Overview
Stacked Bar Micro Chart in Fiori Elements list report, in this blog, is achieved using extensions.
Before you ask, why I am using the extensions and not annotations, the reason is I could not implement it using annotations. In case you have figured out please share in comments.
To start with we have a couple of CDS views. CDS ZMS_MaterialStock provides stock at the storage location level. CDS ZMS_MaterialStock_Plant gives us aggregate stock values at the plant level. Both of these CDS has respective metadata extension with UI annotation to render list report and object page.
Once we have Fiori Element List report project in WebIDE we’ll Table column and Table cell extension. Followed by a controller extension to format stock values coming from OData into the float format.
Code
CDS ZMS_MaterialStock (stock at the storage location level)
@AbapCatalog.sqlViewName: 'ZMSSTK1'
@AbapCatalog.compiler.compareFilter: true
@AbapCatalog.preserveKey: true
@EndUserText.label: 'Material Stock Storage Location'
@AccessControl.authorizationCheck: #NOT_REQUIRED

@ObjectModel.semanticKey: ['Product' , 'Plant' , 'StorageLocation']

@Metadata.allowExtensions: true

define view ZMS_MaterialStock
  as select from nsdm_e_mard as mard
    inner join   mara on mard.matnr = mara.matnr
{

  key mard.matnr as Product,
  key mard.werks as Plant,
  key mard.lgort as StorageLocation,

      @Semantics.unitOfMeasure: true
      mara.meins as BaseUnit,

      @Semantics.quantity.unitOfMeasure: 'BaseUnit'
      mard.labst as Unrestricted,

      @Semantics.quantity.unitOfMeasure: 'BaseUnit'
      mard.insme as Quanlity,

      @Semantics.quantity.unitOfMeasure: 'BaseUnit'
      mard.speme as Blocked
}
where
  mard.lvorm = ''
MTE (Metadata Extension) for CDS ZMS_MaterialStock
@Metadata.layer: #CORE

annotate view ZMS_MaterialStock with
{

  @UI.lineItem:       [{ position: 20 }]
  StorageLocation;

  @UI.lineItem:       [{ position: 30 }]
  Unrestricted;

  @UI.lineItem:       [{ position: 40 }]
  Quanlity;

  @UI.lineItem:       [{ position: 50 }]
  Blocked;
}
CDS ZMS_MaterialStock_Plant (aggregate stock values at the plant level)
@AbapCatalog.sqlViewName: 'ZMSSTK2'
@AbapCatalog.compiler.compareFilter: true
@AbapCatalog.preserveKey: true
@AccessControl.authorizationCheck: #NOT_REQUIRED
@EndUserText.label: 'Material Stock By Plant'
@ObjectModel.semanticKey: ['Product' , 'Plant']

@OData.publish: true
@Metadata.allowExtensions: true

define view ZMS_MaterialStock_Plant
  as select from ZMS_MaterialStock
  association [*] to ZMS_MaterialStock as _Stock_StorageLocation
     on  $projection.Product = _Stock_StorageLocation.Product
     and $projection.Plant   = _Stock_StorageLocation.Plant
  association [1] to I_Product         as _Product
     on  $projection.Product = _Product.Product
  association [1] to I_Plant           as _Plant
     on  $projection.Plant = _Plant.Plant
{
  key Product,
  key Plant,

      @Semantics.unitOfMeasure: true
      BaseUnit,

      @Semantics.quantity.unitOfMeasure: 'BaseUnit'
      sum( Unrestricted ) as Unrestricted,

      @Semantics.quantity.unitOfMeasure: 'BaseUnit'
      sum( Quanlity )     as Quality,

      @Semantics.quantity.unitOfMeasure: 'BaseUnit'
      sum( Blocked )      as Blocked,

      _Stock_StorageLocation,
      _Product,
      _Plant
}
group by
  Product,
  Plant,
  BaseUnit
MTE for CDS ZMS_MaterialStock_Plant
@Metadata.layer: #CORE

@UI.headerInfo: { typeName: 'Material' ,
                  typeNamePlural: 'Materials' ,
                  title: { type: #STANDARD , value: 'Product'} ,
                  description: { type: #STANDARD, value: 'Product' } }

annotate view ZMS_MaterialStock_Plant with
{

  @UI.facet: [
                { type:         #COLLECTION ,
                  id:           'idGeneralInformation' ,
                  label:        'General Information' ,
                  position:     10 } ,
                { type:         #IDENTIFICATION_REFERENCE ,
                  id:           'idIdentification' ,
                  label :       'Plant Stock',
                  parentId:     'idGeneralInformation',
                  position:     10 },
                { type :        #LINEITEM_REFERENCE ,
                  id:           'idLineItemMatPlant' ,
                  label:        'Stock By Storage Location' ,
                  position:     20 ,
                  targetElement: '_Stock_StorageLocation'}
              ]

  @UI.lineItem:       [{ position: 10 }]
  @UI.selectionField: [{position: 10 }]
  Product;

  @UI.lineItem:       [{ position: 20 }]
  @UI.selectionField: [{ position: 20 }]
  @UI.identification: [{ position: 10 }]
  Plant;

  @UI.lineItem:       [{ position: 30 }]
  @UI.identification: [{ position: 20 }]
  Unrestricted;

  @UI.lineItem:       [{ position: 40 }]
  @UI.identification: [{ position: 30 }]
  Quality;

  @UI.lineItem:       [{ position: 50 }]
  @UI.identification: [{ position: 40 }]
  Blocked;
}
Create WebIDE Project with ZMS_MaterialStock_Plant as the entity for List and navigation to to_Stock_StorageLocation.
If you plan to use the code as-is, note I have named the project as stackedmicrochartbar and specified nothing in Namespace

WebIDE will add local @UI.facet annotation, get rid of that from annotation file as we already have Facet annotation in CDS. You should now have this list report and object page
TableColumnsExtension
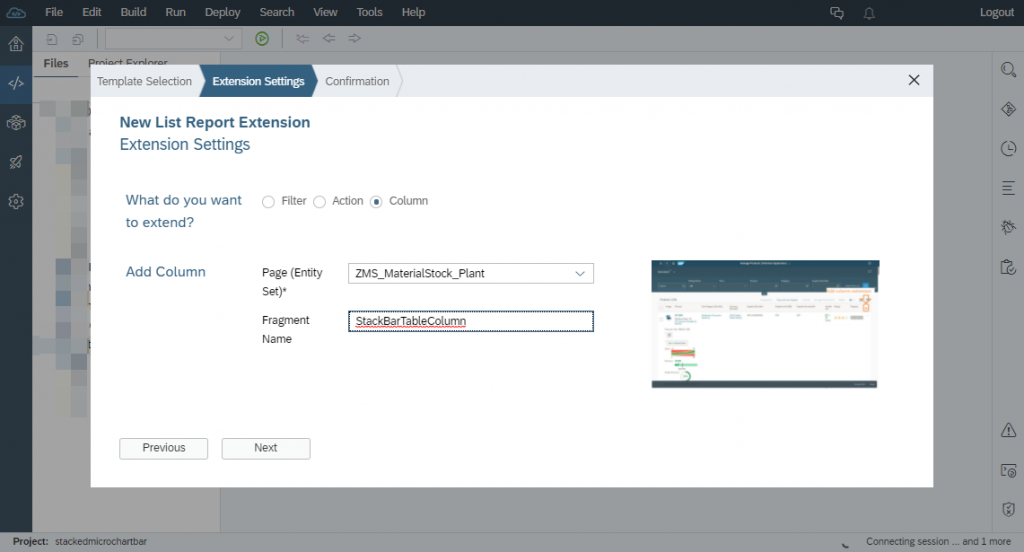
Right-click on the project and choose New->Extension. This will open the extension wizard. In Template Selection tab select List Report Extension press Next. In Extension Setting tab select Column (where it says What do you want to extend) to add a column on entity ZMS_MaterialStock_Plant. Enter fragment name StackBarTableColumn press next and confirm.
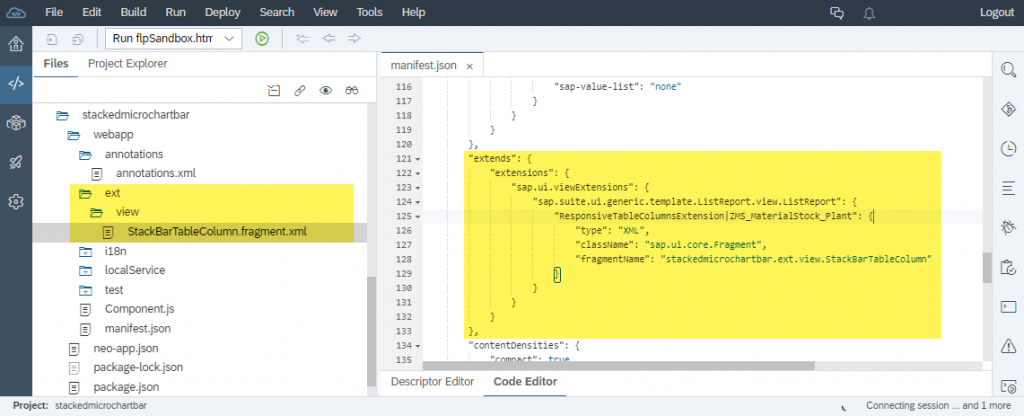
Wizard will add create the necessary folder structure and fragment file also it will update the manifest file with descriptor required for view extension. If you are comfortable, you can do this manually without using the wizard.
<core:FragmentDefinition xmlns:core="sap.ui.core" xmlns="sap.m">
   <Column>
     <Text text="Stock Position"/>
	<customData>
	   <core:CustomData key="p13nData"
	       value='\{"columnKey": "StockPosition" , "columnIndex" : "999"}'/>
	   </customData>
   </Column>
</core:FragmentDefinition>
We now have table header added to report with ResponsiveTableColumnsExtension. We need another fragment and respective descriptor (ResponsiveTableCellsExtension) to define the table cell. You would need to do this manually.
TableCellsExtension
Add an XML file StackBarTableCell.fragment.xml under folder ext->view and add descriptor as shown in below screenshot (copy-paste code later in the blog).
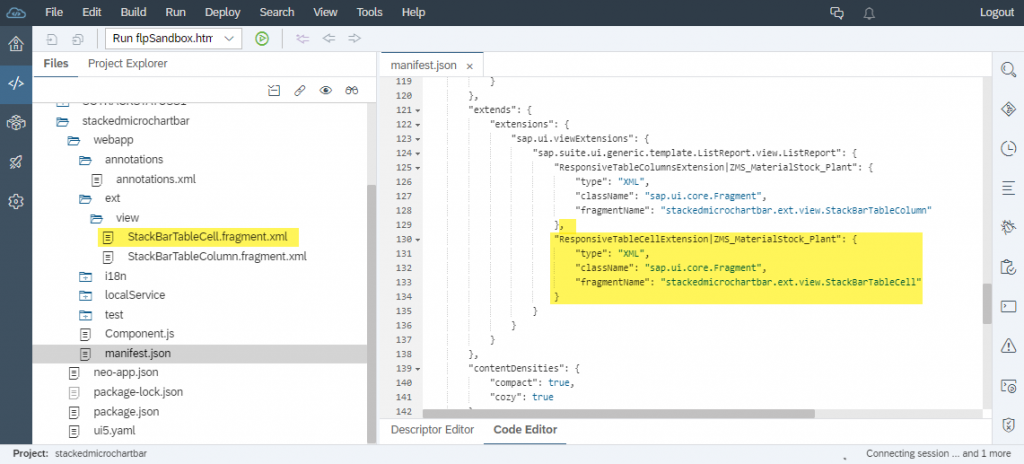
In the table cell fragment, we are rendering Stacked Bar Micro Chart with size S. Other sizes available are XS, M and L. Check out how different sized micro stacked bar chart are rendered in this SAP Demo Kit – Sample. We have specified three bars in the chart for Unrestricted, Quality and Blocked stock respectively.
<core:FragmentDefinition xmlns:core="sap.ui.core" xmlns:m="sap.m" xmlns="sap.suite.ui.microchart">
	<StackedBarMicroChart size="S" press="press" precision="0" class="sapUiSmallMargin">
		<bars>
			<StackedBarMicroChartBar value="{ path: 'Unrestricted', formatter : '.getFLoatFromString'}"
				displayValue="{ path: 'Unrestricted' }"
				valueColor="Good"/>
			<StackedBarMicroChartBar value="{ path: 'Quality', formatter : '.getFLoatFromString'}"
			   displayValue="{ path: 'Quality' }"
			   valueColor="Critical"/>
			<StackedBarMicroChartBar value="{ path: 'Blocked', formatter : '.getFLoatFromString'}"
			   displayValue="{ path: 'Blocked' }"
			   valueColor="Error"/>
		</bars>
	</StackedBarMicroChart>
</core:FragmentDefinition>
Notice we have called formatter getFloatFromString, which we will implement next.
Controller Extension
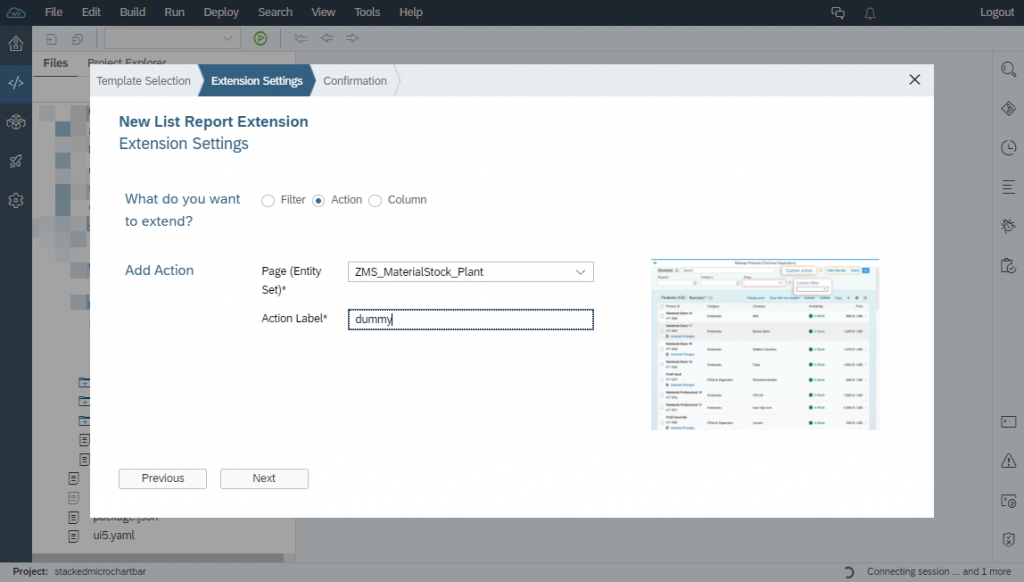
I have used Action extension wizard which adds controller to the project and update manifest file as well. Following the wizard, I removed action related descriptor from the manifest file. This leaves me with the controller in the project.
So, right-click on the project and choose New->Extension. This will open the extension wizard. In Template Selection tab select List Report Extension press Next. In Extension Setting tab select Action. Select entity ZMS_MaterialStock_Plant and put dummy name in Action label.
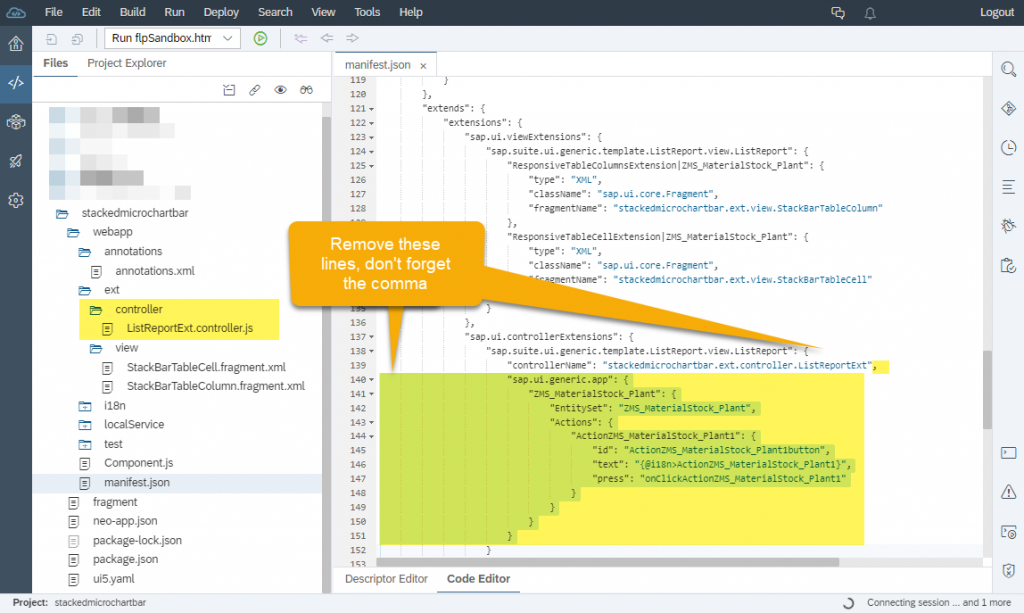
Wizard will add file ListReportExt.controller.js under folder ext->controller and descriptor in the manifest file. Now remove lines highlighted in below screenshot.
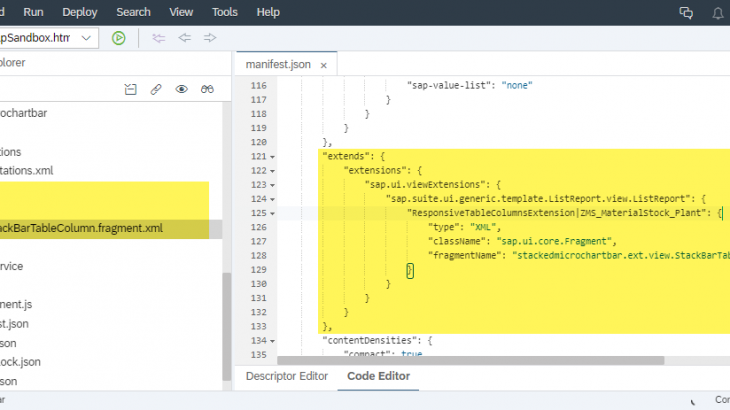
We got all artefacts now. Manifest file extends descriptors should look like:
"extends": {
    "extensions": {
        "sap.ui.viewExtensions": {
            "sap.suite.ui.generic.template.ListReport.view.ListReport": {
                "ResponsiveTableColumnsExtension|ZMS_MaterialStock_Plant": {
                    "type": "XML",
                    "className": "sap.ui.core.Fragment",
                    "fragmentName": "stackedmicrochartbar.ext.view.StackBarTableColumn"
                },
                "ResponsiveTableCellsExtension|ZMS_MaterialStock_Plant": {
                    "type": "XML",
                    "className": "sap.ui.core.Fragment",
                    "fragmentName": "stackedmicrochartbar.ext.view.StackBarTableCell"
                }
            }
        },
        "sap.ui.controllerExtensions": {
            "sap.suite.ui.generic.template.ListReport.view.ListReport": {
                "controllerName": "stackedmicrochartbar.ext.controller.ListReportExt"
            }
        }
    }
},
Code in the ListReportExt.controller.js file which converts a value to Float.
sap.ui.controller("stackedmicrochartbar.ext.controller.ListReportExt", {
	getFLoatFromString: function(sValue) {
				if (!sValue) {
					return "";
				}
				return parseFloat(sValue);
			}
});
Save all files and run the report and you should get Stacked Bar Micro Chart.