If you have a great database schema, it is always good to promote it with a spectacular poster-sized ER diagram. I am part of the older crowd where, perhaps, having a working system is not the last step unless everyone knows you’ve put intense thought into the underlying database. The exact method for properly finishing and printing SAP PowerDesigner ER diagrams has never been published, hence the purpose of this post. I suspect this is the first time you may have seen a way to print SAP HANA schemas with SAP Powerdesigner:
SAP PowerDesigner goes all the way back to 1989. It is widely used at my company for many data modeling activities. I use it to build data models for the HANA, ASE, IQ, SQL Anywhere, and Ultralite database systems I work on. These are all SAP database products. SAP PowerDesigner, being an SAP product, focuses on supporting these SAP databases.
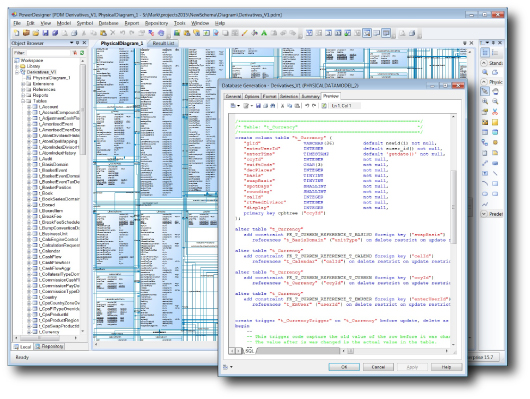
One of its functions is to create ER diagrams. You can do this from scratch with the tool, or you can use the tool to reverse engineer an existing database into an ER diagram. The diagram shows tables along with the attributes and foreign key connections and other types of table attributes. From this diagram, you can push the Generate Database button to generate DDL in script form. This script is then used to generate the database objects. Here is a HANA schema diagram and a Generate Database dialog box on my computer screen:
PowerDesigner can also generate DDL for other databases such as Oracle and MS SQL. In this respect, PowerDesigner is a good tool if you find yourself in a situation where you must support several database products at the same time in a consistent manner.
Other than DDL script generation and design reviews, I use it to document the database schema. My diagrams usually end up on a wall, and are often delivered to management and engineering and marketing.
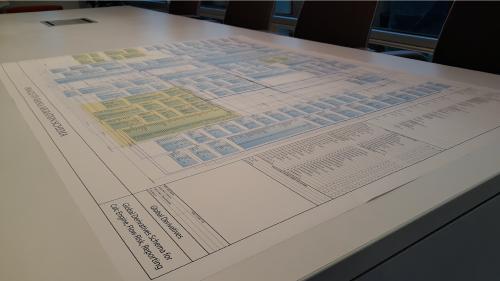
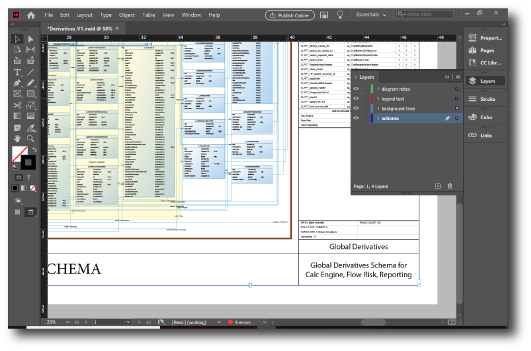
By itself, the PowerDesigner ER diagram just presents a picture of the schema. This is never enough for printing purposes either in PDF or to a printer, especially when it comes to explaining the system. I often end up bordering the diagram much like a blueprint, with background and annotations sidebars and so on:
How Good does it have to be?
To annotate and print, the diagram must be really, really, really good. It must look like a blueprint, or an architectural diagram for a building. The diagram must be sharp. We need a border with a legend. We need sidebars with documentation. We need everything aligned and snapped to .25 inches or better. It must look like we put a lot of work into the design, which we did. No cheap shortcuts are allowed. If we do anything less, forget it. It must be printable as a poster. In my case, the HP Designjet T1300 44-inch printer is perfect.
After spending so much time coming up with a poster-size Physical Data Model in PowerDesigner, at 44×33 inches, it turns out that you cannot print it at that size to the Designjet printer. From PowerDesigner->print, when you choose the Designjet printer and try all combinations of settings, the document always paginates.
Saving a poster-size document to PDF directly from does not work either. For the PDF device, there is no combination of settings that will remove pagination placed in the document by PowerDesigner. There are a couple combinations that come close, but the result is a pixelated document, or a document where things are mis-aligned. Even worse, the “hairline” foreign keys between tables are all messed up position and resolution-wise.
If would be a shame to cheap out, and print a bunch of letter-size pages, and then tape them together. What an embarrassing thing to do! Everybody would laugh at you, and nobody would take you seriously if you did that.
So, here is a method I devised for printing a poster-size PowerDesigner Diagram.
Step 1: Start with Adobe InDesign
You need to be up-to-speed in Adobe InDesign and Adobe Illustrator or find someone who is. These are the formatting tools I use. It takes far more than Microsoft Paint or Power Point or Word to get this right.
Adobe InDesign is a page layout tool. With this, we create all the border data. Then we place the diagram in the viewing area. This is the document we print and circulate.
Build 3 layers, one for the legend text, one for the background lines, and one for the diagram (I called it the Schema layer). The legend and background are easy. We need to do some extra work to get the diagram imported. Here is the legend and background:
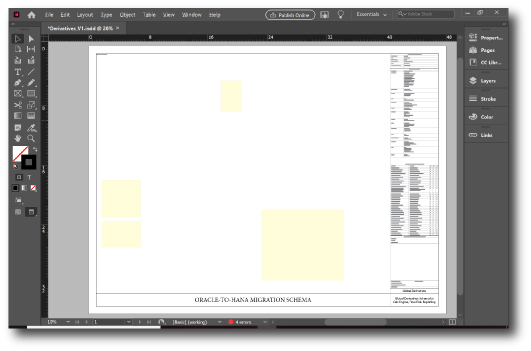
The Designjet printer can handle a document of 44×36 inches. We will use up all of it. The perimeter for the Schema layer is 40×32 inches. Remember this 40×32 dimension for the next step.
Step 2: Build the PowerDesigner Diagram
Now go into PowerDesigner and build the Physical Data Model.
If you reverse-engineer a database, import just the tables needed, and import primary keys and foreign keys. There are a lot of steps here, but once you get through it, you will have a diagram to work with. There are a couple things to make life easier, as follow.
First, draw a 40×32 inch box on the screen. The diagram must fit in this box so that it can be imported into the Adobe InDesign document at 100% scaling. It is important not to let the diagram scale, because the spacing for lines and boxes will start to overlap in unexpected ways.
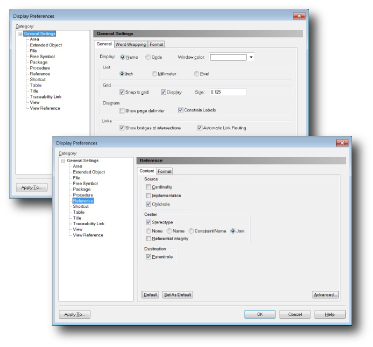
Next, set up the PowerDesigner Display Preferences. In the Reference dialog. we set the fkey-pkey label to show the attribute name instead of the reference name. In the General Settings, we set the units to inches, we snap to grid and display them, and we show bridges at intersections.
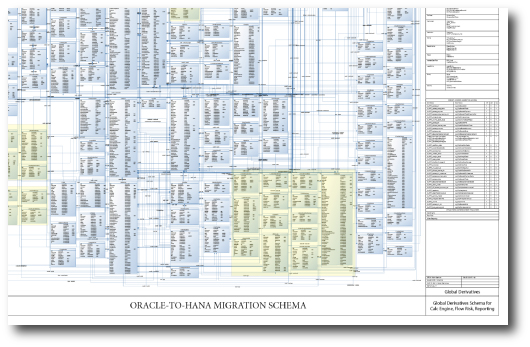
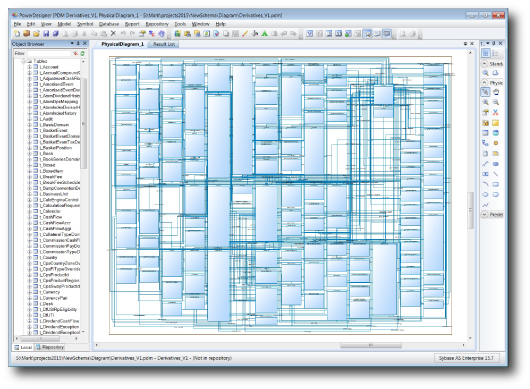
Once that is done, we arrange the tables manually according to our knowledge of the data. I do not use the auto-layout options because the result, while it might look nice, makes no sense to an engineer looking at the random proximity of one table to another.
Here is the result:
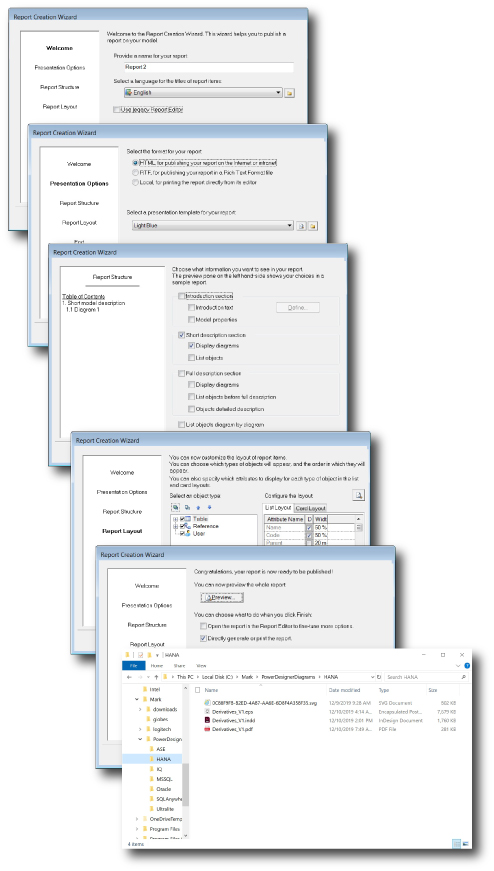
Now comes the big problem. How to get this over to Adobe InDesign? We cannot print a 38×32 document to PDF. The result is either pagination, or mis-aligned boxes and lines. Instead, we can generate SVG for the diagram. Do not generate JPG or PBM formats. They will pixelate or blur no matter what compression (or non-compression) is used. To generate an SVG diagram, use the PowerDesigner report wizard. Do this: Report -> Report Wizard. The result is an SVG file:
Step 3: Import the Diagram into the InDesign Document
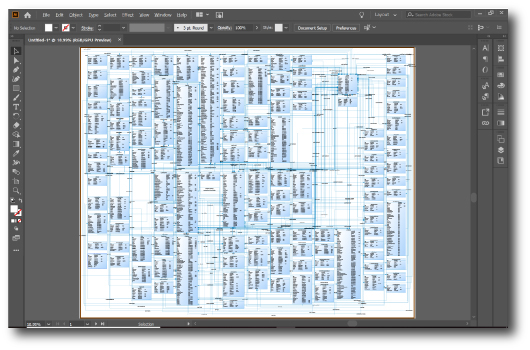
Adobe InDesign cannot read SVG files, but it can read other formats such as PDF, EPS, JPG, BMP, PNG. So, how to get the SVG file over to Adobe InDesign? Let’s convert the SVG to EPS, so we can import into Adobe InDesign. Adobe Illustrator can read SVG and it can save to formats which can be read by Adobe InDesign, so open the SVG in Adobe Illustrator:
Select the border that was placed in the diagram when it was constructed in PowerDesigner. Set the stroke to invisible. We don’t want to see it, in the Adobe InDesign document. Do this: Save as -> EPS
OK, now go over the Adobe InDesign and place the EPS into the document on the Schema Layer:
Make sure your display performance is high, so you don’t get fooled by the fuzziness of the diagram. It should look sharp, not fuzzy. The document will print sharply without this, but I do it so I can review things on the screen first. Do this: View -> Display Performance -> High Quality Display
Step 4: Print the document with Adobe Illustrator
Printing an Adobe InDesign document at 44×36 does not work for any print settings. Attempts will print just the lower left letter size area of the document. There is probably a way to do this, but I cannot not figure it out.
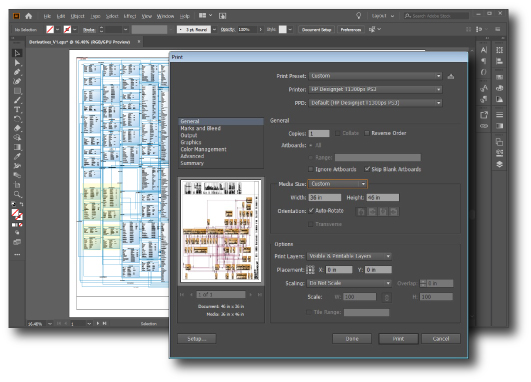
Adobe Illustrator, on the other hand, can print the entire 44×36 document just fine. So, bring the diagram over to Adobe Illustrator by saving it as PDF from Adobe InDesign, and then opening the PDF from Adobe Illustrator. Export Adobe InDesign as PDF. Do this: File -> Export. Use maximum settings in the next dialog box that comes up.
Now go over to Adobe Illustrator and open the PDF:
Print it to the Designjet printer. Make sure the “Media Size” combo box is set to “Custom”:
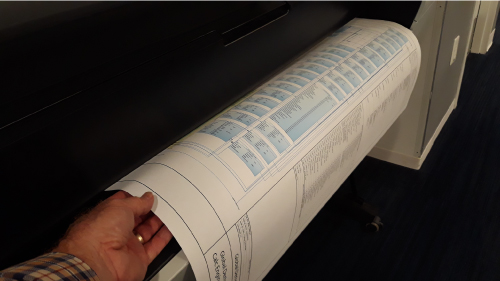
Done. The printed result is perfect! You now have a good way to show everyone all the thought and effort that went into your database design. It may take a while to get there, but for me it has always been worth the effort. The first time I did it, the entire process (the reverse-engineering way) took a good chunk out of the work week plus a lot of thinking. Do not give up!
Now that I have an Adobe InDesign template to use, and am proficient in Adobe and PowerDesigner things, I can turn out a PDF diagram in a couple hours depending on the schema and amount of annotation needed.


