Data Analytics has become increasingly important for enterprises as it enables employees in answering critical business questions. In many enterprises, these business questions are answered by a handful of analysts via the creation of dashboards in SAP Analytics Cloud. These are then shared with business users, managers, and executives.
Customers want to maximize the capabilities that are available within SAP Analytics Cloud. It ranges from exploring data to uncover valuable insights to running what-if scenarios. For users to enjoy these capabilities, the tool must be easy to use and performant.
With the latest release of SAP Analytics Cloud (2021.14 – Q3 QRC), we are introducing Optimized View Mode. It can be enabled on a per dashboard basis providing several usability improvements and a more performant dashboard (in certain scenarios).
Usability Improvements
We are constantly striving to provide a better experience to the viewer. Hence, Optimized View Mode addresses several usability challenges that have been raised by customers via the SAP Analytics Cloud Influence Portal. Below is an overview of the individual improvements that are available in Optimized View Mode.
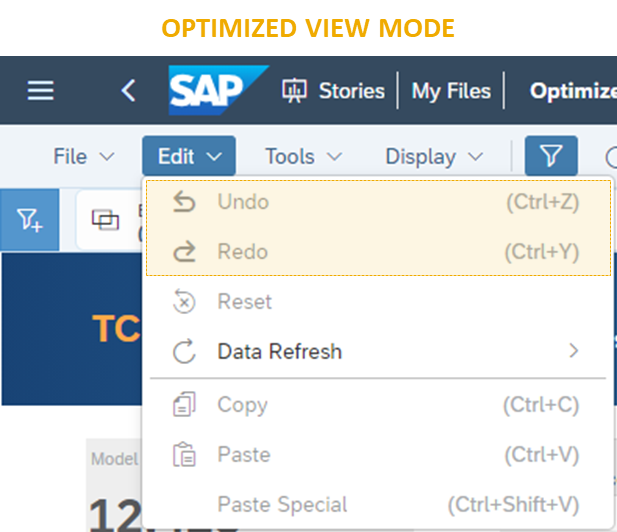
View Time Undo / Redo
Viewers can now Undo and Redo actions when viewing a story. It provides viewers the ability to quickly reverse actions such as filter interactions. Actions that do not have a data related change are not undoable. For example, a page switch without any data impact data will not be undoable.
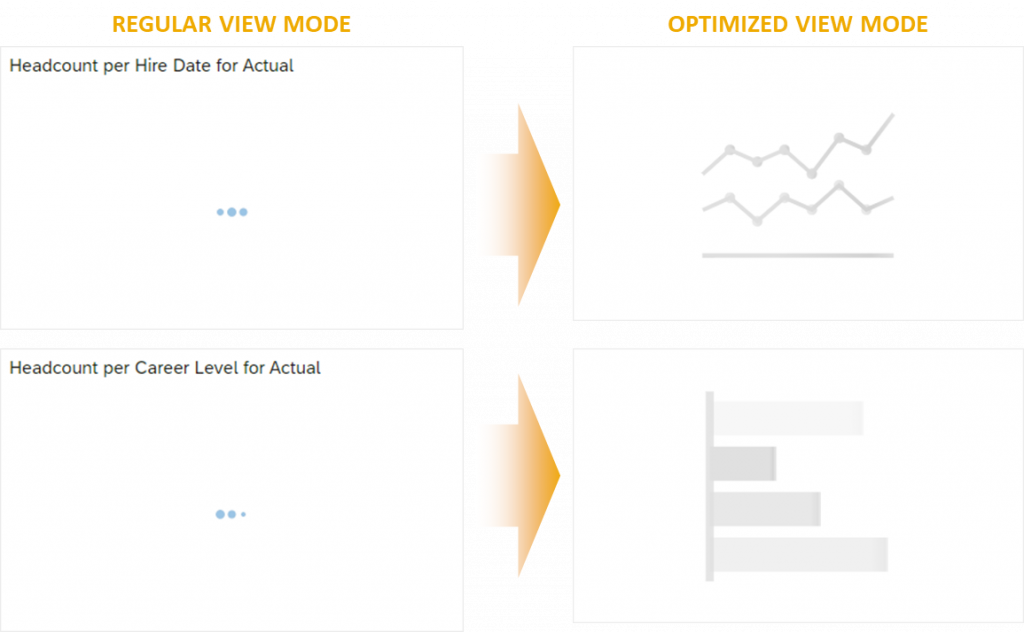
Ghost Loading Indicator
Dashboards now display an animated ghost widget, while data from the server is retrieved. It provides the story viewer an early insight to the type of visualization that is rendering and makes it easier to tell which objects are loading especially when they are small.
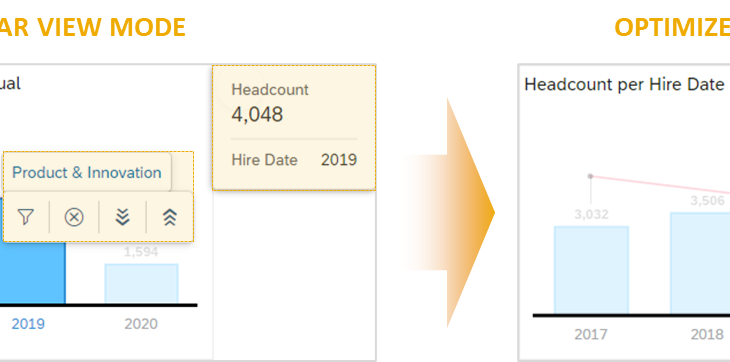
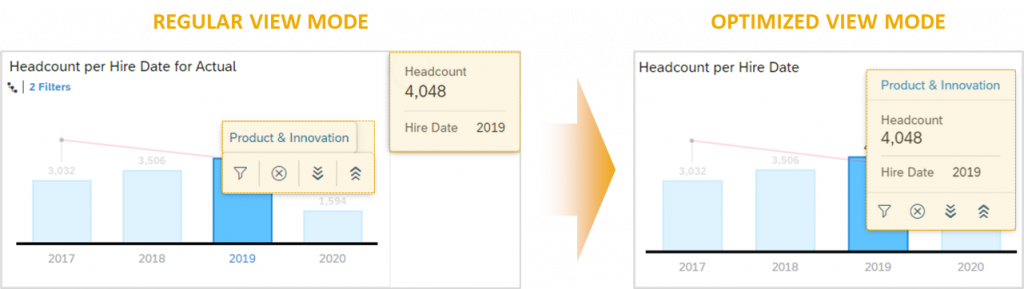
Tooltip Improvements
The tooltip and data point interactions are now consolidated into a single menu. The tooltip will be shown closer to the position of the mouse making them easier to access. Additional actions are still available via the right click context menu.
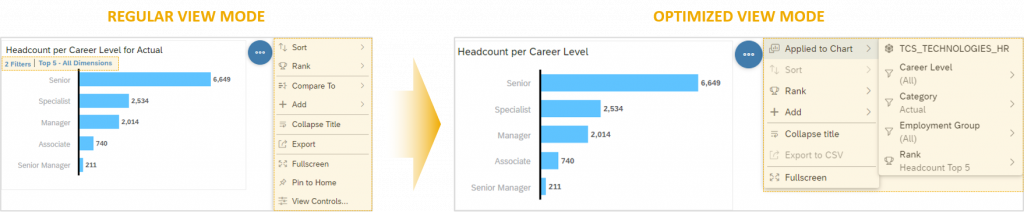
Access and Configuration of Visualization Information
Information and configuration options have now been moved from inside the widget into a grouped single menu item. It results in a cleaner look of the dashboard while providing access to valuable information such as warnings, filters, drill levels, and variables.
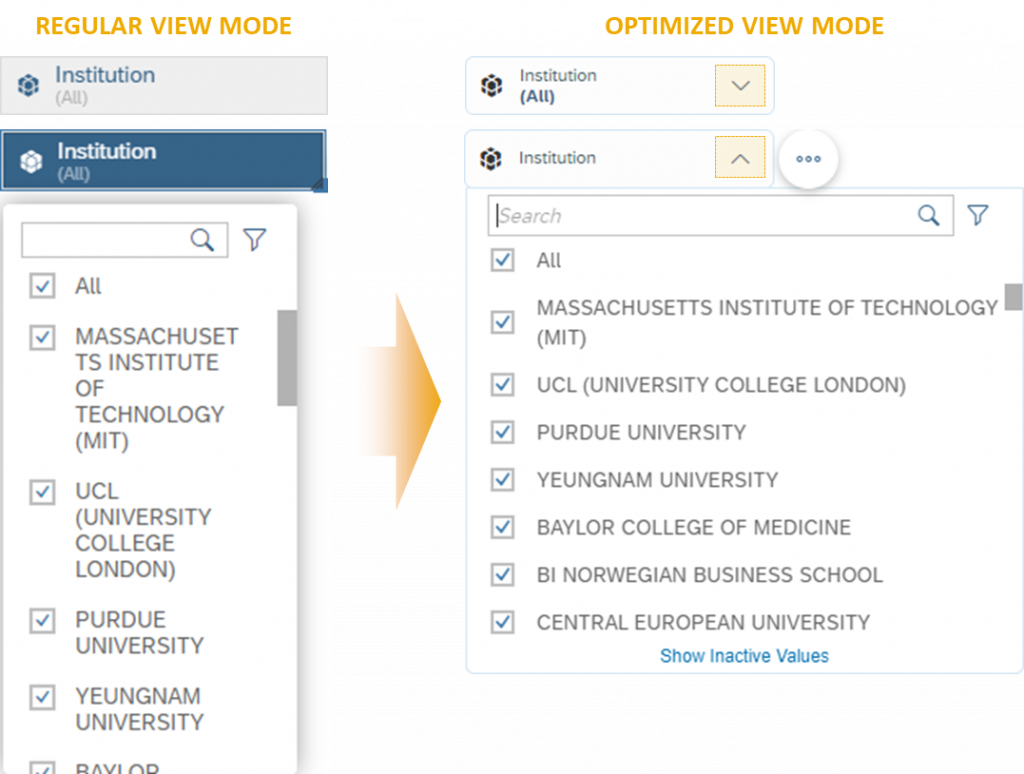
Collapsed Input Controls Discoverability
A visual update to story filters and collapsed input controls now makes the dropdown more discoverable. Furthermore, the width of the drop-down menu has been expanded for better readability.
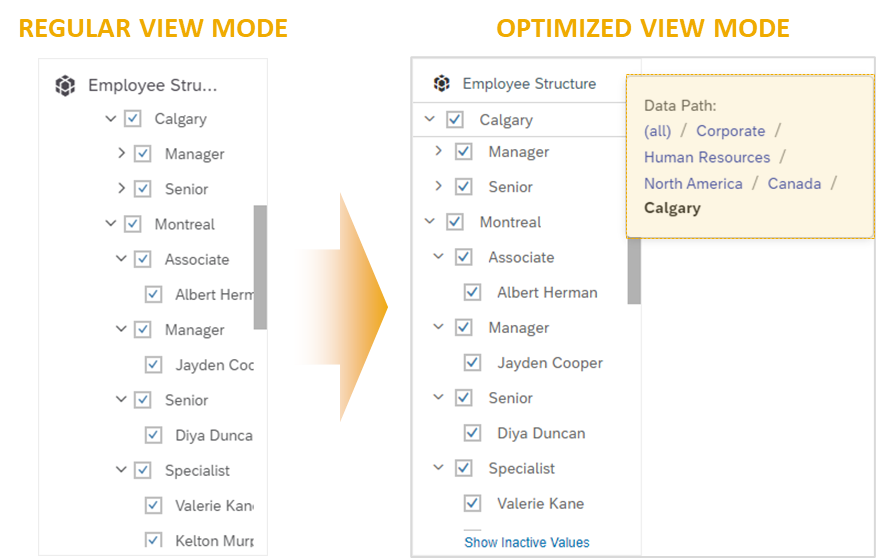
Hierarchy Improvements – Interaction and Navigation
There have been many updates to hierarchical input controls to enhance the overall interaction. These improvements include Hidden Inactive Members, Dynamic Scrolling, Sticky Header, and Data Path Tooltips.
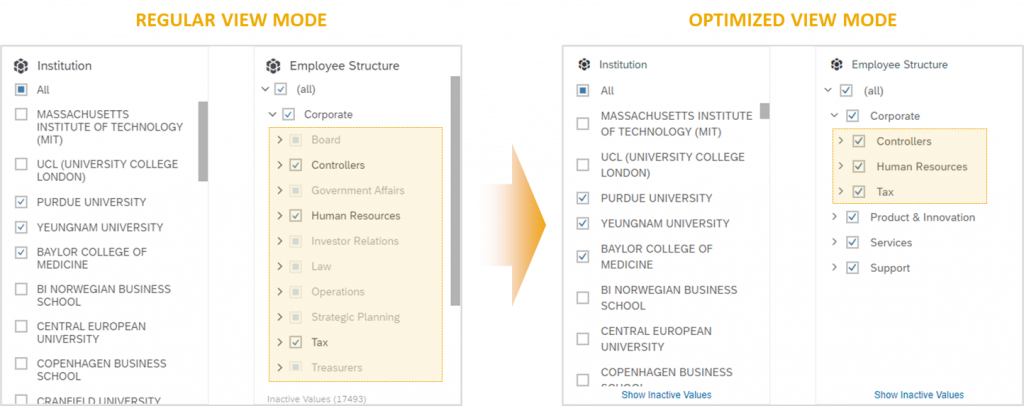
Children Loaded on Demand and Hidden Inactive Members
Complex hierarchies (multiple levels deep) now load faster as children are loaded on demand when the parent node is expanded. Furthermore, hierarchy members that would result in no data due to other story or page filters being applied, are now hidden by default. It provides better discoverability of the active members. Inactive members can still be loaded on demand.
Dynamic Scrolling and Sticky Parent Node in Hierarchies
Hierarchal input controls will now automatically shift left and right when a viewer navigates through the input control. Furthermore, the corresponding parent node of a hierarchy will now display at the top as the viewer scrolls. It improves overall readability and navigation as we maximize displaying members under the corresponding parent node and provide a quick and easy way to collapse hierarchy nodes.
Level-Based Navigation with Data Path Tooltip
A data path tooltip in available for hierarchal input controls. It provides the viewer context into the drill path that is taken and a quick way to navigate to any parent part of the drill path.
These are the usability improvements that are already available within Optimized View Mode.
Performance Improvements
Optimized View Mode can also improve the performance of dashboards in certain scenarios. It is important to understand that Optimized View Mode addresses specific client-side performance challenges only. It does not address performance challenges related to slow running queries in the backend (server-side) or performance issues related to slow networks
Dashboard Characteristics with Client-Side Performance Challenges
Dashboards that were less performant due to client-side performance challenges had several common characteristics. These characteristics include (but are not limited to):
- Multiple data related objects that consume a variety of complex features (such as variances, calculated measures and dimensions, filtering across models, and so on)
- Dashboards that were built consuming multiple data models each with a large amount of model information (metadata). These data models typically included:
- 40 or more measures
- 40 or more dimensions (each dimension include 50 or more members)
- Complex hierarchies (many levels deep or many children under each parent node)
- 40 or more measures
- Expanded filters based on complex hierarchies
With Optimized View Mode, we’ve been able improve client-side performance. Below is an overview of the individual improvements.
Introduction of the New Rendering Experience: Active Viewport Rendering
We are introducing a new default rendering experience available in Optimized View Mode: Active Viewport Rendering. It only renders objects that are visible on screen and will pause all objects outside the viewport until the user scrolls to another area of the story. For stories that have a lot information outside the visible area, it improves the performance as the user interacts (e.g. applies story filters) with the dashboard.
Improved Rendering on Story Open for the First Page in a Dashboard
Viewers want to see data as quickly as possible especially when they open a story to gather insights. Hence, in Optimized View Mode, on story open, we’ve improved the rendering of the first page.
Instead of spending the first few seconds of story opening to generate all the queries, we use Persisted Query Information. The Persisted Query Information is created and stored when a story designer saves a story in Optimized View Mode.
Persisted Query Information allows the data related queries to be sent to the backend (sever) as early as possible on story open. It allows the client in parallel to the sever processing the queries to focus on rendering visualizations and rendering other components within a dashboard.
Model Information Downloaded on Demand
Model Information (Metadata) such as the measures and dimensions (not the individual dimension members) that are part of the model are needed to support user interactions. However, depending on the size of the data model and how many models are consumed in a dashboard, this action may take a while.
In Optimized View Mode, we no longer download Model Information on story open. Instead, we retrieve it on demand based on the first user action that is executed for the corresponding data model.
Examples for these interactions include expansion of a filter token, visualization context menu, page switch, filters based on data point selection, and so on. While the first user interaction with the corresponding data model may be slower, it distributes the overall performance load and ensure that only information that viewer is interested in is requested for.
We’ve also improved the interaction with hierarchical input controls. In Optimized View Mode, we will incrementally load each level of the hierarchy as the viewer expands a parent node. For more details on the improvements made to hierarchal input controls, please reference the Usability Improvements section.
Limitations to Performance Improvements
There are specific scenarios where we are not able to use Persisted Query Information or are required to download the Model Information on story open. Hence, the performance benefits may vary.
New Data Model Structure
If the data model structure has changed by adding or removing measures or dimensions, then the Model Information will be requested on story open as the Persisted Query Information is no longer valid. It is recommended to resave the story as frequently as possible to revalidate the Persisted Query Information.
Dynamic Variables or Forced Variable Prompts
Dashboards that consume Dynamic Variables or Forced Variable Prompts will always request the Model Information. It is because the data context that is consumed from the viewer is almost guaranteed to be different from the Persisted Query Information which was stored.
Client-Side Filtering Across Models
Data Models that are impacted by a client-side filtering across model requires Model Information to be downloaded to ensure that the correct data is returned for the respective data related visualizations. It is recommended to avoid a client-side filter across model whenever possible. It occurs in the following scenarios:
- Model Links with Hierarchical Dimensions
- Links with a BW Data Model
- Data Models without Server Side Filtering Across Models capabilities
Geo Visualizations with Bubble Clustering Enabled
Model Information is requested as bubble clustering requires the geo visualization to resize and move to ensure that the data points are correctly clustered together. It is recommended to disable clustering in cases where the number of display points is below the clustering threshold.
BW Data Models
BW Data Models do not have the ability to Persist Query Information and will always download Model Information (subject to change – please reference limitations documentation). It is to ensure that the correct data is returned for the respective data related objects.
Opening a Story via URL to a Predefined Page
Persisted Query Information is currently limited to content on the first page. Hence, opening a story with a page other than the first page will require Model Information to be downloaded and Persisted Query Information will not be used.
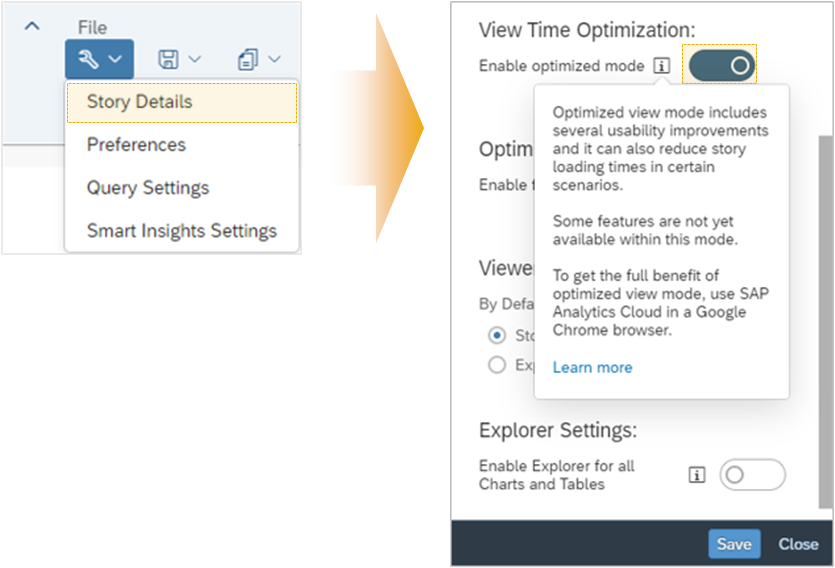
Enabling Optimized View Mode
Optimized View Mode is easy to enable on existing stories. It is not enabled by default and needs to be enabled on a per story basis. To enable optimized View Mode:
- In SAP Analytics Cloud, open an existing story.
- Switch to Edit
- From the file menu select Edit Story – Story Details.
- In the View Time Optimization section, select Enable optimized mode.
- To save your changes, select Save.
- To save your story, from the file menu select Save
With Optimized View Mode, viewers can benefit from the several usability improvements and experience a more performant dashboard (in certain scenarios).


