In this blog we are going to implement an end to end sap hana xs application by using hana studio.
Introduction
Hana Studio is the best development environment to implement end to end application development i.e. Front-end(UI) + Back-end(Server-side Logic + Database stuffs). In this blog we are going to create two employee details custom tables and use those tables in calculation view to join and get the output results. After that we are going to use xsodata and xsjs service to expose view data into front-end application. XSJS is free flow process, we can write our own server-side java-script code to implement business logic.
Also Read: SAP HANAIMP 16 Certification Preparation Guide
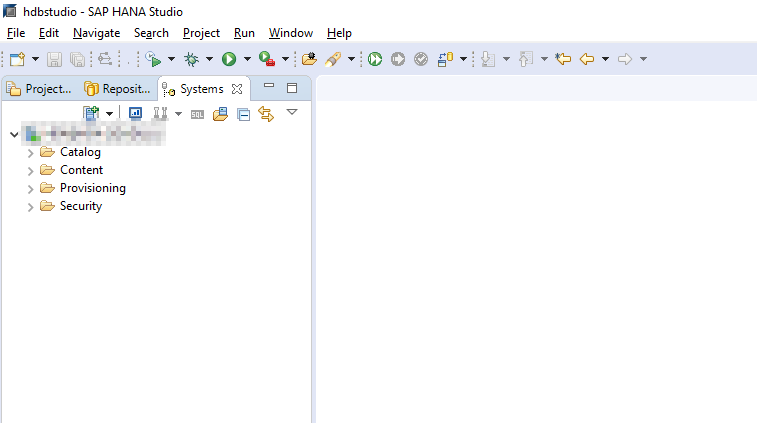
Step 1:- First we need a server connection to implement back-end stuff. Add a system in Systems perspective.
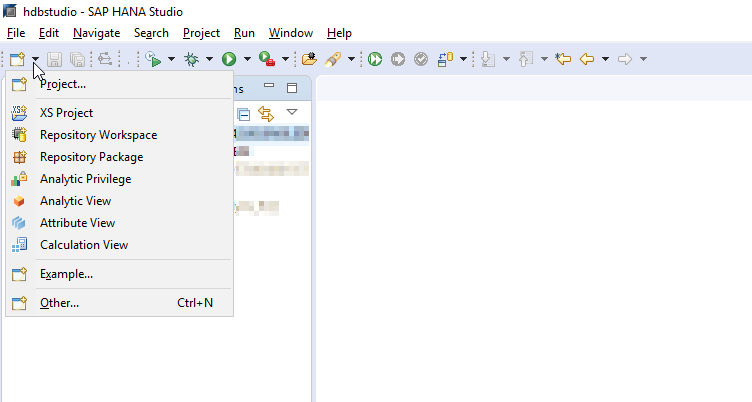
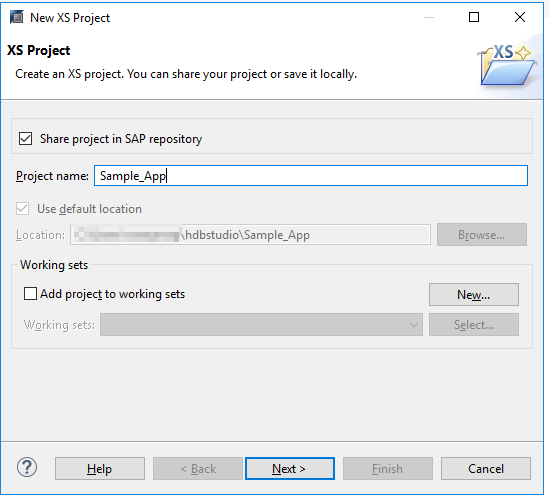
Step 2:- Click on NEW -> XS Project
Step 3:- Provide the Project name and click on Next.
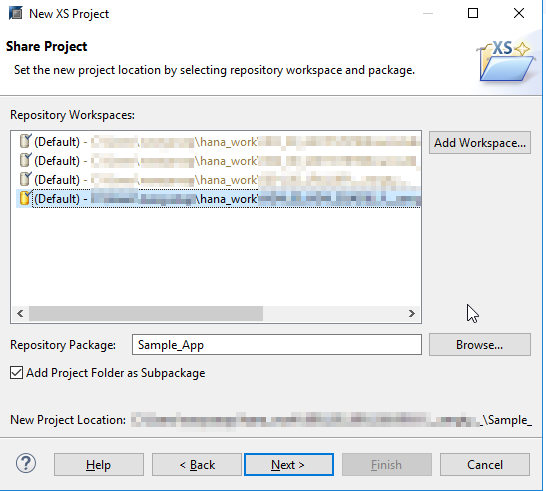
Step 4:- Select Project Workspace and check Add Project Folder as Subpackage and click on Next.
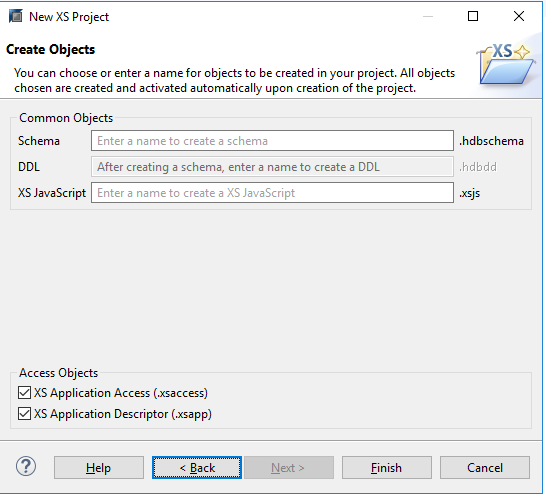
Step 5:- Select .xsaccess and .xsapp check boxes and click on Finish.
Step 6:- Project is created with below Folder structure in Project Explorer.
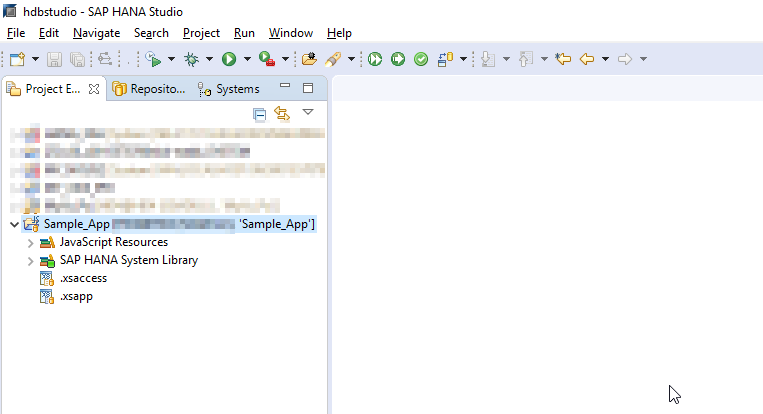
.xsapp file is created empty. there is no default code is generated during file creation, .xsaccess file is created with following code.
{
"exposed" : true,
"authentication" :
{
"method": "Form"
},
"cache_control" : "must-revalidate",
"cors" :
{
"enabled" : false
},
"enable_etags" : false,
"force_ssl" : false,
"prevent_xsrf" : true
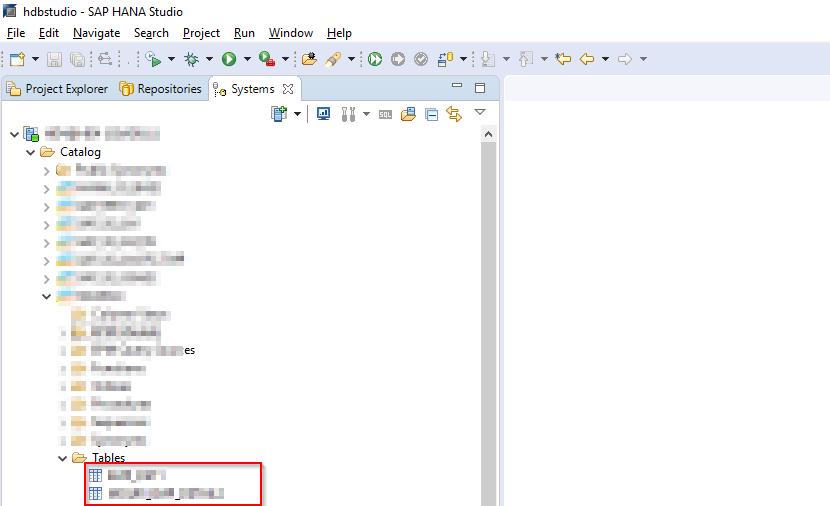
}Step 7 :- Create two custom tables and use those tables into calculation view.
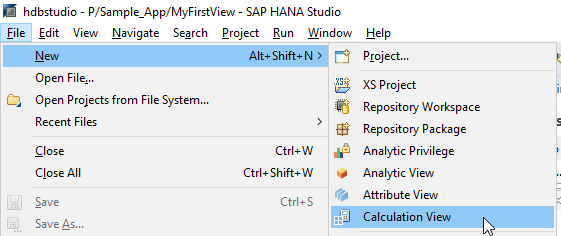
Step 8 :- Click on New->Calculation View.
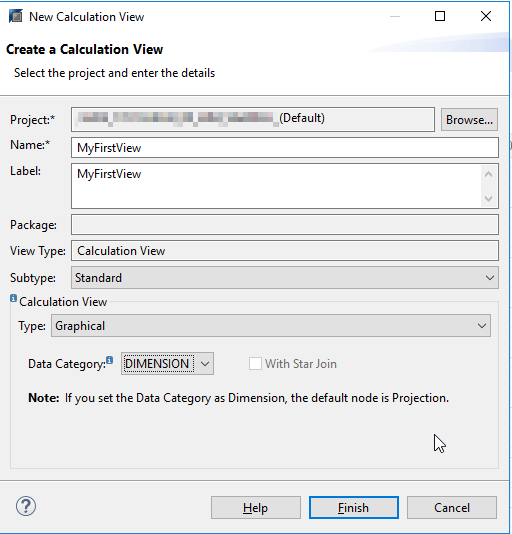
Step 9 :– Provide Name, Select Type as Graphical, Data Category as Dimension and click on Finish.
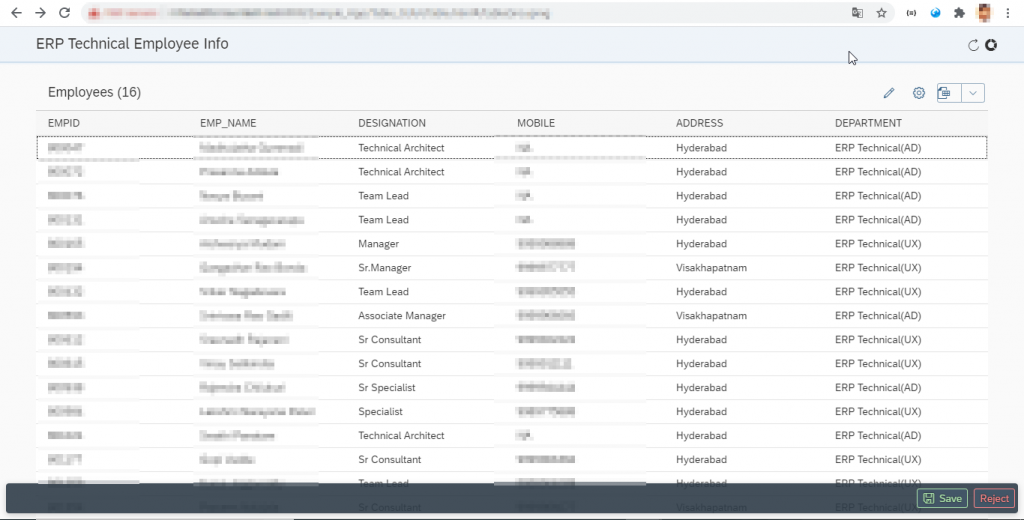
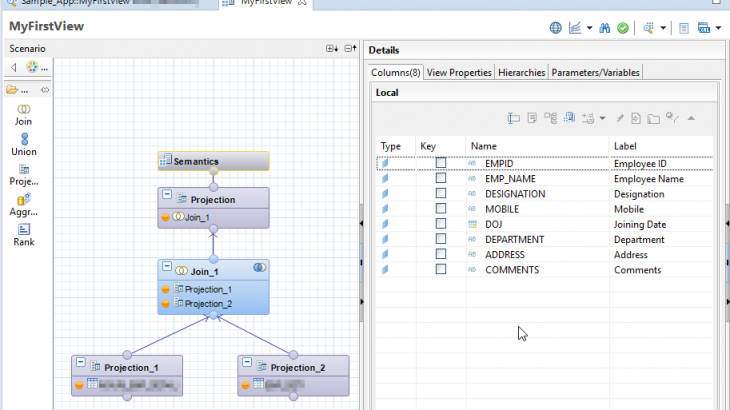
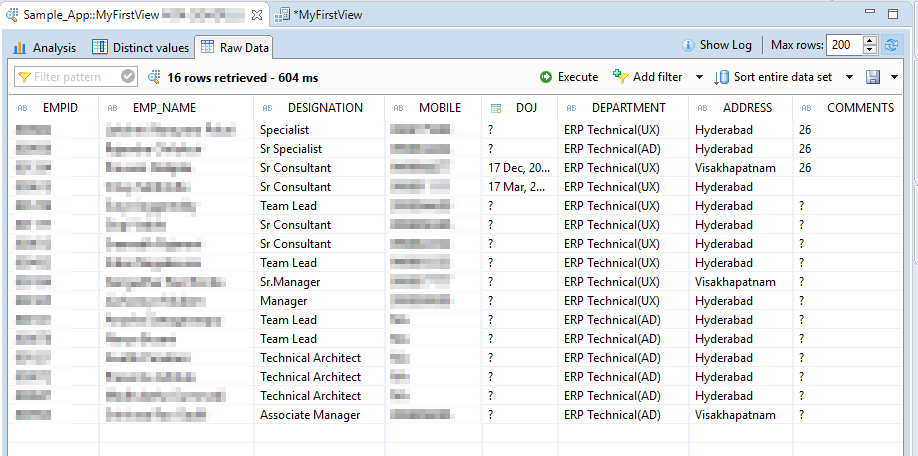
Step 10 :- Design calculation view to join two tables and get the result. To see the output right click on Semantics and select Data Preview.
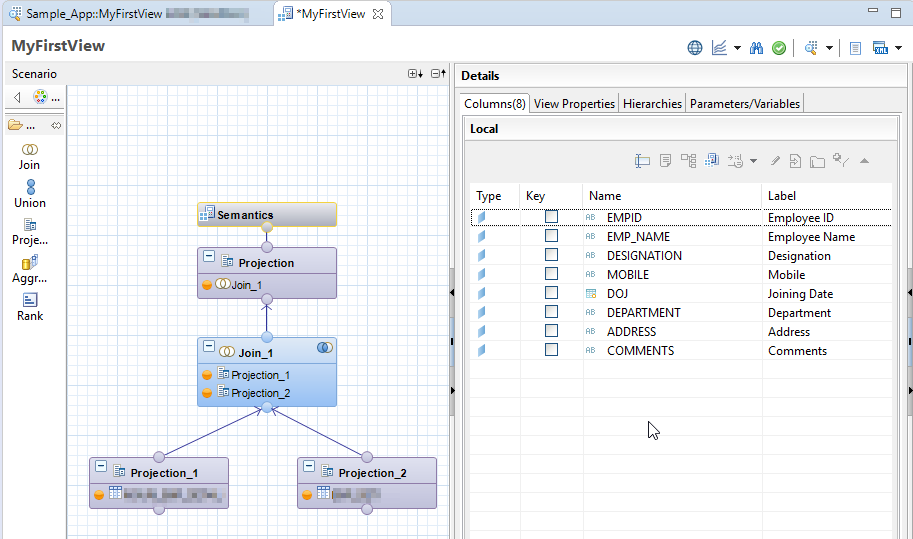
Step 11 :- Output results is ready. Now we need to expose this data to front-end application by using xsodata/xsjs services.
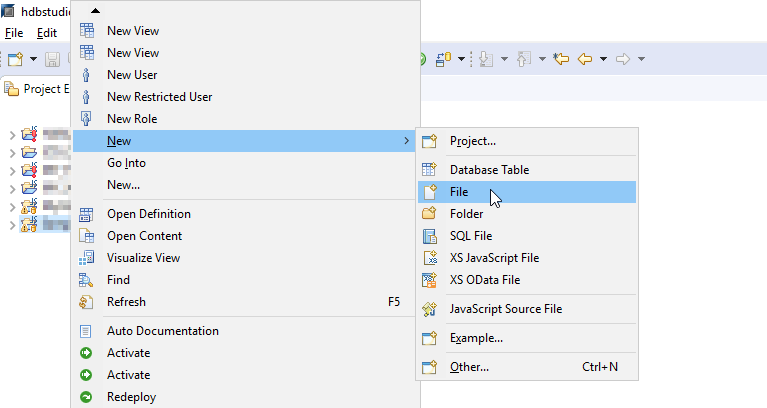
Step 12 :- Right click on Project (Sample_App) select New->File.
Follow the Step 12. create MyEmp.xsjs file with below code. In MyEmp.xsjs file i am going to expose department wise employee count. It return the single Object.
/*----------------------------------------------------------------------------------------------------------------
Purpose: Service Side Java Script
----------------------------------------------------------------------------------------------------------------*/

function Employee_Count(){

	var sqlstmt;
	var sqlstmt2;
	var conn;
	conn = $.db.getConnection();
	var oUser = $.session.getUsername();

	sqlstmt = "SELECT COUNT (DISTINCT \"EMPID\") FROM \"Schema Name\".\"Sample_App/MyFirstView\" WHERE
                   DEPARTMENT IN ('ERP Technical(AD)')";
	sqlstmt2 = "SELECT COUNT (DISTINCT \"EMPID\") FROM \"Schema Name\".\"Sample_App/MyFirstView\" WHERE
                   DEPARTMENT IN ('ERP Technical(UX)')";

	var num = 0;
	var num2 = 0;
	var outputCount = 0;
	var outputCount2 = 0;

	var pstmt = null;
	var pstmt2 = null;
	var rs = null;
	var rs2 = null;
	try {
		pstmt = conn.prepareStatement( sqlstmt );
		$.trace.fatal( sqlstmt );
		rs = pstmt.executeQuery();
		while ( rs.next()) {
			num = Number(rs.getString(1));
			}
		rs.close();
		pstmt.close();

	} catch ( e ) {
		if ( rs !== null ) {
			rs.close();
		}
		if ( pstmt !== null ) {
			pstmt.close();
		}
		$.trace.fatal( e );
	}

	try {
		pstmt2 = conn.prepareStatement( sqlstmt2 );
		$.trace.fatal( sqlstmt2 );
		rs2 = pstmt2.executeQuery();
		while ( rs2.next()) {
			num2 = Number(rs2.getString(1));
			}
		rs2.close();
		pstmt2.close();

	} catch ( e ) {
		if ( rs2 !== null ) {
			rs2.close();
		}
		if ( pstmt2 !== null ) {
			pstmt2.close();
		}
		$.trace.fatal( e );
	}

	var body = {};
	if (num > 0) {
		outputCount = num;
		outputCount2 = num2;
		}
	else{
		outputCount = 0;
		outputCount2 = 0;
	}
	body = //JSON.stringify(
	{"d":
	{
	UserExp: outputCount2,
	ApplDev: outputCount,
	UserName:oUser
	}};

	return body;


}

$.trace.fatal( "========== BEGIN ==========" );

var result = [];

try {
	var conn = $.db.getConnection();
	result = Employee_Count();
	conn.close();
} catch ( e ) {
	$.trace.fatal( e );
}
var output = {};
output = result;
$.response.contentType = 'application/json';
$.response.setBody( JSON.stringify( output ) );
$.trace.fatal( "=========== END ===========" );
Follow the Step 12 create MyService.xsodata to fetch data from database objects and expose to UI. In MyService.xsodata i am going to expose employee details Emp_Details2 is EntitySet.
service {
"Schema Name"."Sample_App/MyFirstView" as "Emp_Details2" keys("EMPID");
}
annotations {
enable OData4SAP;
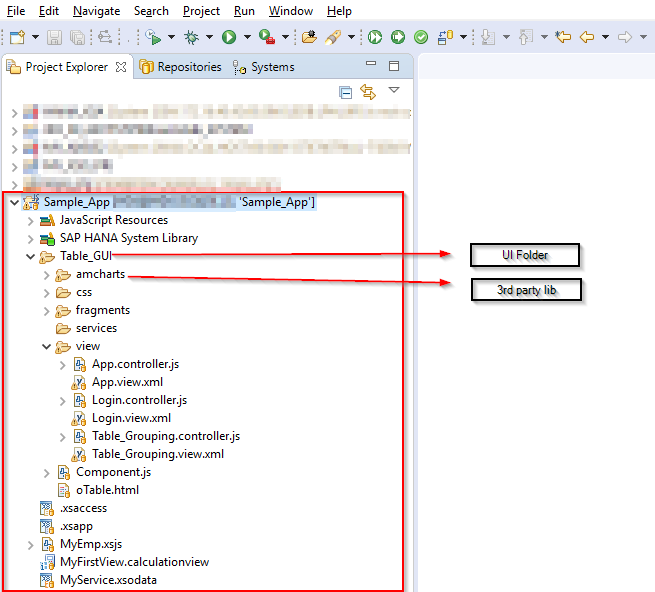
}Step 13 :- Create the UI folder with following structure. In my example i have used third party library(AmCharts) for data visualization.
Step 14 :- Use the above xsodata and xsjs services in front-end application.
xml view code:
<core:View xmlns:core="sap.ui.core" xmlns:mvc="sap.ui.core.mvc"
	xmlns="sap.m" xmlns:table="sap.ui.table" xmlns:comn="sap.ui.commons"
	xmlns:smartFilterBar="sap.ui.comp.smartfilterbar" xmlns:smartTable="sap.ui.comp.smarttable"
	xmlns:f="sap.f" displayBlock="true"
	controllerName="Sample_App.Table_GUI.view.Table_Grouping"
	xmlns:html="http://www.w3.org/1999/xhtml"
	xmlns:customData="http://schemas.sap.com/sapui5/extension/sap.ui.core.CustomData/1">
	<f:DynamicPage id="oDynamicPageId">
		<f:title>
			<f:DynamicPageTitle>
				<f:heading>
					<Title text="ERP Technical Employee Info" />
				</f:heading>
				<f:actions>
					<ToolbarSpacer />
					<core:Icon src="sap-icon://refresh" tooltip="Logout"
						noTabStop="true" press="onLogOutPress" />
					<core:Icon id="oExeId" src="sap-icon://donut-chart"
						tooltip="Visualization" noTabStop="true" />
				</f:actions>
			</f:DynamicPageTitle>
		</f:title>
		<f:content>
			<smartTable:SmartTable id="pricequoteTable"
			 smartFilterId="smartFilterBar"
			 beforeRebindTable="beforeRebindTable"
			 enableAutoBinding="true"
				entitySet="Emp_Details2" initialise="onSmartTableInit"
				tableType="ResponsiveTable" editTogglable="true" customData:useSmartField="true" showTablePersonalisation="true"
				fieldChange="onFieldChange" useExportToExcel="true" editable="false"
				useVariantManagement="true" useTablePersonalisation="true"
				 header="Employees" width="100%" height="100%"
				class="sapUiSizeCompact">
			</smartTable:SmartTable>
		</f:content>
		<f:footer>
			<OverflowToolbar>
				<ToolbarSpacer />
				<Button type="Accept" icon="sap-icon://save" text="Save"
					press="oSubmitChanges" />
				<Button type="Reject" text="Reject" press="onReject"/>
			</OverflowToolbar>
		</f:footer>
	</f:DynamicPage>
</core:View>
controller code:
jQuery.sap.require("sap.m.MessageBox");
sap.ui.controller("Sample_App.Table_GUI.view.Table_Grouping",{
onInit: function() {
					 var sURL, oModel, oView;
					  sURL = "/Sample_App/MyService.xsodata";
					 var oModel = new sap.ui.model.odata.v2.ODataModel(sURL);
					  oModel.setDefaultBindingMode("TwoWay");
					  var oView = this.getView();
					  oView.setModel(oModel);
					  var oTable = this.getView().byId("pricequoteTable");
					  oTable.setInitiallyVisibleFields("EMPID,EMP_NAME,DESIGNATION,MOBILE,ADDRESS,DEPARTMENT");
					this.oRouter = sap.ui.core.routing.Router.getRouter("appRouter");
					var oPage = this.getView().byId("oDynamicPageId");
					oPage.setShowFooter(!oPage.getShowFooter());
			},

			onSmartTableInit : function(oEvent){
			var oTable = oEvent.getSource().setShowRowCount(true);

			},
                        onAfterRendering : function(){
			var oTable = this.getView().byId("pricequoteTable");

				if(!oTable){

					 var oPersButton = oTable._oTablePersonalisationButton.attachPress(function(){

							var oPersController = oTable._oPersController;
					          var oPersDialog = oPersController._oDialog.fireReset();

						});
				}

				this.getView().byId("oExeId").attachPress(function(){

					sURL = "/Sample_App/MyEmp.xsjs";
					 var oModel = new sap.ui.model.odata.v2.ODataModel(sURL);
					 var uxArr = 0;
					 var adArr = 0;
					 $.get(sURL, function(data, status){
					adArr = data.d.ApplDev;
					uxArr = data.d.UserExp;
					var oPanel = new sap.m.Panel({ height:"500px", width:"100%"});
					var oId = oPanel.sId;
					var chart = AmCharts.makeChart(oId,{
					    "type": "pie",
					    "theme": "light",
					    "innerRadius": "40%",
					    "gradientRatio": [-0.4, -0.4, -0.4, -0.4, -0.4, -0.4, 0, 0.1, 0.2, 0.1, 0, -0.2, -0.5],
					    "dataProvider": [{
					        "Department": "ERP Technical(UX)",
					        "Count": uxArr
					    },
					    {
					        "Department": "ERP Technical(AD)",
					        "Count": adArr
					    }],
					    "balloonText": "[[value]]",
					    "valueField": "Count",
					    "titleField": "Department",
					    "balloon": {
					        "drop": true,
					        "adjustBorderColor": false,
					        "color": "#FFFFFF",
					        "fontSize": 16
					    },
					    "export": {
					        "enabled": true
					    }
					});
						this.resizableDialog = new sap.m.Dialog({
							title: 'Employee Details Visualization',
							contentWidth: "100%",
							contentHeight: "100%",
							resizable: true,
							draggable : true,
							content: oPanel,
							beginButton: new sap.m.Button({
								text: 'Close',
								press: function () {
									oPanel.destroyContent();
									this.resizableDialog.destroy();
								}.bind(this)
							})
						});
						this.resizableDialog.open();
						chart.write(oId);
//					 }});
					 });
				});
			},

			oSubmitChanges : function(){
				var oTable = this.getView().byId("pricequoteTable");
				var changesFlag = this.getView().getModel().hasPendingChanges();
				if(changesFlag){
				oTable.setEditable(false);
				this.getView().getModel().submitChanges({success:function(){
					sap.m.MessageToast.show("Successfully submitted");
				}});
				}else{
					sap.m.MessageToast.show("No pending changes to submit");
				}
			},

			onReject:function(){
				var oTable = this.getView().byId("pricequoteTable");
				oTable.setEditable(false);
				this.getView().getModel().resetChanges();
			}
});
Here is the output: Once we click on top right corner icon(donut). Visual chart will be appear on dialog with department wise employee count.