Introduction
With 1911, SAP introduces the seamless integration of S/4HANA Cloud with SAP Analytics Cloud (SAC).
Here are lists of new capabilities in SAP S/4HANA Cloud:
- State-of-the-art multidimensional reporting using the SAC Data Analyzer tool
Data Analyzer, a ready-to-run service for analytical queries, is integrated into SAP S/4HANA to provide an ad hoc query analysis experience to the end user. With Data Analyzer, you can visualize and report on analytical queries in SAP Analytics Cloud without model creation. Instead the designer uses analytical queries as they are. You can analyze the information instantly.
- Pre-delivered dashboards (aka Stories).
- Create own custom dashboards using SAP Analytics Cloud’s rich visualisation capabilities.
- Create own custom reports using SAP Analytics Cloud’s Data Analyzer Report tool.
In this blog, I would like to focus on the creation of the custom report.
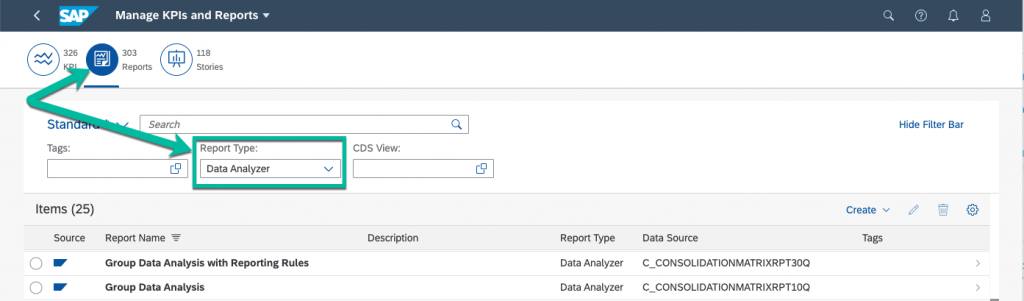
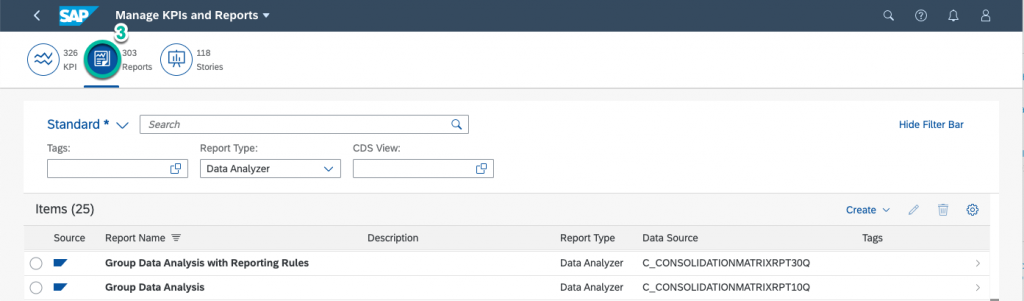
Key user (aka Analytics Specialist) will able to create own dashboards directly within S/4HANA Cloud. The designtime app ‘Manage KPIs & Reports’ receives a new report type called “Data Analyzer” under the “Reports” tab.
Creating a Data Analyzer Report
The Create Data Analyzer page lets you define SAP Analytic Cloud data analyzer report for a selected data source.
Navigate to KPI Design group in the Fiori Launchpad (FLP).
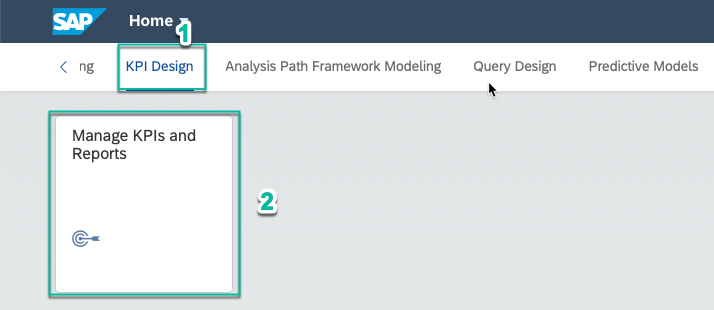
Choose “Reports” tab from the Manage KPIs and Reports app page.
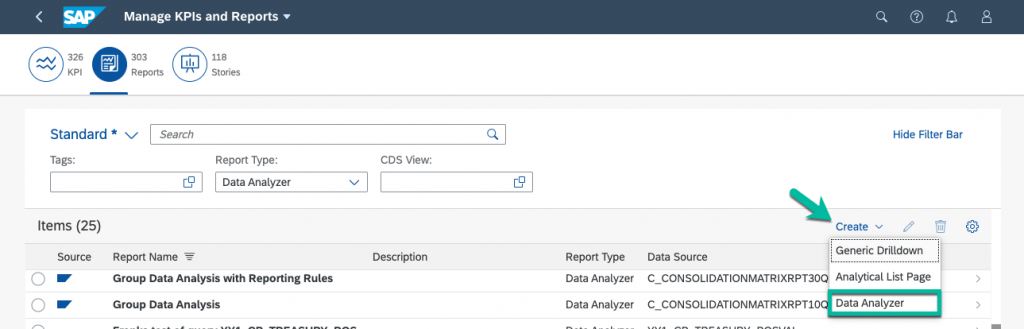
To create a custom data analyzer report, choose Create > Data Analyzer.
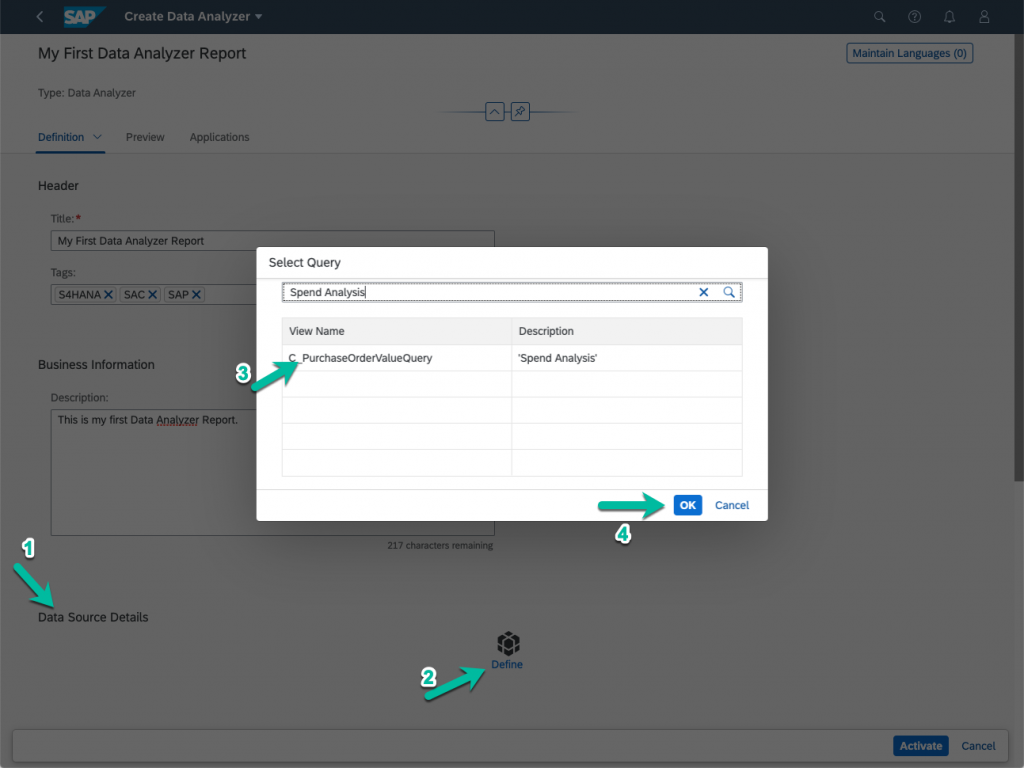
The Create Story page appears. In the Definition tab, enter the title in the Header section and description in Business Information section.
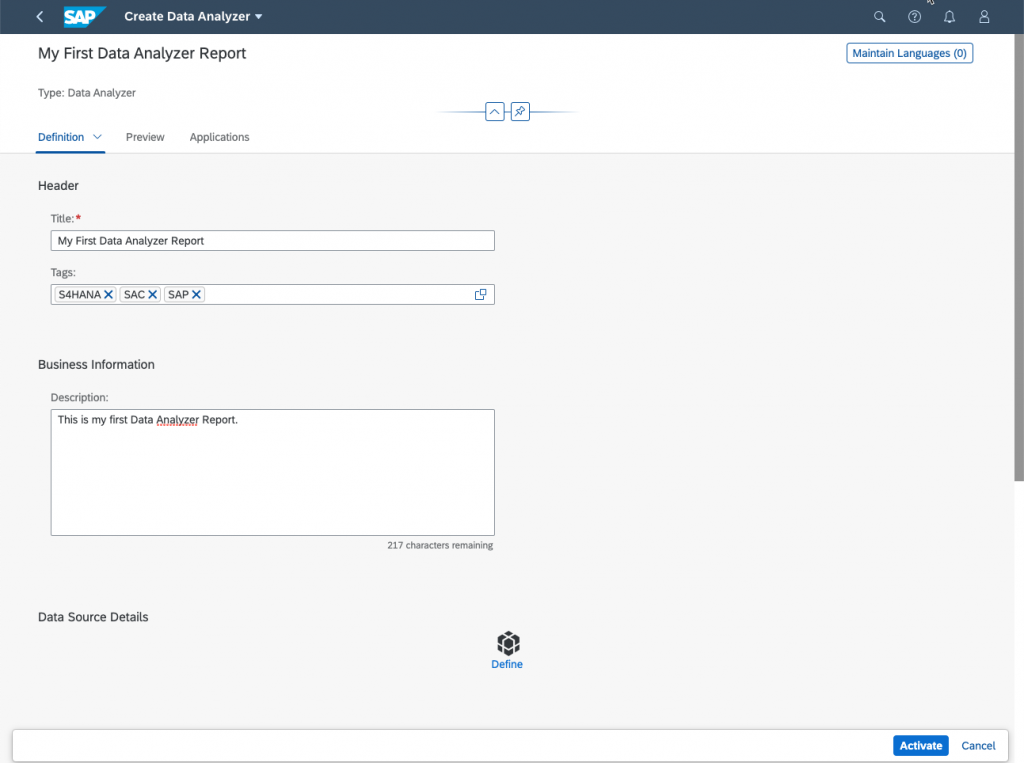
Go to Data Source Details section tab and click on Define link to select a query from the list to build the report.
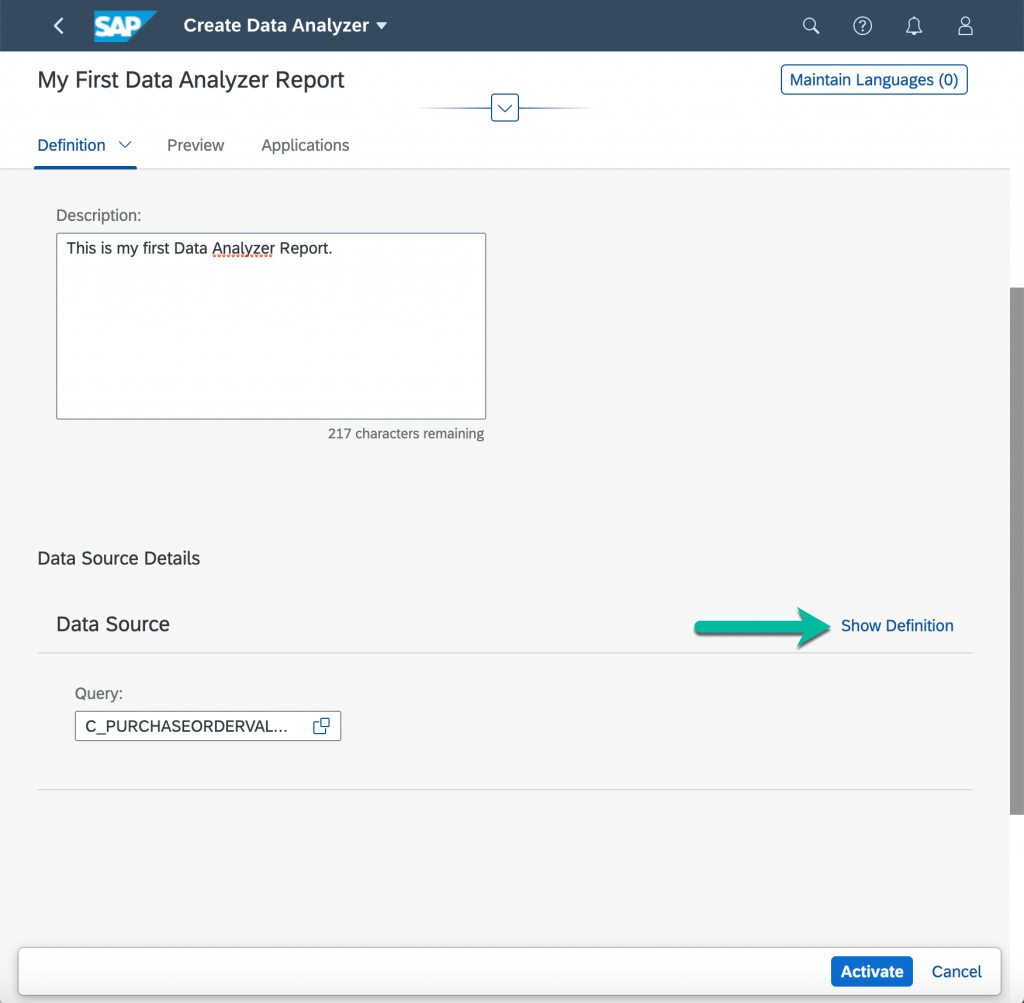
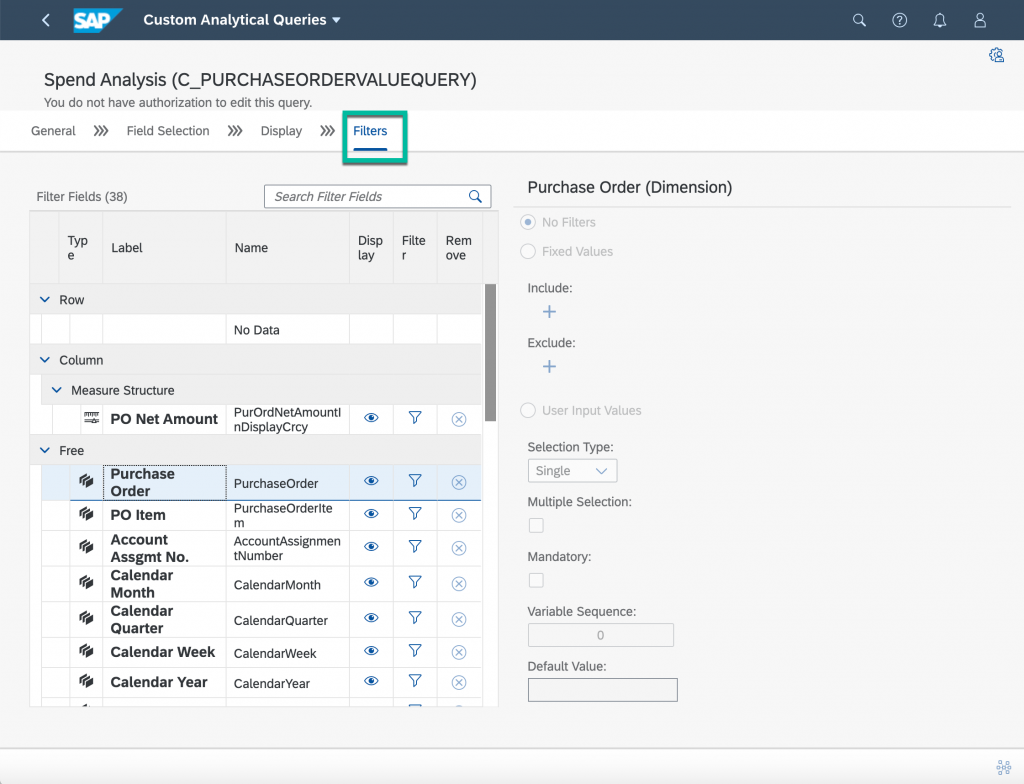
You can visualise the definition of the query using “Show Definition” button.
“Show Definition” functionality is part of 2002 deliverables.
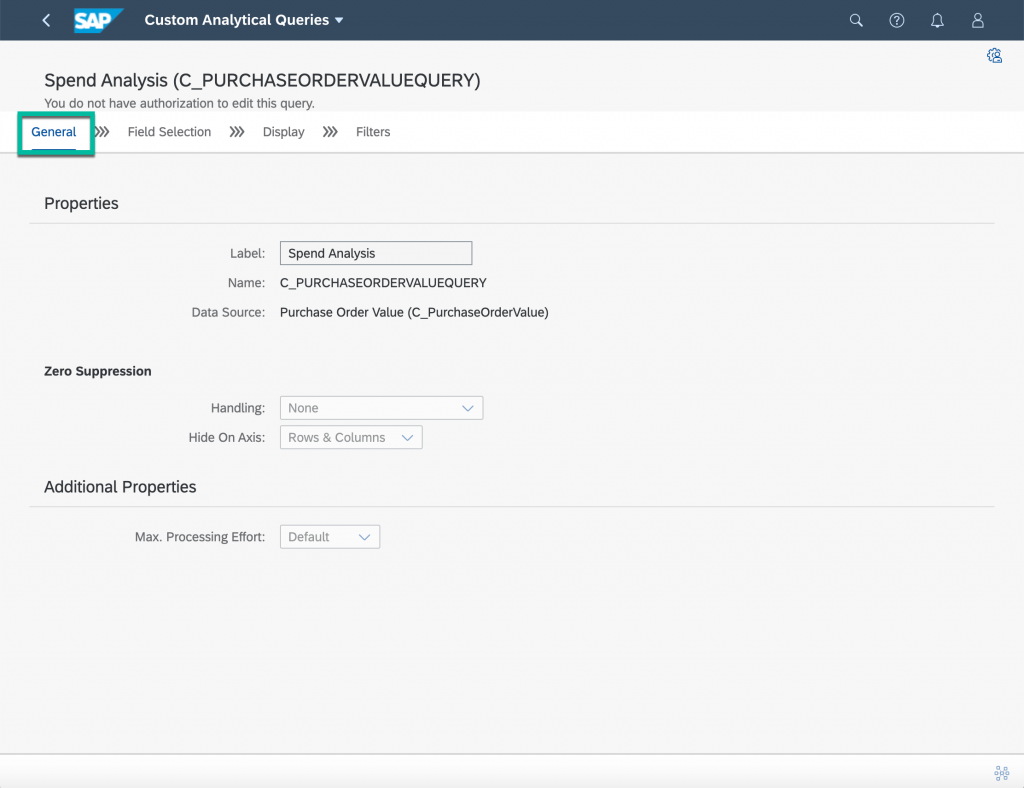
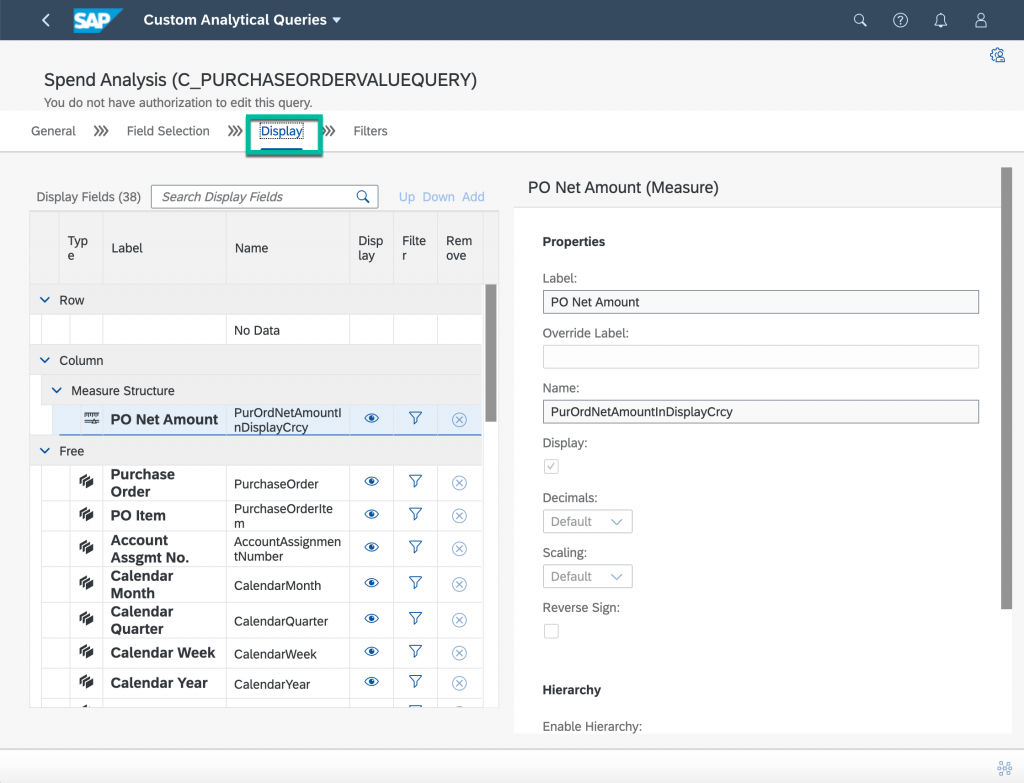
This will open the Query Definition via the app “Custom Analytical Queries“.

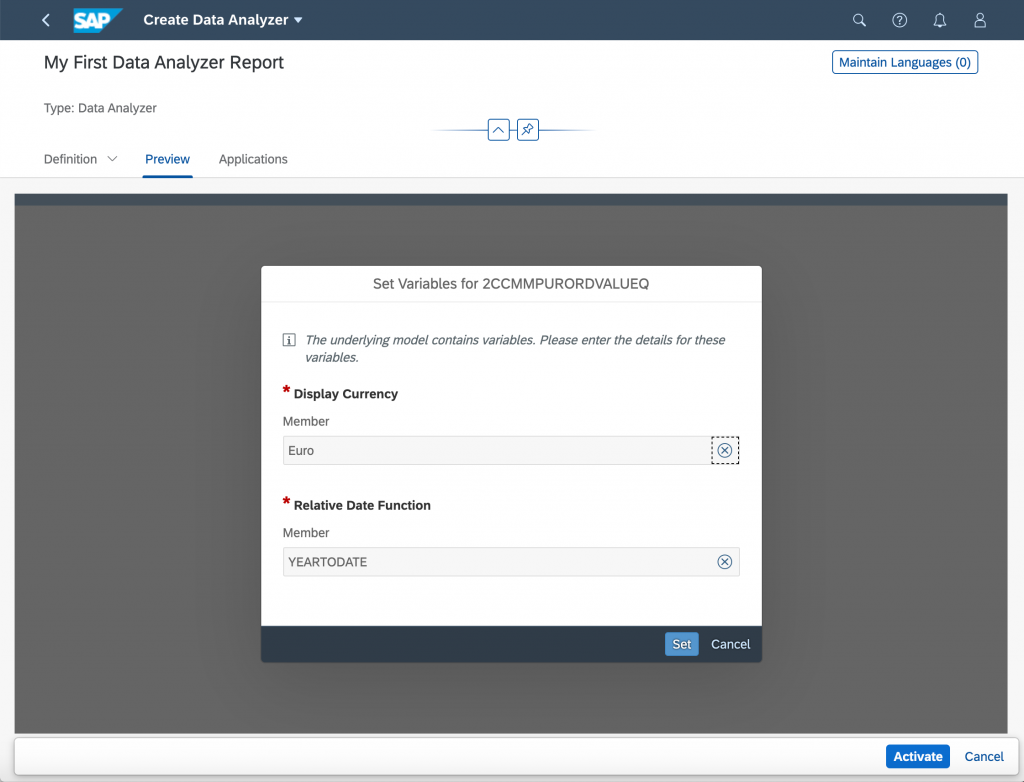
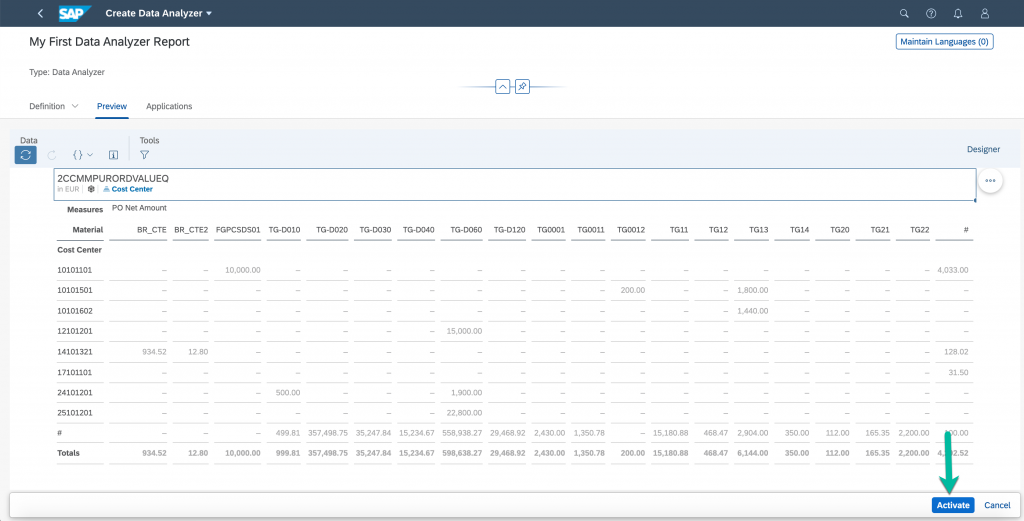
To preview the selected query in Data Analyzer, select the tab “Preview“. If there are mandatory parameters and filters, “Set Variables” dialog box appears wherein you have to enter or choose the values to the input parameters of the selected datasource.
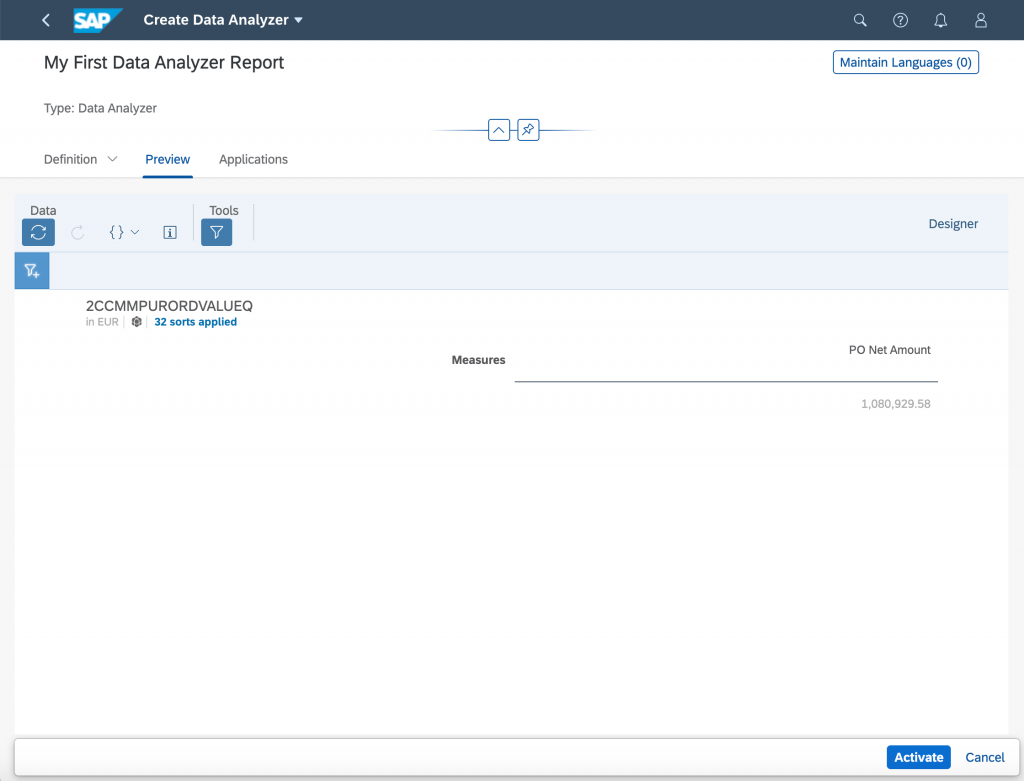
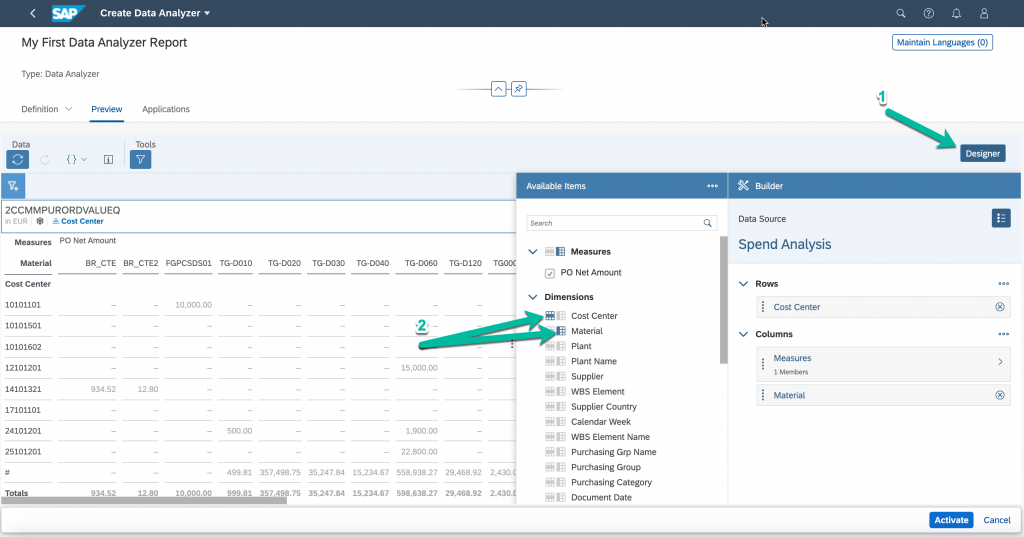
Use the “Designer” button to enable the Data Analyzer report builder.
But here this is just preview to give a glimpse how the report can be visualised and configured once the application is published.
To save the base report, select “Activate“.
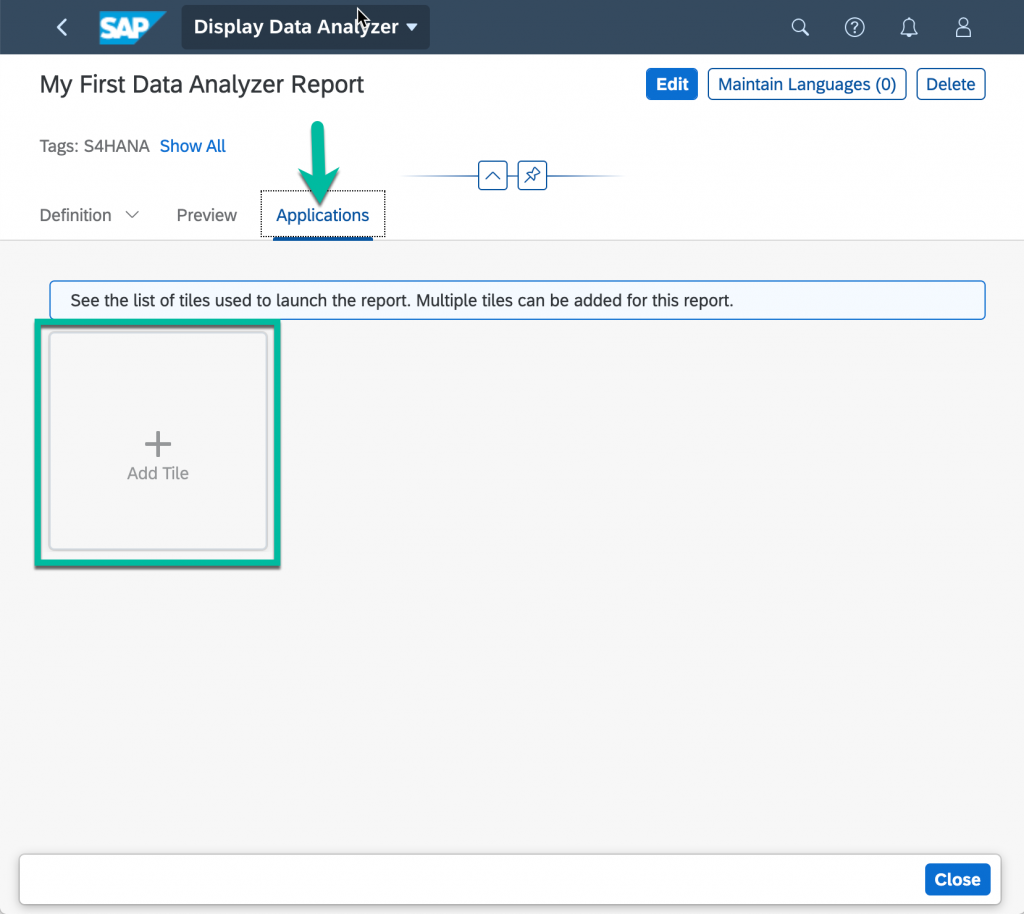
To create an application (aka FLP Tile) to launch the Data Analyzer report, choose Applications > Add Tile.
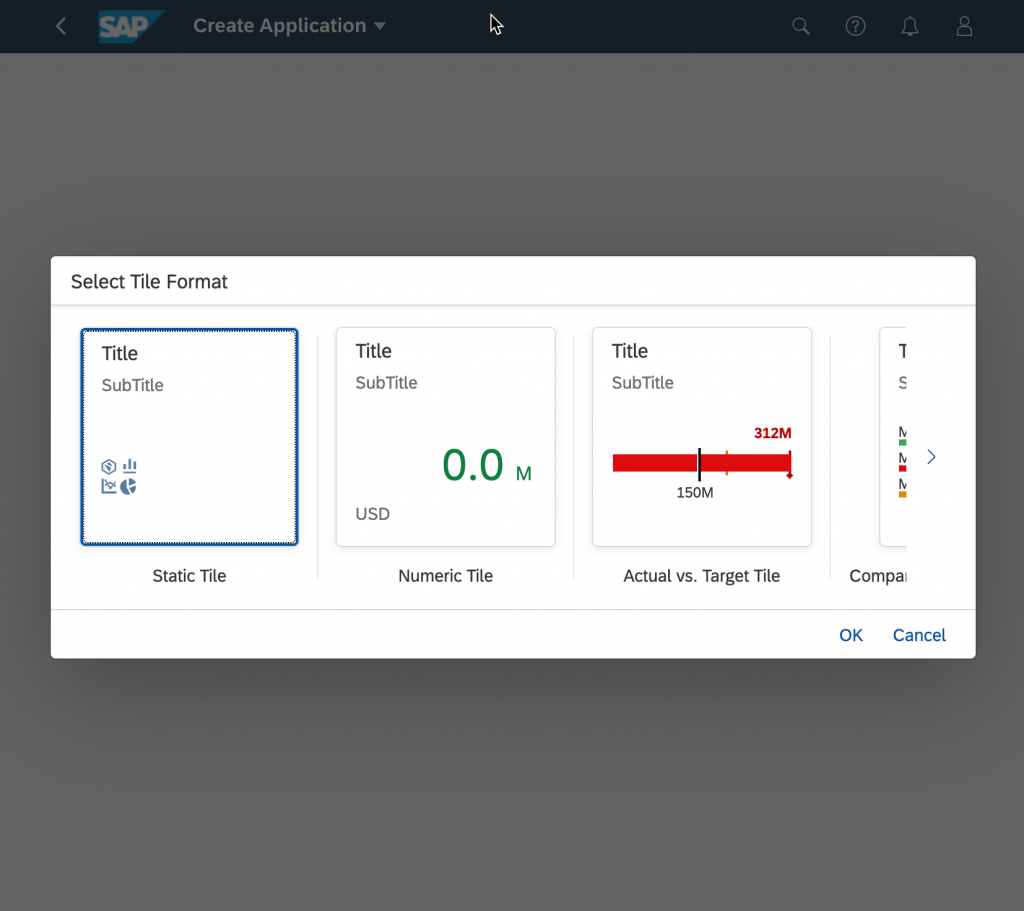
Choose a Tile Type format from the various options.
Fill out all the details and click on “Save and Publish“.
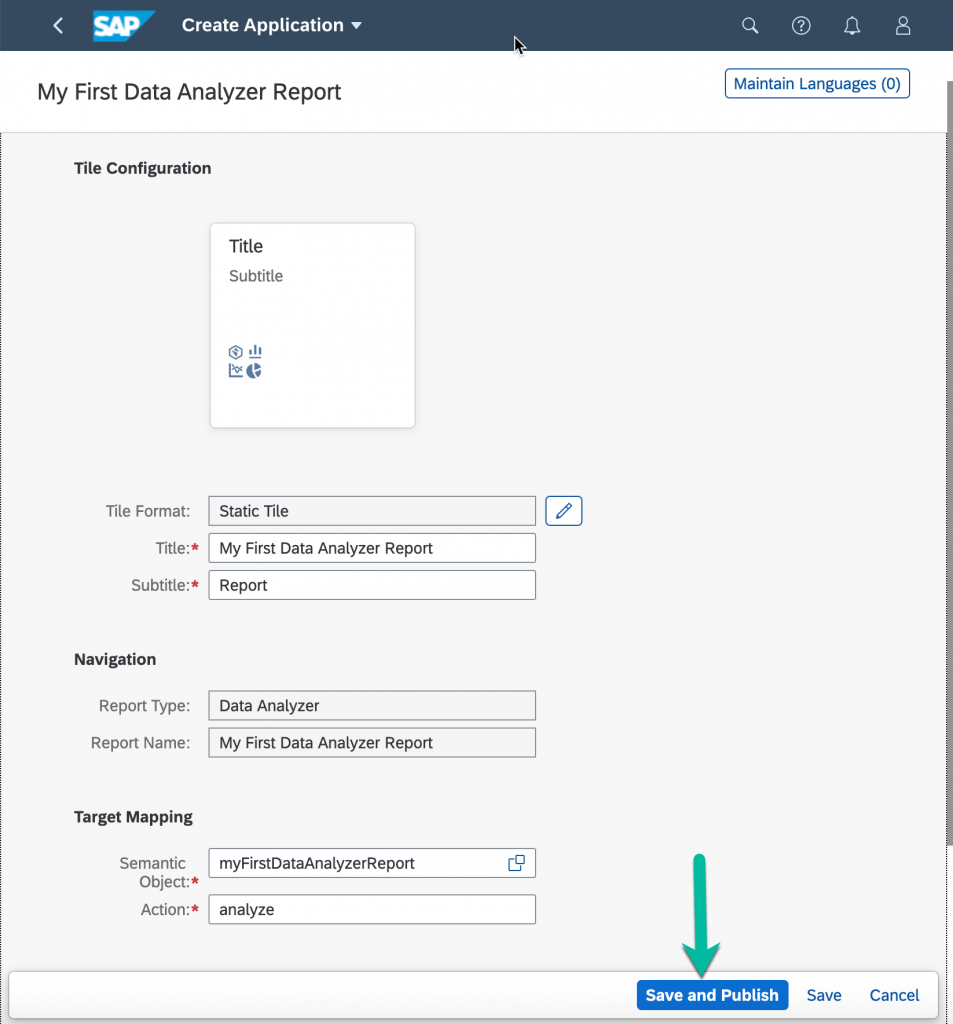
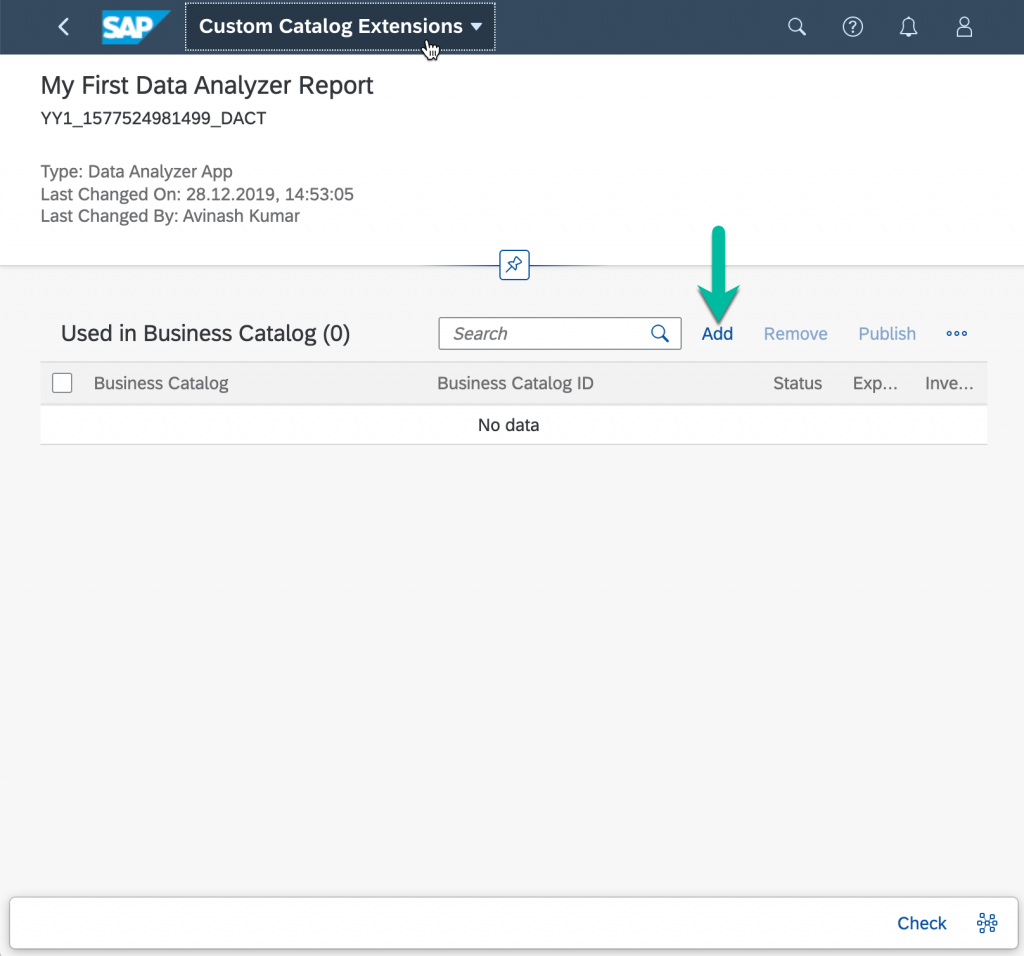
After successful save of the tile, it will navigate to “Custom Catalog Extension” app to publish a tile in the desired catalog.
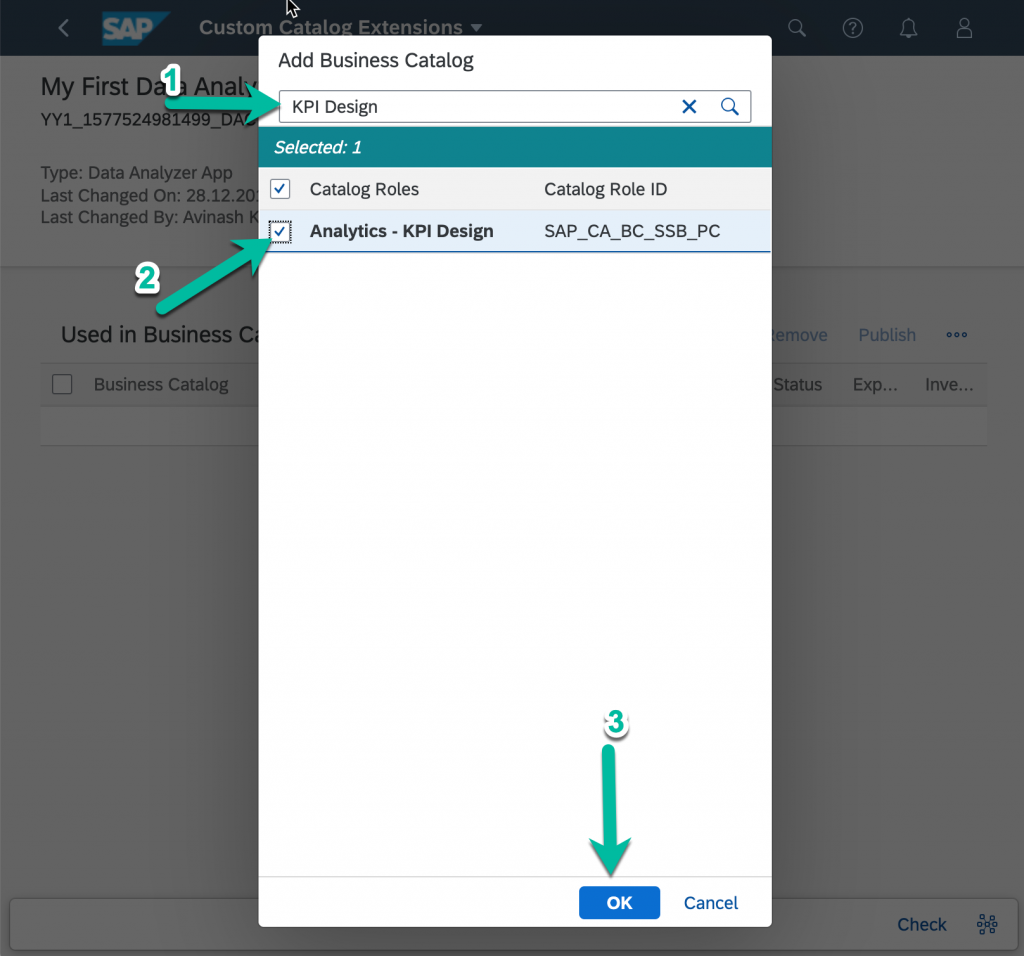
In “Custom Catalog Extension” App, add a catalog to publish the tile.
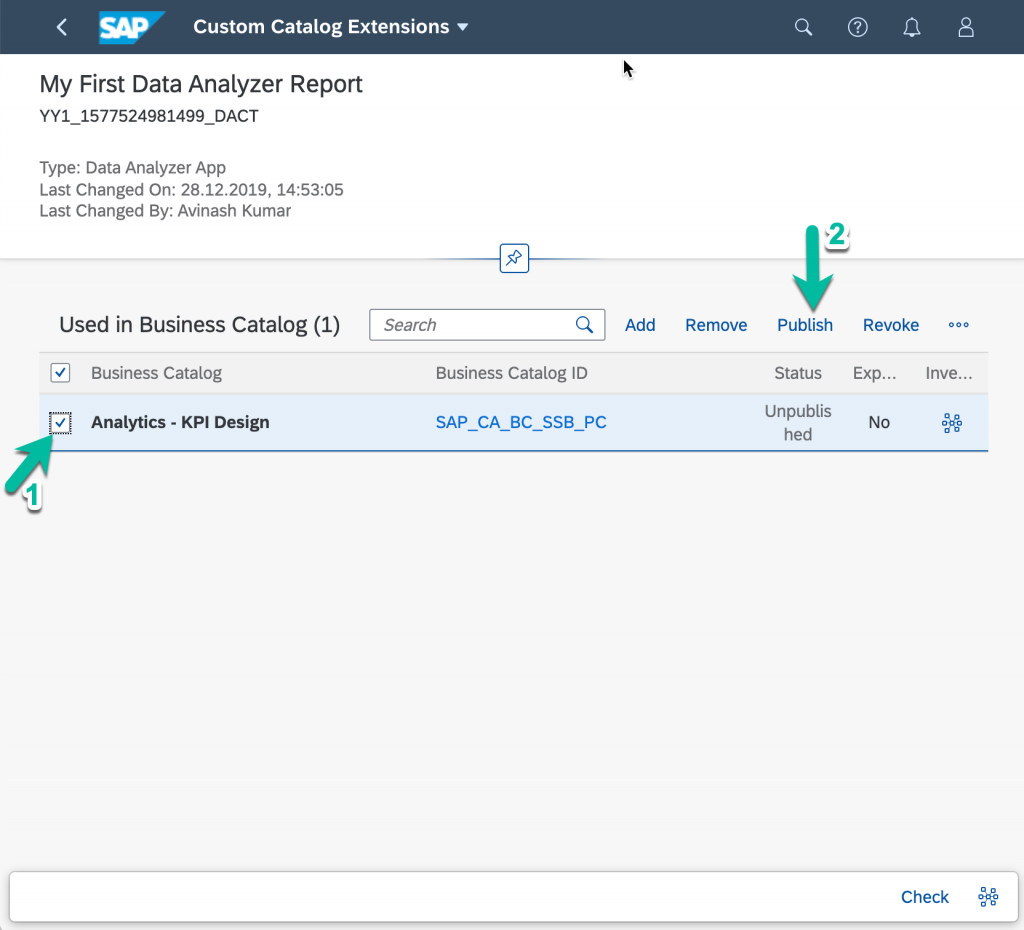
Publish the tile.
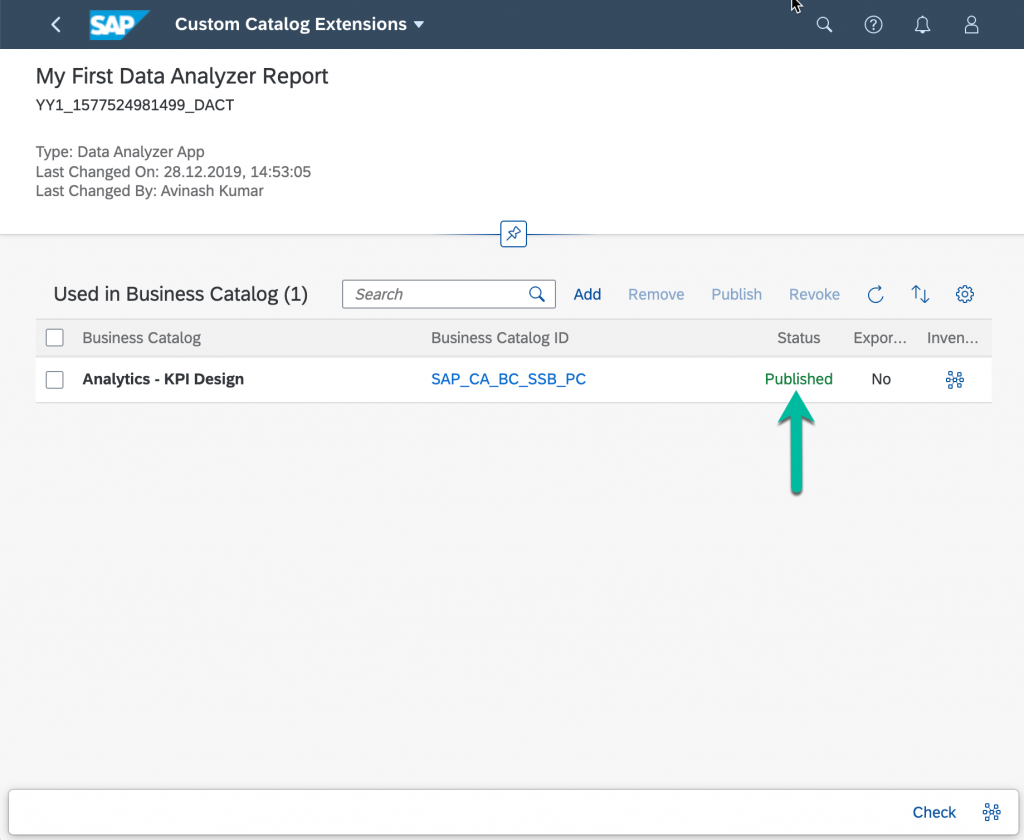
On successful publish, the tile will be available on the Fiori Launchpad.
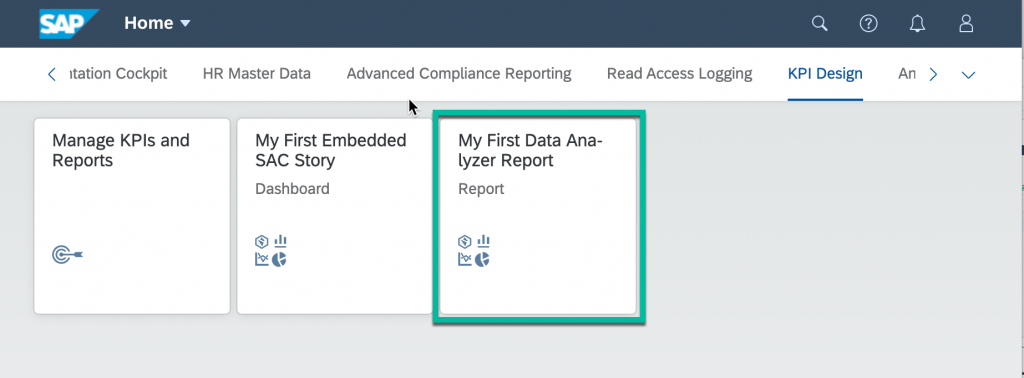
Click the tile to launch the story in the Fiori Launchpad.
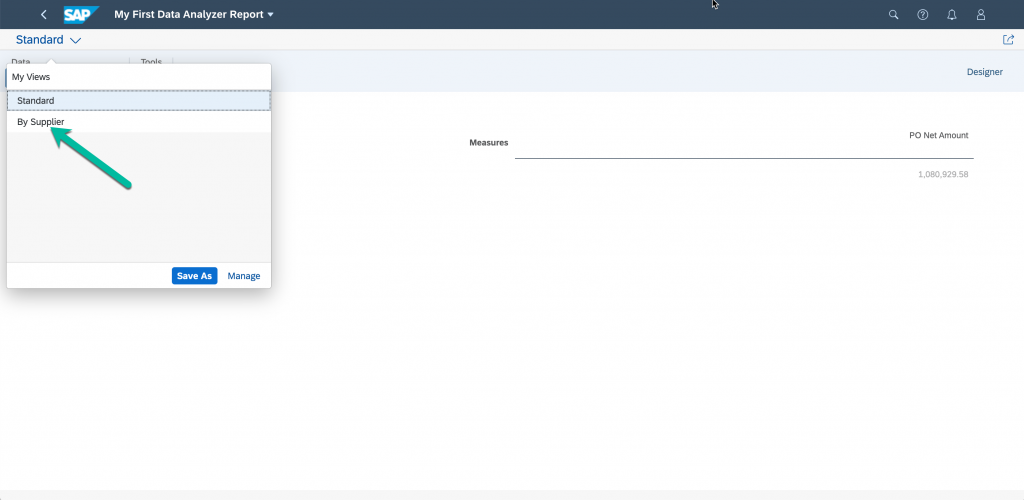
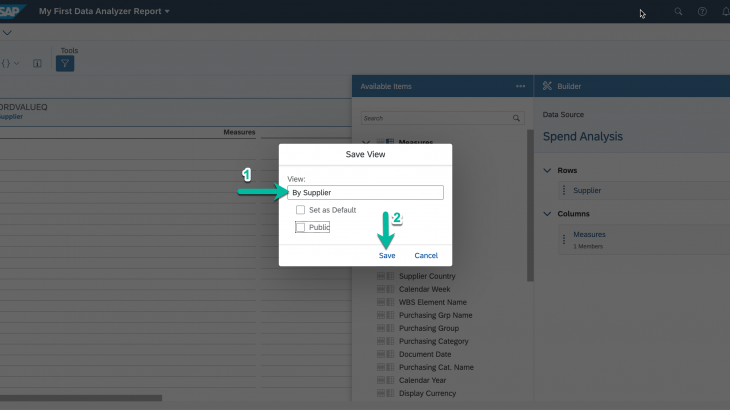
Now we will configure the first report variant, and here you can create as many variants you want according to the requirement.
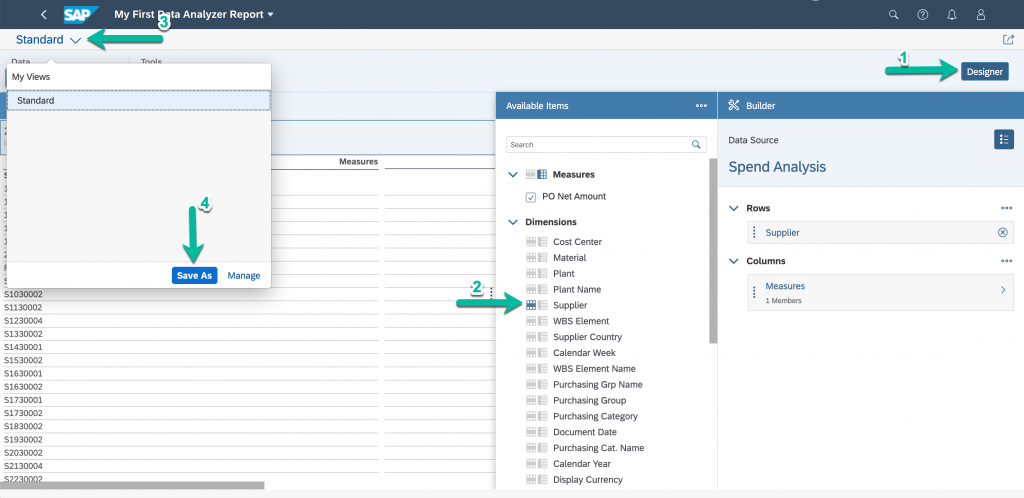
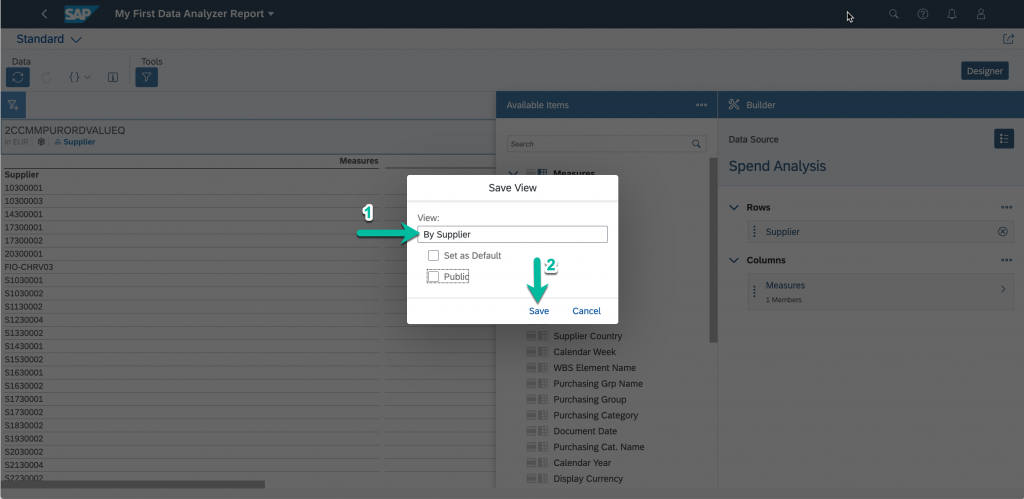
And sharing the variants between users and switching between the shared variant and local variant can be done via Fiori Variant Management control. You can set the variant as default to apply the variant on the launch of data analyzer report.
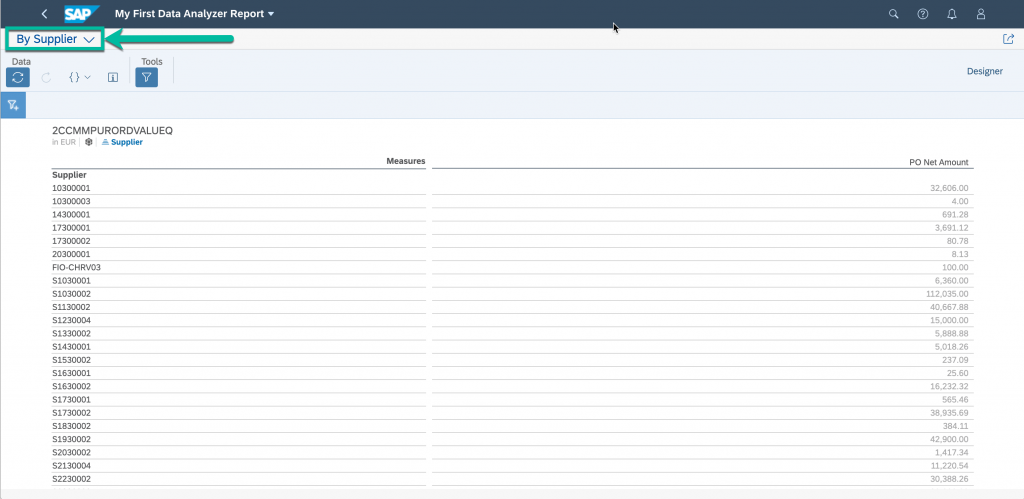
After successful save launch the Data Analyzer report again from the FLP via tile.