Many SAP customers use SAP Analytics Cloud (SAC) for self-service BI. SAC also offers additional capabilities that help decision makers understand the current state of the data, so they make a more informed decision. This includes planning and other predictive capabilities that are built in. SAC has the ability to connect to HANA and S/4HANA on-premise or in the cloud using built in connectors. SAC also offers the ability to display spatial data in a variety of forms to help provide more insights. This includes geometries in ArcGIS Enterprise and ArcGIS Online which are displayed as read-only (non-interactive). What if the target users for an SAC story or analytic app need more spatial analytics, editing or other capabilities, specifically the advanced spatial analytics that ArcGIS Enterprise and Online offer?
This blog describes how my colleague Phil Hombledal and I were able to embed an ArcGIS web map inside of an SAC analytic app as a custom widget. The analytic app and the web map can interact with each other – actions taken by the user in the analytic app determine what is displayed in the web map and data from the web map can be fed back to the analytic app. Better yet, based on what the designer of the SAC analytic app built into the web map, the SAC user can seamlessly access full ArcGIS Enterprise capabilities. For example, a customer service rep using the analytic app could perform a network trace using the ArcGIS utility network from inside the analytic app and tell a customer if they will be affected by scheduled equipment repair.
Here is a screenshot of the custom widget in a simple SAC analytic app:
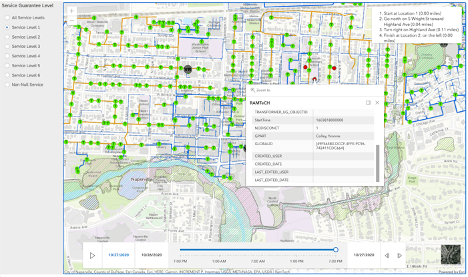
You may recognize the web map – it is part of an end-to-end ArcGIS – SAP Analytics cloud use case for notifying utility customers that flooding may impact their service. It shows the power of leveraging SAP BTP and ArcGIS Enterprise together.
This particular analytic app shows which customers will be affected as predicted flooding inundates different pad transformers and shows which customers have a guarantee of service.
To build a custom widget, you write the JavaScript code that displays the widget, a .json file that describes the widget code and, optionally, code that supports a settings panel within SAC for the widget. All three are in a GitHub repository you can access (see below). The widget code itself must be served up over https from an internet accessible web server. A quick and dirty way to accomplish this is to use GitHub and use GitHub to serve up your JavaScript code. This isn’t suitable for production but works just fine when you’re building and testing your widget.
Below is an edited JavaScript file showing the key modules and placement of statements for the ArcGIS JavaScript API. This code accesses a web map from an ArcGIS Enterprise instance on the internet. The next project is adding authentication to ArcGIS Enterprise.
The first file is the widget source code itself. The second JavaScript file is for the settings panel displayed in SAC where you can input the ArcGIS API key and the URL to your ArcGIS Enterprise (or Online) Portal. The third file is the one that SAC reads to create your custom widget. Please grab the code from the 3 URLs above as we may have made improvements to the code since this blog was written. We include it here for convenience.
You can obtain an ArcGIS API key by signing up for an ArcGIS Developer account (that comes with some credits at no charge) at https://developers.arcgis.com. You can then create an API key, and give it access to ArcGIS location services. This particular widget uses a web map published to an ArcGIS Enterprise instance on the web. You can use a web map published to ArcGIS Online instead.
(function() {
    let template = document.createElement("template");
    var gPassedServiceType; // holds passed in guarantee of service - set in onCustomWidgetBeforeUpdate()
    var gPassedPortalURL; //ESRI Portal URL
    var gPassedAPIkey; //ESRI JS api key
    var gWebmapInstantiated = 0; // a global used in applying definition query
    var gMyLyr; // for sublayer
    var gMyWebmap; // needs to be global for async call to onCustomWidgetAfterUpdate()

    template.innerHTML = `
        <link rel="stylesheet" href="https://js.arcgis.com/4.18/esri/themes/light/main.css">
        <style>
        #mapview {
            width: 100%;
            height: 100%;
        }
        #timeSlider {
            position: absolute;
            left: 5%;
            right: 15%;
            bottom: 20px;
        }
        </style>
        <div id='mapview'></div>
        <div id='timeSlider'></div>
    `;

    // this function takes the passed in servicelevel and issues a definition query
    // to filter service location geometries
    //
    // A definition query filters what was first retrieved from the SPL feature service
    function applyDefinitionQuery() {
        var svcLyr = gMyWebmap.findLayerById( 'NapervilleElectric_MIL1_6627' );
        console.log( "Layer is");
        console.log( svcLyr);

        // make layers visible
        svcLyr.visible = true;

        // only execute when the sublayer is loaded. Note this is asynchronous
        // so it may be skipped over during execution and be executed after exiting this function
        svcLyr.when(function() {
            gMyLyr = svcLyr.findSublayerById(6);    // store in global variable
            console.log("Sublayer loaded...");
            console.log( "Sublayer is");
            console.log( gMyLyr);

            // force sublayer visible
            gMyLyr.visible = true;

            // run the query
            processDefinitionQuery();
        });
    };

    // process the definition query on the passed in SPL feature sublayer
    function processDefinitionQuery()
    {
        // values of passedServiceType
        // 0, 1 - no service levels. Only show service locations without a guarantee of service (GoS)
        //     Note that 0 is passed in when the widget is initialized and 1 on subsequent times
        // 2 - return any service location with a GoS = 1
        // 3 - GoS = 2
        // 4 - GoS = 3
        // 5 - GoS = 4
        // 6 - GoS = 5
        // 7 - GoS = 6
        // 8 (default) - return all service levels
        if (gPassedServiceType <= 1) { // display all service locations
            gMyLyr.definitionExpression = "1 = 1"
        } else if (gPassedServiceType === 2) { // display GoS = 1
            gMyLyr.definitionExpression = "NODISCONCT = '1'";
        } else if (gPassedServiceType === 3) { // display GoS = 2
            gMyLyr.definitionExpression = "NODISCONCT = '2'";
        } else if (gPassedServiceType === 4) { // display GoS = 3
            gMyLyr.definitionExpression = "NODISCONCT = '3'";
        } else if (gPassedServiceType === 5) { // display GoS = 4
            gMyLyr.definitionExpression = "NODISCONCT = '4'";
        } else if (gPassedServiceType === 6) { // display GoS = 5
            gMyLyr.definitionExpression = "NODISCONCT = '5'";
        } else if (gPassedServiceType === 7) { // display GoS = 6
            gMyLyr.definitionExpression = "NODISCONCT = '6'";
        } else { // default is to only display service locations with a set GoS
            gMyLyr.definitionExpression = "NODISCONCT IN ('1', '2', '3', '4', '5', '6')";
        }
    }

    class Map extends HTMLElement {
        constructor() {
            super();

            //this._shadowRoot = this.attachShadow({mode: "open"});
            this.appendChild(template.content.cloneNode(true));
            this._props = {};
            let that = this;

            require([
                "esri/config",
                "esri/WebMap",
                "esri/views/MapView",
                "esri/widgets/BasemapToggle",
                "esri/layers/FeatureLayer",
                "esri/widgets/TimeSlider",
                "esri/widgets/Expand",
                "esri/tasks/RouteTask",
                "esri/tasks/support/RouteParameters",
                "esri/tasks/support/FeatureSet",
                "esri/layers/support/Sublayer",
                "esri/Graphic",
                "esri/views/ui/UI",
                "esri/views/ui/DefaultUI"
            ], function(esriConfig, WebMap, MapView, BasemapToggle, FeatureLayer, TimeSlider, Expand, RouteTask, RouteParameters, FeatureSet, Sublayer, Graphic) {

                // set portal and API Key
                esriConfig.portalUrl = gPassedPortalURL

                //  set esri api Key
                esriConfig.apiKey = gPassedAPIkey

                // set routing service
                var routeTask = new RouteTask({
                    url: "https://route-api.arcgis.com/arcgis/rest/services/World/Route/NAServer/Route_World"
                });

                // replace the ID below with the ID to your web map
                const webmap = new WebMap ({
                    portalItem: {
                        id: "75c9b28832d54f64af949c318faba2ed"
                    }
                });

                gMyWebmap = webmap;  // save to global variable

                const view = new MapView({
                    container: "mapview",
                    map: webmap
                });

                // time slider widget initialization
                const timeSlider = new TimeSlider({
                    container: "timeSlider",
                    view: view
                });

                // set on click for directions
                view.on("click", addStop);

                function addGraphic(type, point) {
                    var graphic = new Graphic({
                        symbol: {
                            type: "simple-marker",
                            color: type === "start" ? "white" : "black",
                            size: "8px"
                        },
                        geometry: point
                    });

                    view.graphics.add(graphic);
                }

                function addStop( event) { // no code here
                    // here neither
                    if (view.graphics.length === 0) {
                        addGraphic("start", event.mapPoint);
                    } else if (view.graphics.length === 1) {
                        addGraphic("finish", event.mapPoint);
                        getRoute();
                    } else {
                        view.graphics.removeAll();
                        addGraphic("start", event.mapPoint);
                    }
                };

                function getRoute() {
                    // Setup the route parameters
                    var routeParams = new RouteParameters({
                        stops: new FeatureSet({
                            features: view.graphics.toArray() // Pass the array of graphics
                        }),
                        returnDirections: true
                    });

                    // Get the route
                    routeTask.solve(routeParams).then( showRoute);
                }

                function showRoute( data)
                {
                    // Display the route

                    data.routeResults.forEach(function (result) {
                        result.route.symbol = {
                            type: "simple-line",
                            color: [5, 150, 255],
                            width: 3
                        };
                        view.graphics.add(result.route);
                    });

                    // Display the directions
                    var directions = document.createElement("ol");
                    directions.classList = "esri-widget esri-widget--panel esri-directions__scroller";
                    directions.style.marginTop = 0;
                    directions.style.paddingTop = "15px";

                    // Show the directions
                    var features = data.routeResults[0].directions.features;
                    features.forEach(function (result, i) {
                        var direction = document.createElement("li");
                        direction.innerHTML =
                        result.attributes.text + " (" + result.attributes.length.toFixed(2) + " miles)";
                        directions.appendChild(direction);
                    });

                    // Add directions to the view
                    view.ui.empty("top-right");
                    view.ui.add(directions, "top-right");
                }

                view.when(function () {
                    view.popup.autoOpenEnabled = true; //disable popups
                    gWebmapInstantiated = 1; // used in onCustomWidgetAfterUpdate

                    // Create the basemap toggle
                    var basemapToggle = new BasemapToggle({
                        view:view,
                        nextBasemap: "satellite"
                    });


                    // Add the toggle to the bottom-right of the view
                    view.ui.add( basemapToggle, "bottom-right");

                    // should have been set in onCustomWidgetBeforeUpdate()
                    console.log( gPassedServiceType);

                    // find the SPL sublayer so a query is issued
                    applyDefinitionQuery();
                });

            }); // end of require()
        } // end of constructor()

        getSelection() {
            return this._currentSelection;
        }

        onCustomWidgetBeforeUpdate(changedProperties)
        {
            this._props = { ...this._props, ...changedProperties };
           // console.log(["Service Level",changedProperties["servicelevel"]]);

        }

        onCustomWidgetAfterUpdate(changedProperties)
        {
            if ("servicelevel" in changedProperties) {
                this.$servicelevel = changedProperties["servicelevel"];
            }
            gPassedServiceType = this.$servicelevel; // place passed in value into global

            if ("portalurl" in changedProperties) {
                this.$portalurl = changedProperties["portalurl"];
            }
            gPassedPortalURL = this.$portalurl; // place passed in value into global

            if ("apikey" in changedProperties) {
                this.$apikey = changedProperties["apikey"];
            }
            gPassedAPIkey = this.$apikey; // place passed in value into global

            // only attempt to filter displayed service locations if the webmap is initialized
           if (gWebmapInstantiated === 1) {
                applyDefinitionQuery();
            }
        }
    } // end of class

    let scriptSrc = "https://js.arcgis.com/4.18/"
    let onScriptLoaded = function() {
        customElements.define("com-sap-custom-geomap", Map);
    }

    //SHARED FUNCTION: reuse between widgets
    //function(src, callback) {
    let customElementScripts = window.sessionStorage.getItem("customElementScripts") || [];
    let scriptStatus = customElementScripts.find(function(element) {
        return element.src == scriptSrc;
    });

    if (scriptStatus) {
        if(scriptStatus.status == "ready") {
            onScriptLoaded();
        } else {
            scriptStatus.callbacks.push(onScriptLoaded);
        }
    } else {
        let scriptObject = {
            "src": scriptSrc,
            "status": "loading",
            "callbacks": [onScriptLoaded]
        }
        customElementScripts.push(scriptObject);
        var script = document.createElement("script");
        script.type = "text/javascript";
        script.src = scriptSrc;
        script.onload = function(){
            scriptObject.status = "ready";
            scriptObject.callbacks.forEach((callbackFn) => callbackFn.call());
        };
        document.head.appendChild(script);
    }

//END SHARED FUNCTION
})(); // end of class
Note the location of the inclusion of the ArcGIS JavaScript libraries. Also, note the require statement for the ArcGIS libraries. Here is the .json file that is read by SAC when you import the custom widget:
{
  "id": "com.sap.custom.geomap",
  "version": "1.1.0",
  "name": "GeoMap",
  "description": "GeoMap widget",
  "newInstancePrefix": "geoMap",
  "icon": "data:image/png;base64,iVBORw0KGgoAAAANSUhEUgAAABAAAAAQCAMAAAAoLQ9TAAAAA3NCSVQICAjb4U/gAAAAb1BMVEX///+ZmZl4dXdBPj9hYGGOjpE6ODo8OjwvLC0lISIpJSaMiooyLzH/cjMxLi9GREb/ZSk2MzV9fX1MSks4NjcrJyn/WR9ycnJRT1AtKiv/TRVdXF1ra2v7VCfJyMk+PD6tra+rqqtUUlU0MTNqaGpjxDg2AAAAAXRSTlMAQObYZgAAAAlwSFlzAAAOxAAADsQBlSsOGwAAAKhJREFUGNM9z9EagiAMBeDpEGkWNAGhqFTq/Z8xwK/+q7PtZgeg6npEMcBPJ0d1Kmg6ZnFGRZcLESnR7tpoouuVSCPPZYHWee+XxTsrvQeYQrwV97tL5uZigMeoqucTUSnWEVBX4fWaW2BYz1W3bXsLDPldcD8MoYZ3glmMjNbGLJk5igDgnLTGHazdAPo1Gdms2bZXhRmbMuNR5rNWJuX075sMYg57jV94IQ2Xqt1atQAAAABJRU5ErkJggg==",
  "vendor": "sap",
  "eula": "",
  "license": "",
  "imports": [ "input-controls" ],
  "webcomponents": [
    {
      "kind": "main",
      "tag": "com-sap-custom-geomap",
      "url": "https://tturchioe.github.io/helloworld/geomap_component.js",
      "integrity": "",
      "ignoreIntegrity": true
    },
    {
      "kind": "builder",
      "tag": "com-sap-custom-geomap-aps",
      "url": "https://tturchioe.github.io/helloworld/geomap_aps.js",
      "integrity": "",
      "ignoreIntegrity": true
    }
  ],
  "properties": {
    "metadata": {
      "type": "string",
      "description": "For internal use",
      "default": ""
    },
    "portalurl": {
      "type": "string",
      "description": "ESRI Portal URL",
      "default": ""
    },
    "apikey": {
      "type": "string",
      "description": "Key",
      "default": ""
   },
    "servicelevel": {
      "type": "integer",
      "description": "Electrical NODISCONT Service Level",
      "default": 0
    }
  },
  "methods": {
    "setServiceLevel": {
      "description": "Set the customer Service Level",
      "parameters": [
        {
          "name": "service",
          "type": "integer",
          "description": "ServiceLevel"
        }
      ],
      "body": "this.servicelevel = service;"
    },
    "getAPIkey": {
      "returnType": "string",
      "description": "Optional api method - Get API Key",
      "parameters": [
      ],
      "body": "return this.apikey;"
    },
    "setAPIkey": {
      "description": "Set the API Key",
      "parameters": [
        {
          "name": "pkey",
          "type": "string",
          "description": "Set New API Key"
        }
      ],
      "body": "this.apikey = pkey;"
    },
    "getPortalURL": {
      "returnType": "string",
      "description": "Get portal URL",
      "parameters": [
      ],
      "body": "return this.portalurl;"
    },
    "setPortalURL": {
      "description": "Set the Portal URL",
      "parameters": [
        {
          "name": "url",
          "type": "string",
          "description": "New Portal URL"
        }
      ],
      "body": "this.portalurl = url;"
    }
  },
  "events": {
    "onStart": {
      "description": "onStart events trigger"
    }
  }
}
We updated the code to allow specification of the ArcGIS Platform API key in the style sheet for the widget in your analytic app. Here is the code for that (geomap_aps.js)
(function () {
    var gPassedAPIkey;
    let tmpl = document.createElement("template");
    tmpl.innerHTML = `
      <style>
          fieldset {
              margin-bottom: 10px;
              border: 1px solid #afafaf;
              border-radius: 3px;
          }
          table {
              width: 100%;
          }
          input, textarea, select {
              font-family: "72",Arial,Helvetica,sans-serif;
              width: 100%;
              padding: 4px;
              box-sizing: border-box;
              border: 1px solid #bfbfbf;
          }
          input[type=checkbox] {
              width: inherit;
              margin: 6px 3px 6px 0;
              vertical-align: middle;
          }

      </style>
      <form id="form" autocomplete="off">
        <fieldset>
          <legend>GIS Widget Properties</legend>
          <table>
            <tr>
              <td><label for="apikey">API Key:</label></td>
              <td><input id="apikey" name="apikey" type="text"></td>
            </tr>
            <tr>
              <td><label for="portalurl">URL:</label></td>
              <td><input id="portalurl" name="portalurl" type="text"></td>
            </tr>
          </table>
        </fieldset>
        <button type="submit" hidden>Submit</button>
      </form>
    `;

    class restAPIAps extends HTMLElement {
        constructor() {
            super();
            this._shadowRoot = this.attachShadow({ mode: "open" });
            this._shadowRoot.appendChild(tmpl.content.cloneNode(true));

            let form = this._shadowRoot.getElementById("form");
            form.addEventListener("submit", this._submit.bind(this));
            form.addEventListener("change", this._change.bind(this));
        }

        connectedCallback() {
        }

        _submit(e) {
            e.preventDefault();
            let properties = {};
            for (let name of restAPIAps.observedAttributes) {
                properties[name] = this[name];
            }
            console.log(properties);
            this._firePropertiesChanged(properties);
            return false;
        }
        _change(e) {
            this._changeProperty(e.target.name);
        }
        _changeProperty(name) {
            let properties = {};
            properties[name] = this[name];
            this._firePropertiesChanged(properties);
        }

        _firePropertiesChanged(properties) {
            this.dispatchEvent(new CustomEvent("propertiesChanged", {
                detail: {
                    properties: properties
                }
            }));
        }

        get apikey() {
            return this.getValue("apikey");
        }
        set apikey(value) {
            this.setValue("apikey", value);
        }

        get portalurl() {
            return this.getValue("portalurl");
        }
        set portalurl(value) {
            this.setValue("portalurl", value);
        }

        getValue(id) {
            return this._shadowRoot.getElementById(id).value;
        }
        setValue(id, value) {
          console.log(id +":" + value);
            this._shadowRoot.getElementById(id).value = value;
        }

        static get observedAttributes() {
            return [
                "apikey",
                "portalurl"
            ];
        }

        attributeChangedCallback(name, oldValue, newValue) {
            if (oldValue != newValue) {
                this[name] = newValue;
            }
        }
    }
    customElements.define("com-sap-custom-geomap-aps", restAPIAps);
})();
One other thing you’ll have to do is add the following URLs to the SAC Trusted Origin list for:
- The server that serves up your JavaScript for SAC to use (not shown below)
- The ArcGIS JavaScript libraries (https://js.arcgis.com)
- The ArcGIS Platform libraries (https://route-api.arcgis.com)
Here is a screenshot of those URLs in the SAC Trusted Origin list.

Hopefully, this custom widget gives you some great ideas on how to leverage ArcGIS Enterprise analytic and operational capabilities into your SAC analytic apps. Think of how your SAC users can benefit from seamless integration of ArcGIS Enterprise capabilities into SAC.
While creating this blog, we learned some excellent debugging techniques. Look for that blog soon! Keep reading for instructions on how we created this simple analytic application in SAC…
Creating the simple analytic application
Import the widget.
- Login to SAP Analytics Cloud
- Select Custom Widgets Tab
- Select the plus (+) sign to add the widget json. The file will need to be local to upload.
Create new Application
- Select Applications Tab Create New
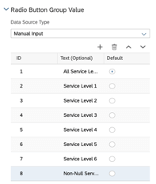
- Insert radio button group
- Add ID and Text data into the control. ID and Text need to be as in the diagram to match the dataset
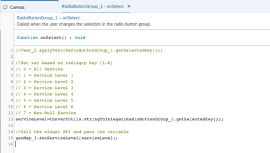
- Create Script variable serviceLevel type: Int default value 0
- Add the Radio Button logic
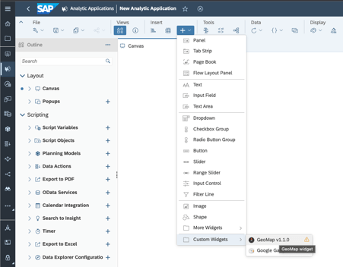
- Select Insert the plus sign and navigate to Custom Widgets then select the GeoMapv1.1.0 widget
- Resize widget and move widget where you want it to be. You may see an error this is normal as no properties have been set in the builder tab of the widget.
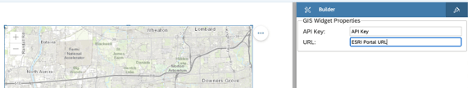
Add Widget properties
- Select the widget then the Designer
- Navigate to the Builder Tab
- Add ArcGIS JS Developer Key
- Add URL address to the ArcGIS Portal