This is a PoC in customer system for embedded analytics, especially embedded SAP Analytics Cloud. SAP S/4HANA Cloud Embedded SAP Analytics Cloud can enhance the analysis function of the current system and can better help customers analyze business related data. In this blog post, the successful PoC of Embedded SAP Analytics Cloud on Outbound Delivery and Billing Overview will be shared to readers to show its powerful functions and to introduce the key steps to implement it in detail.
What’s customer’s request?
According to the customer’s business scenario, the dashboard was designed to show an overview of the outbound delivery compared to the billing documents, providing the comparison view in one table. Since the delivery Line item Information (such as customer, product, unit, quantity, transaction currency, etc.), pricing information (net price, discount, sales cost, etc) for sales information and billing information are delivered in different CDS View in the standard content, the accountants need to manually consolidate the information from two separate applications. With the new report, it will be easier to track the daily outbound delivery and billing status and can greatly help accountants to compare the billing and received payments.
Therefore, embedded SAP Analytics Cloud has been introduced to the customer to customize the Outbound Delivery and Billing Overview which can provide the information that the customer wants in one table.
The following table illustrates the basic expectation of the final output according to the customer’s request:
| Master data | |||||||||
| Sales Organization | Calendar Month | Calendar Month | Customer Name | Material Group | Delivery Document | Sales Document Type | Product | Product Name | Package Size |
| Delivery | |||||||
| Quantity Delivered | Net Weight Delivered in KG | Original Price | Price After Discount | Net Price | Original Amount | Amount after Discount | Net Amount |
| Billing | |||
| Billing Quantity | Billing Net Weight in KG | Billing Price | Billing Amount |
How to solve the problem?
There are four main steps to implement Embedded SAP Analytics Cloud: creating Custom CDS View, creating Custom Analytical Query, creating Story and creating an Application. The specific steps will be described in detail below. To protect customer sensitive data, some of the screenshots come from dummy test system.
1. Creating Custom CDS Views
In this story, 3 CDS views need to be created. The first is Interface View YY1_SALESANABASENEW, which can expose the relevant fields (esp. the external keys) from I_DeliveryDocumentITEM and its associations.
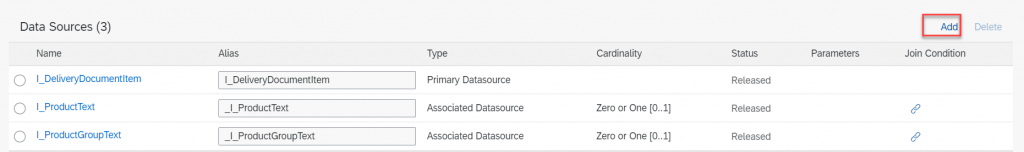
Navigate to Custom CDS View APP, create a new CDS view, fill the name and select “Standard CDS View” for the scenario. Add I_DeliveryDocumentITEM as the Primary Datasource and add I_ProductText and I_ProductGroupText as the associations. Maintain the join conditions.
Add parameters.

Add elements from main data-source and its associations
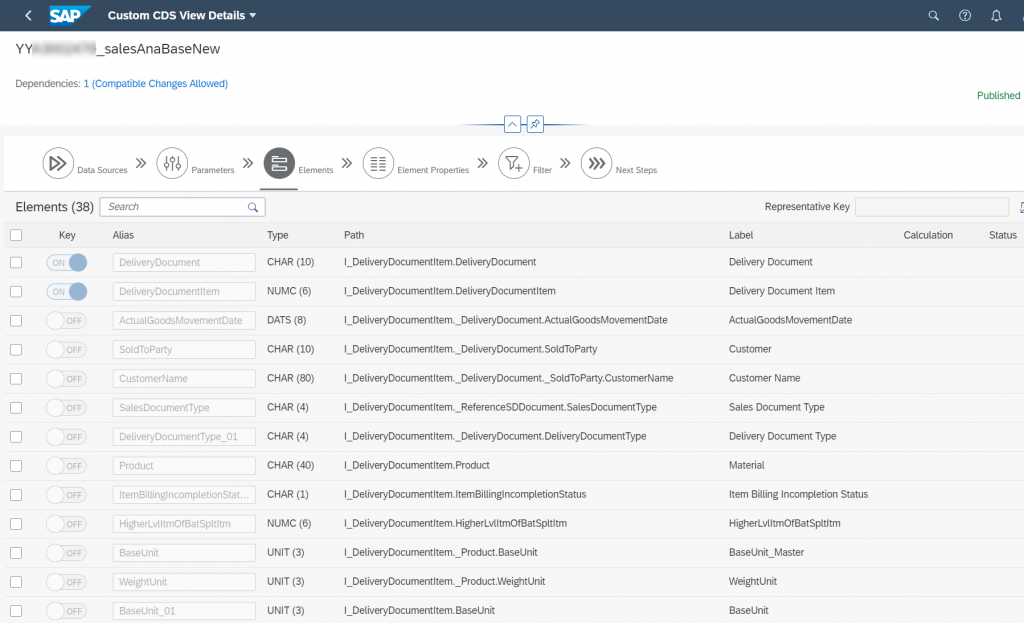
Add calculations if necessary, for example, edit the formula of ‘CalMonth’ to get month from the date. The formula is as follows.
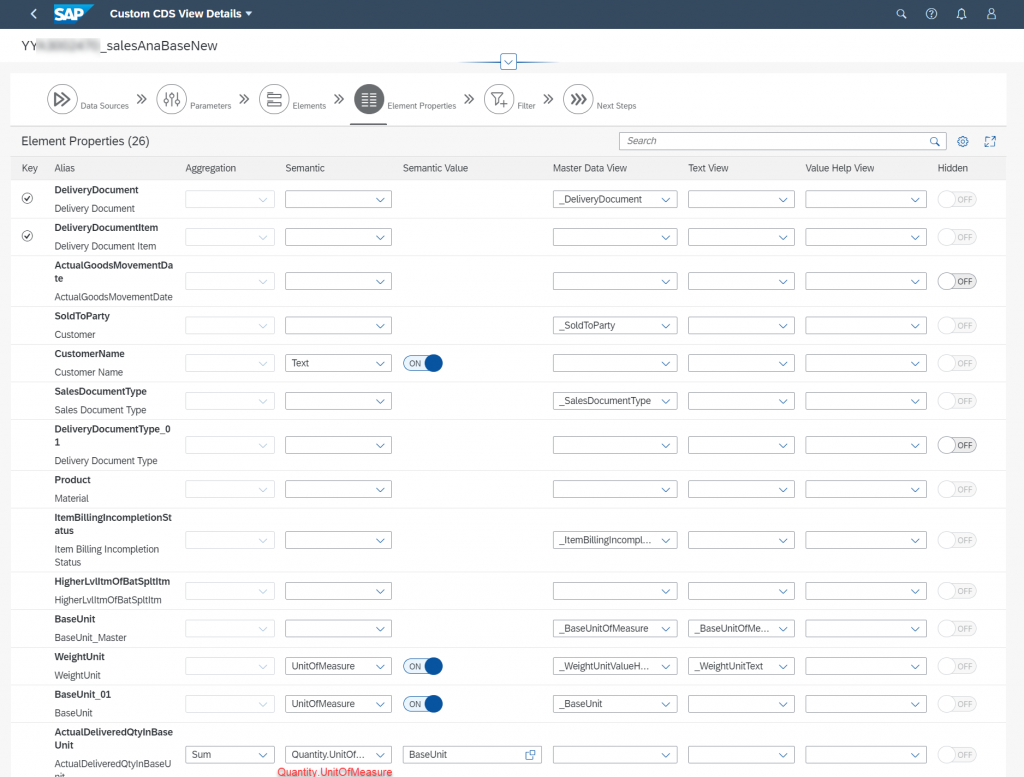
left(I_DeliveryDocumentItem._DeliveryDocument.ActualGoodsMovementDate,6)Then maintain element properties.
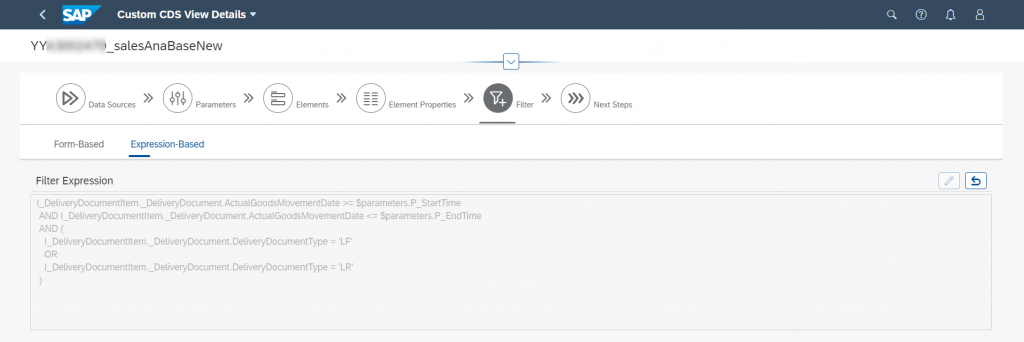
Add filter if necessary.
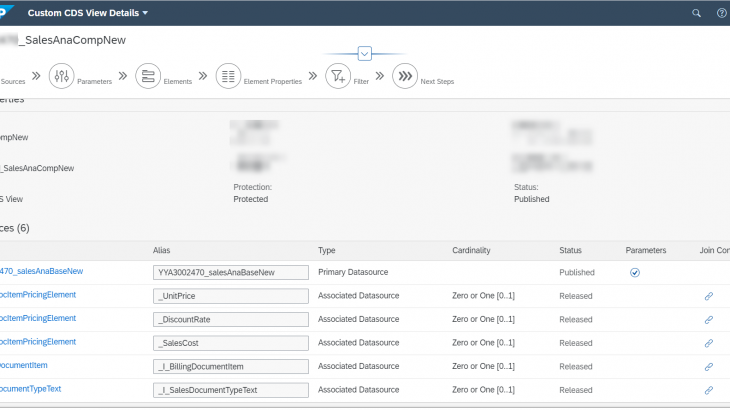
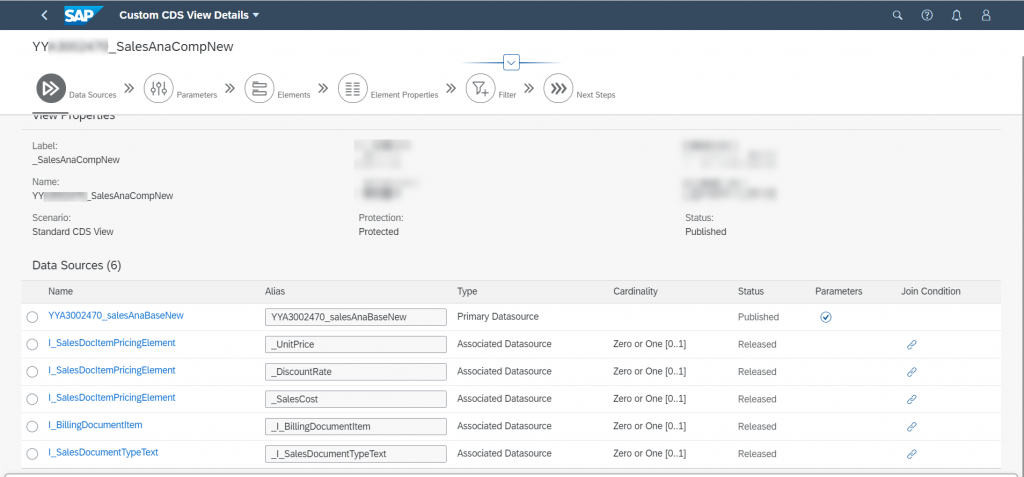
Save and publish this custom CDS View. Then create the Composite View YY1_SALESANACOMPNEW. Add the new created YY1_SALESANABASENEW as the primary data source of this view. Then add the I_SalesDocItemPricingElement, I_BillingDocumentItem and I_SalesDocItemTypeText as associations and maintain their join conditions.
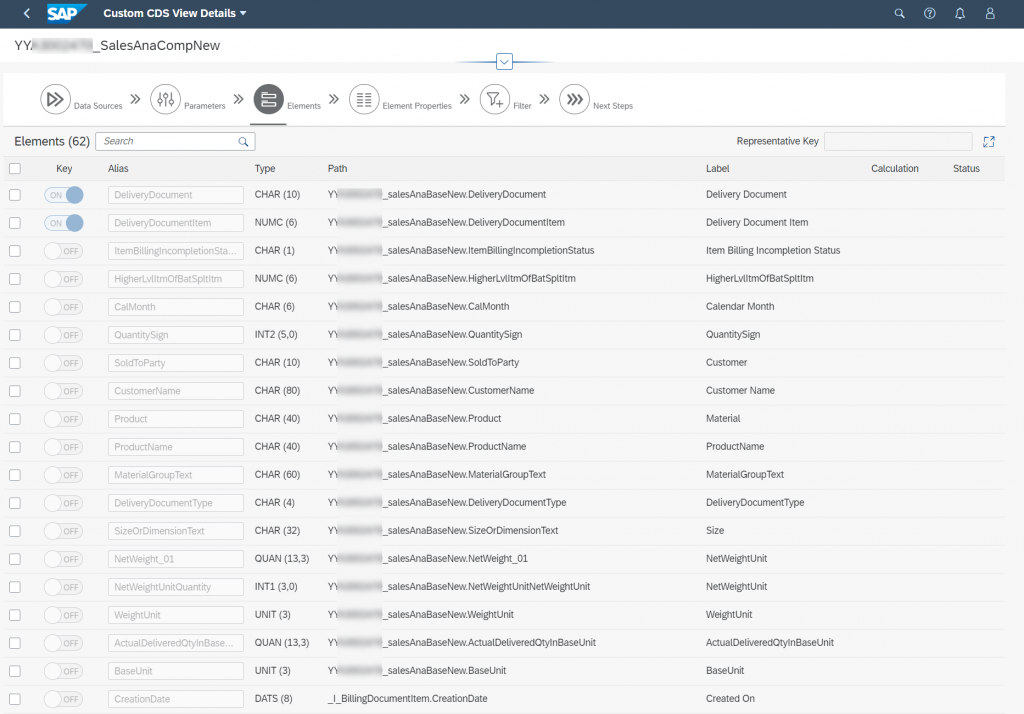
Add elements.
Add Calculations, for example add a formula to calculate BillingQuantitySigned
cast(YYA3002470_SalesAnaBasenNew.QuantitySignasABAP.FLTP) *
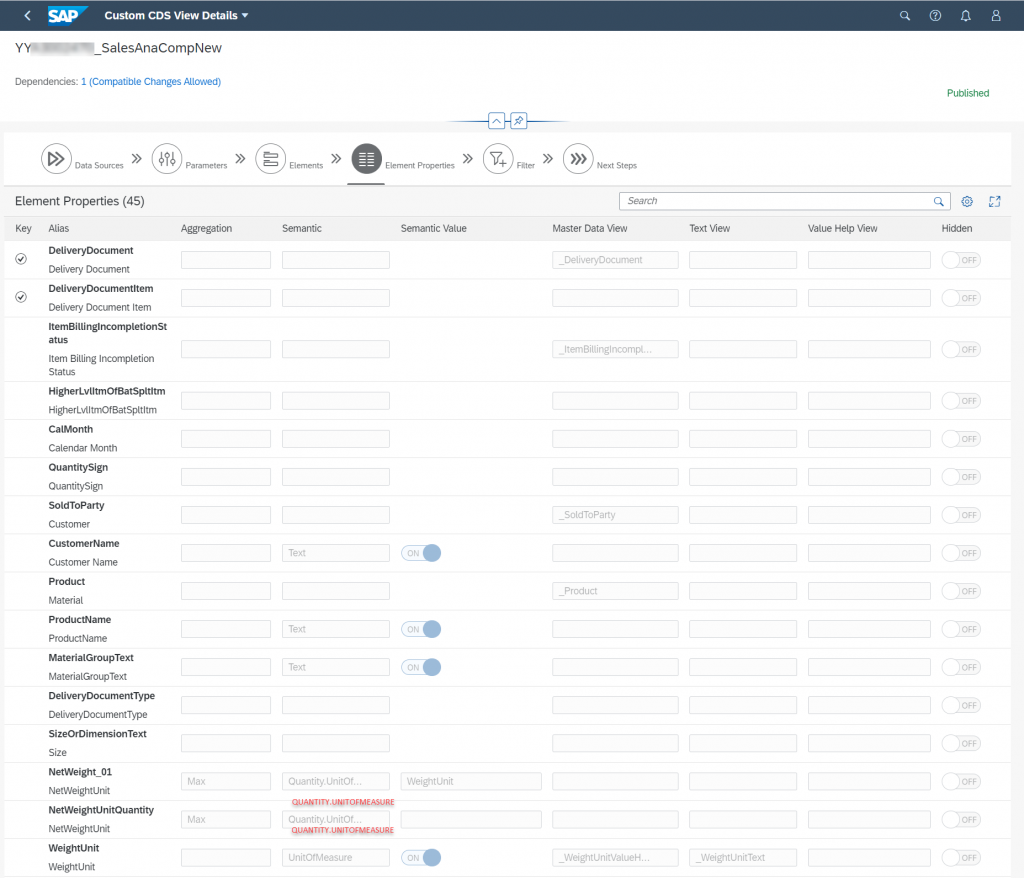
cast(_I_BillingDocumentItem.BillingQuantityasABAP.FLTP)Maintain Element Properties.
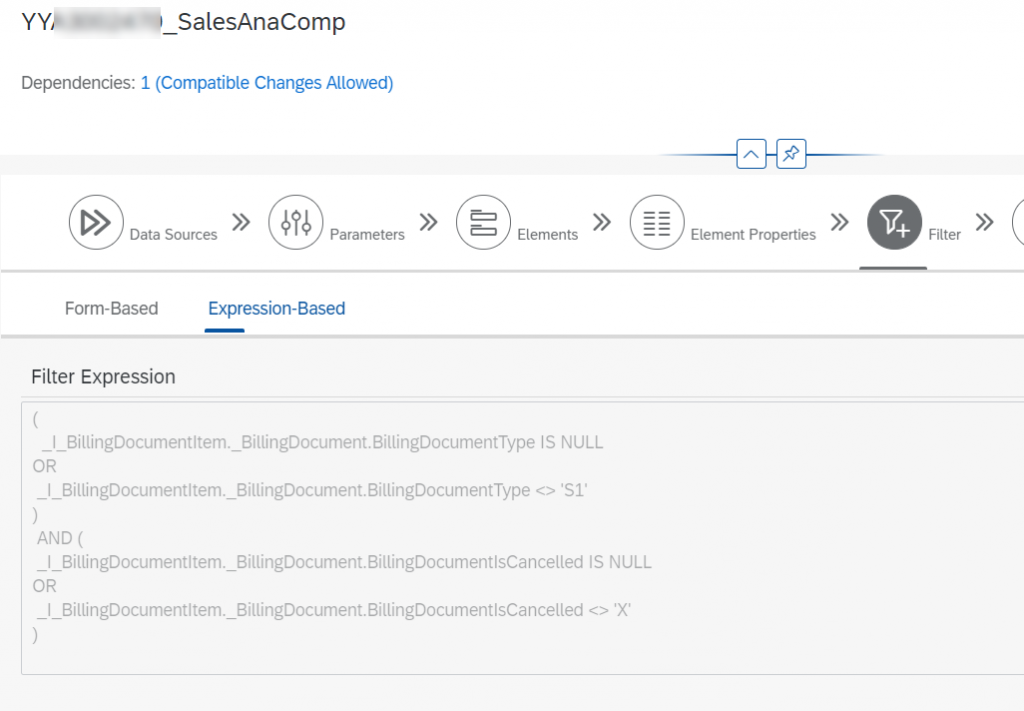
Add the following filter.
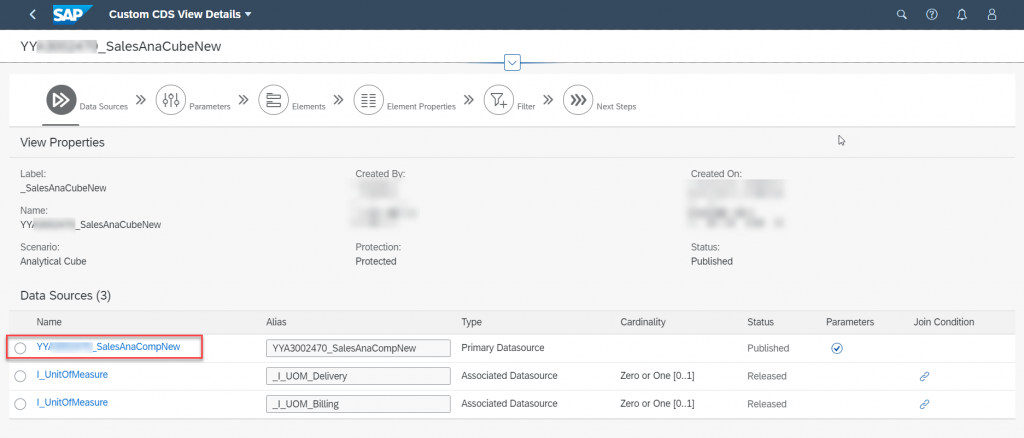
Save and publish this view. Then create a Cube View YY1_SALESANACUBENEW. Add the new created YY1_SalesAnaCompNew as the Primary DataSource and I_UnitOfMeasure. Maintain the join condition.
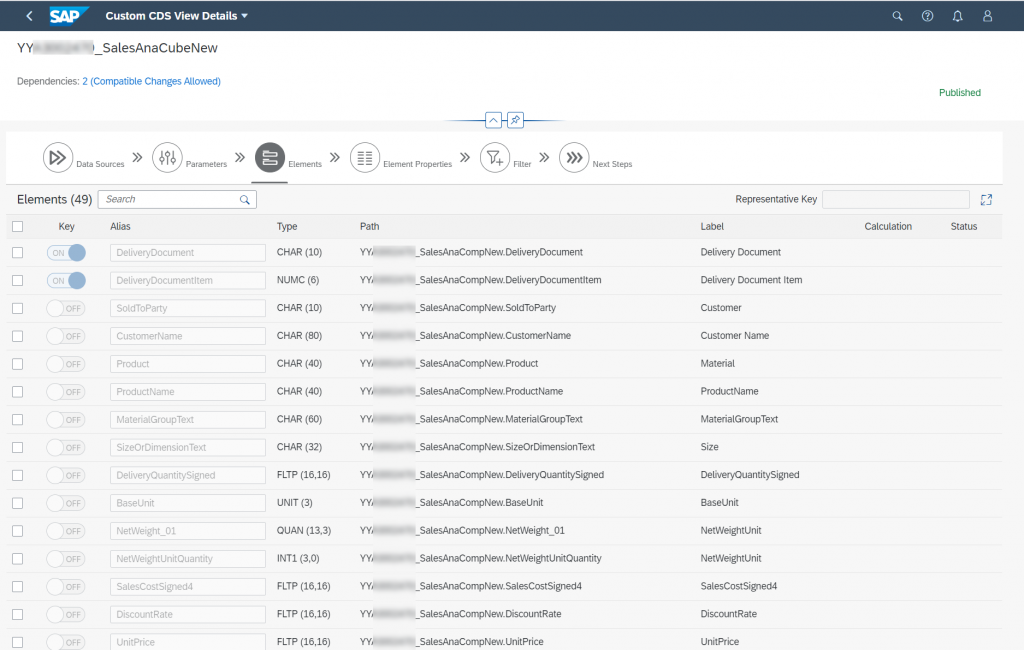
Add elements.
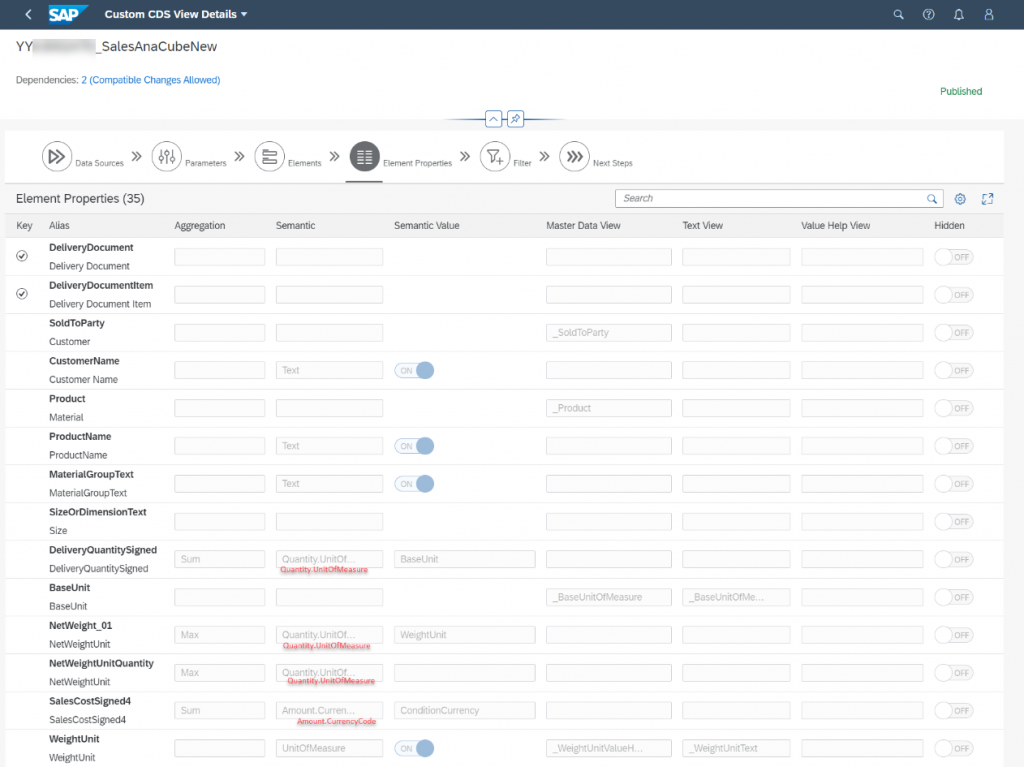
Maintain Element Properties and then save and publish this view.
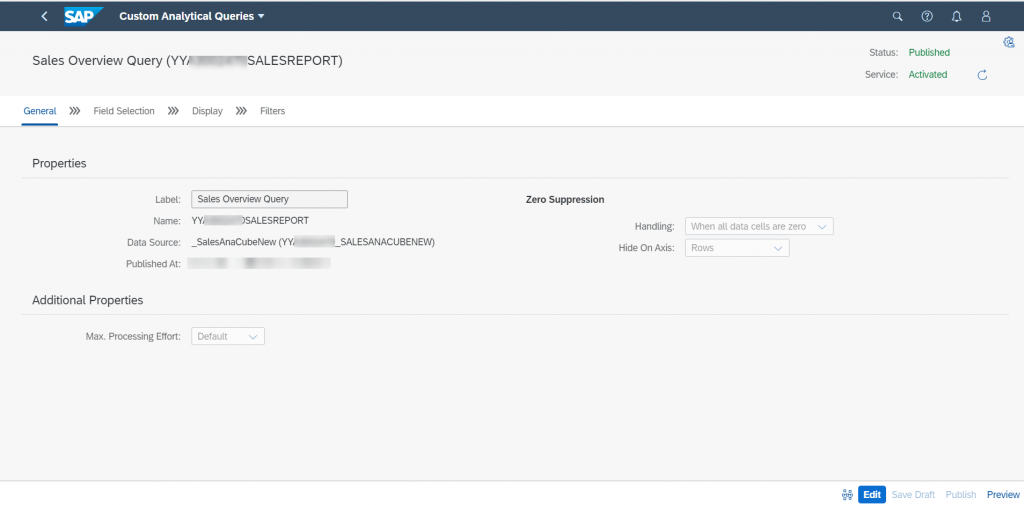
1. Creating Custom Analytical Queries
Choose “Custom Analytical Queries” app from menu Query Design. Create a query and select YY1_ SALESANACUBENEW as data source. Fill the name(YY1SALESANAQRY) and label of the query.
Select the field.
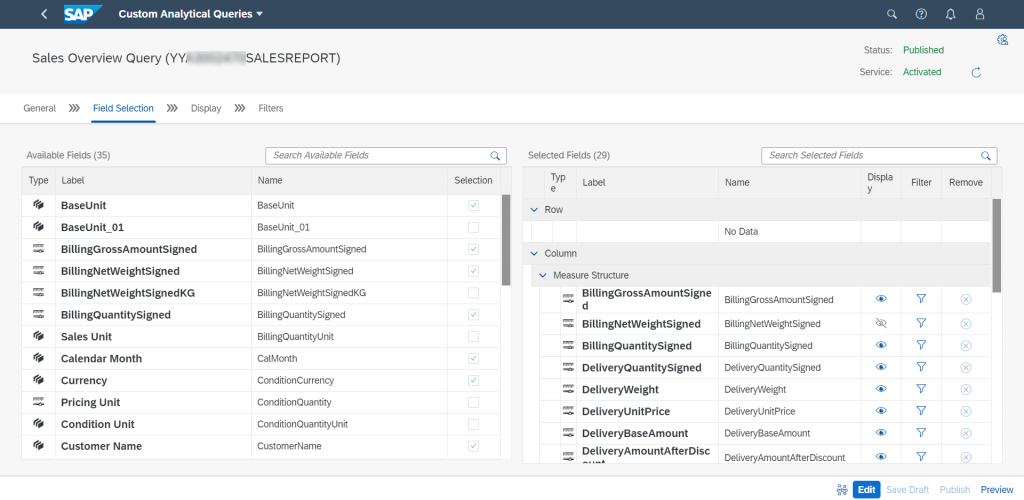
Add calculated measure. For example, to calculate the Delivery Weight, the formula can be edited as below:
“DeliveryQuantitySigned” * “UnitNetWeightKG” / “NetWeightUnit(NetWeightUnitQuantity)”Add a mandatory single-value prompt on SoldToParty and SalesOrganization field.
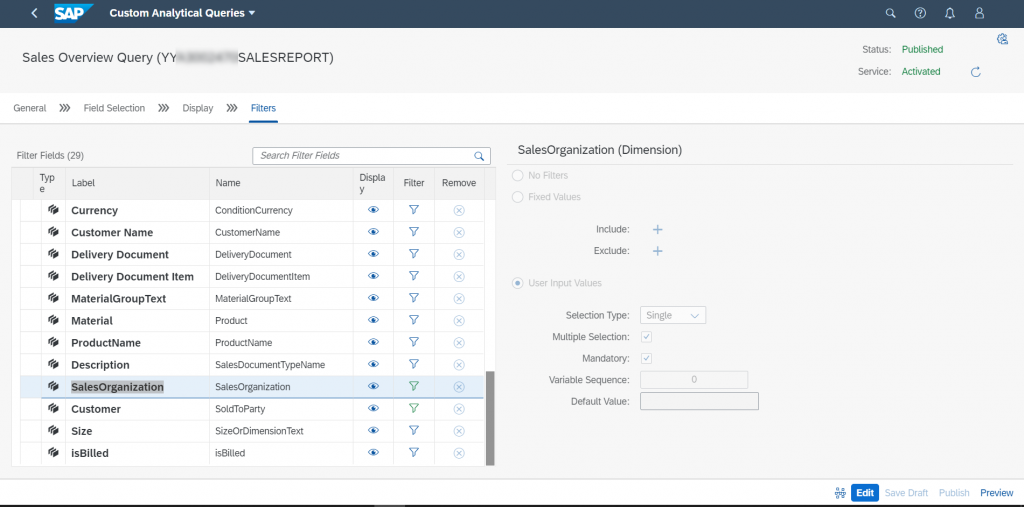
Then save and publish the query.
- Creating Story
The Create Story page allows customers to define SAP Analytic Cloud story for a selected data source. Customers can create different visualizations to the data source. Multiple data sources can be added to the story and users can design interactive dashboards, create new pages, and add visualization such as charts, tables, and other graphics to visualize the data. The items on the page such as chart are arranged as tiles that can be moved around, resized, and styled to your liking.
Therefore, we have defined an SAP Analytic Cloud story for the new created data source to visualize the data that the customer wants to show on the page.
Firstly, navigate to KPI Design group in the Fiori Launchpad (FLP).
Choose “Stories” tab from the Manage KPIs and Reports app page and create a custom story.
The Create Story page appears. In the Definition tab, enter the title in the Header section and description in Business Information section. Then go to Configuration tab to define the story. A pre-defined template will be loaded.
Select a query from the list to build the story. Here we choose YY1SALESANAQRY As Primary Data Source then you can design layout as you prefer.
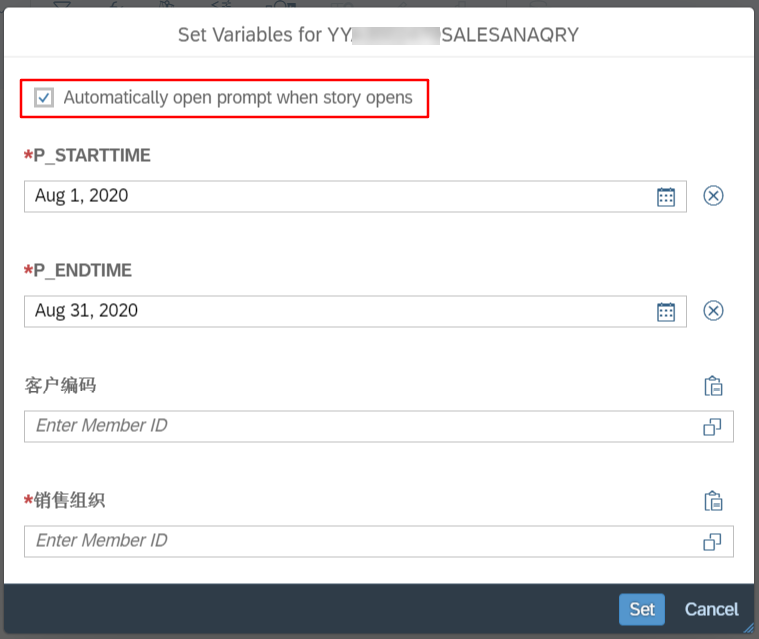
When the query prompt pops up, enable “Automatically open prompt when story opens” so that end user will be prompted to enter the report period and company code when the story is opened.
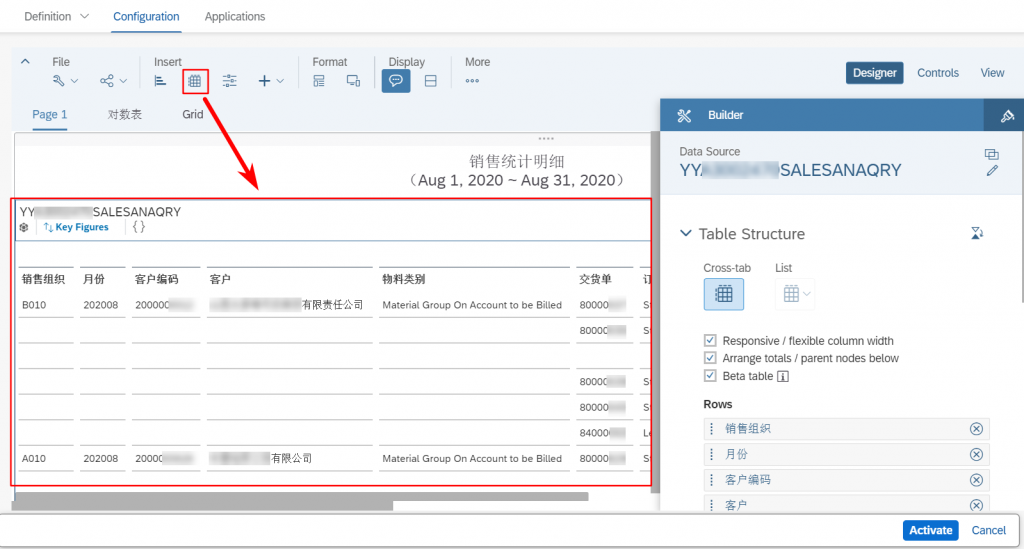
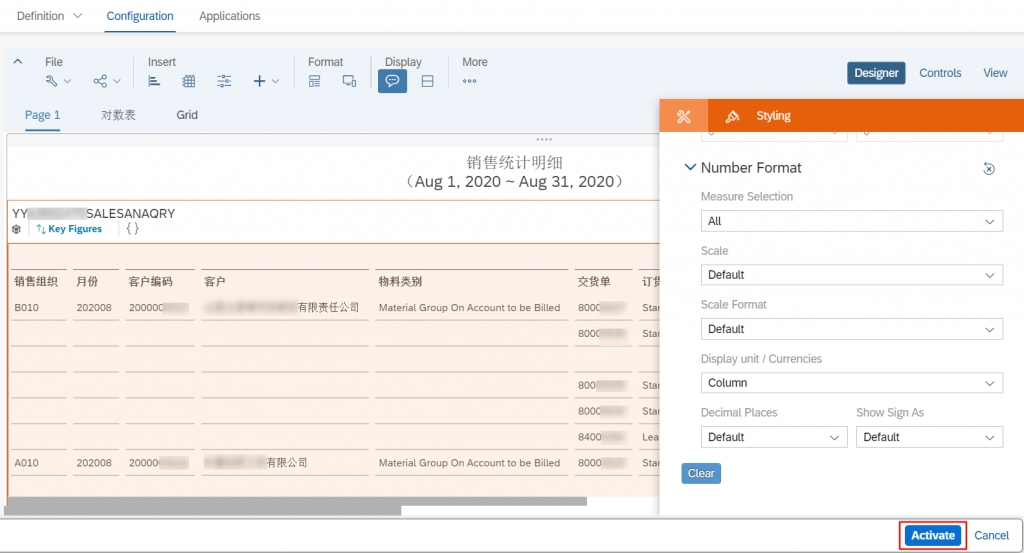
Insert the main Table and adjust the table styling
Activate (Save) the story when the report is completed.
1. Creating an Application
To create an application (aka FLP Tile) to launch the story, choose Applications > Add Tile. Choose a Tile Type format from the various options.
Fill out all the details and click on “Save and Publish ”.
After successful save of the tile, it will navigate to “Custom Catalog Extension” app to publish a tile in the desired catalog.
In “Custom Catalog Extension” App, add a catalog to publish the tile.


