Prerequisites
You must have the authorization to access the following work center/ work center views:
- Business Analytics
- Machine Learning Cockpit
- Customers
Step-by-Step Procedure
In this blog, we’ll go through all steps to help you get started.
Firstly, we’ll cover the creation of a scenario, which is a set of data and parameters that are used to create and train a machine learning model.
Next, we’ll dive into the model building and training process. We’ll walk through the steps to create and train your own model, so you can get accurate predictions.
Once you have your model, we’ll see how to create and execute a prediction run. This will allow you to see your model in action, making predictions based on your specific data.
Finally, we’ll look at how to view your predictions in the Customers UI. This will give you a visual representation of your data, making it easy to understand and work with. By following these steps, you’ll have a comprehensive understanding of how to implement the solution end-to-end.
So, let’s get started with steps to create a new Scenario in Machine Learning Cockpit.
Scenario Management
To create a new scenario, navigate to the Machine Learning Cockpit work center and select the Scenario work center view. This is where you will find all existing scenarios and be able to create new or edit existing ones.
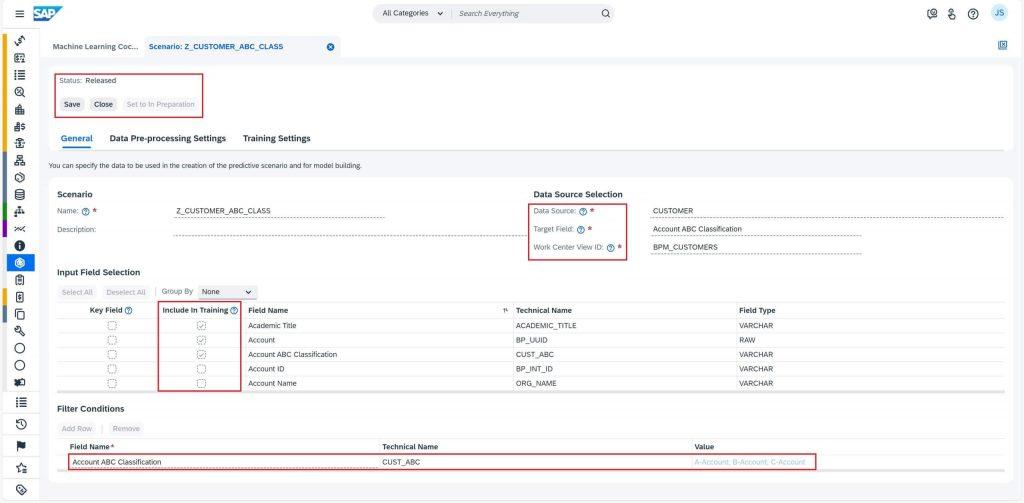
Once you’re in the Scenario work center view, select the New button to create a new scenario. This will open a new window where you can enter the details for your new scenario. Name your scenario and make sure it starts with the letter Z, e.g., Z_CUSTOMER_ABC_CLASSIFICATION, otherwise the tool will throw out an error as ByDesign has this rule for all user defined scenarios.
You should now select the data source that you want to use for your scenario in the Data Source field. For this case select Account Master Data
Then you must select the field that you want to predict in the Target Field section, Account ABC Classification in this case.
Next, from the list of work center views, select the Work Center View ID. For example, ” Customers work center view”. If there are no work center views in the list, it means that there is either no report created for the “Customers” data source or none of the reports have the work center view assigned.
Moreover, under Input Field Selection, you should select the fields to be included in the training which may contribute to decide the outcome of Target field. I recommend selecting more fields in scenarios and decide about final selection in the model, based on data distribution statistics. Make sure to avoid fields that contain either ID or which have data for only one outcome and null values for others and so on.
In order to restrict training data to items for which the business outcome is already known, add Filter Conditions. For this scenario, set Account ABC Classification = A-Account; B-Account; C-Account
Finally, Save, Release, and Close the scenario. Your scenario should look something like below image.
That’s all. You have completed the first step and now your scenario is ready to have models built up on it. Let’s go through the next section Model Management to understand how to build and train a model.
Model Management
There are 3 sections here – model creation, data pre-processing and model training. Data pre-processing is a major step before model training. Raw data might contain many garbage values or no value at all which may lead to training failure or inefficient training and low accuracy. This is not we want.
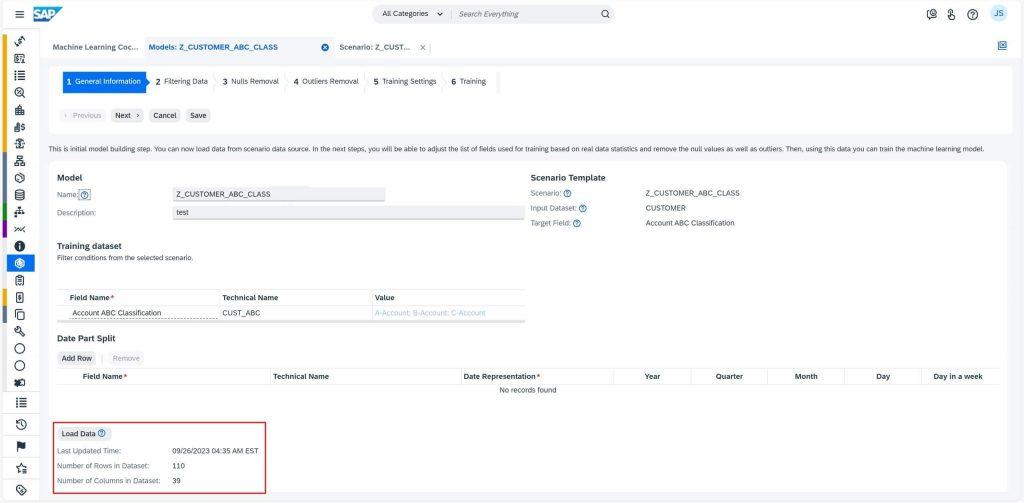
We will start by navigating to the Model work center view and selecting the New button. At this point, under General Information tab, you will be prompted to enter information like name and description of model, as well as the selection of the scenario that the model will be built for, Z_CUSTOMER_ABC_CLASSIFICATION, in this case. Once you’ve entered this information, in order to load the data in the model, you will have to select Load Data button. I will suggest checking the number of rows and columns in the loaded dataset to ensure there is no anomaly. You are now all set to move to the next tab by selecting Next button.
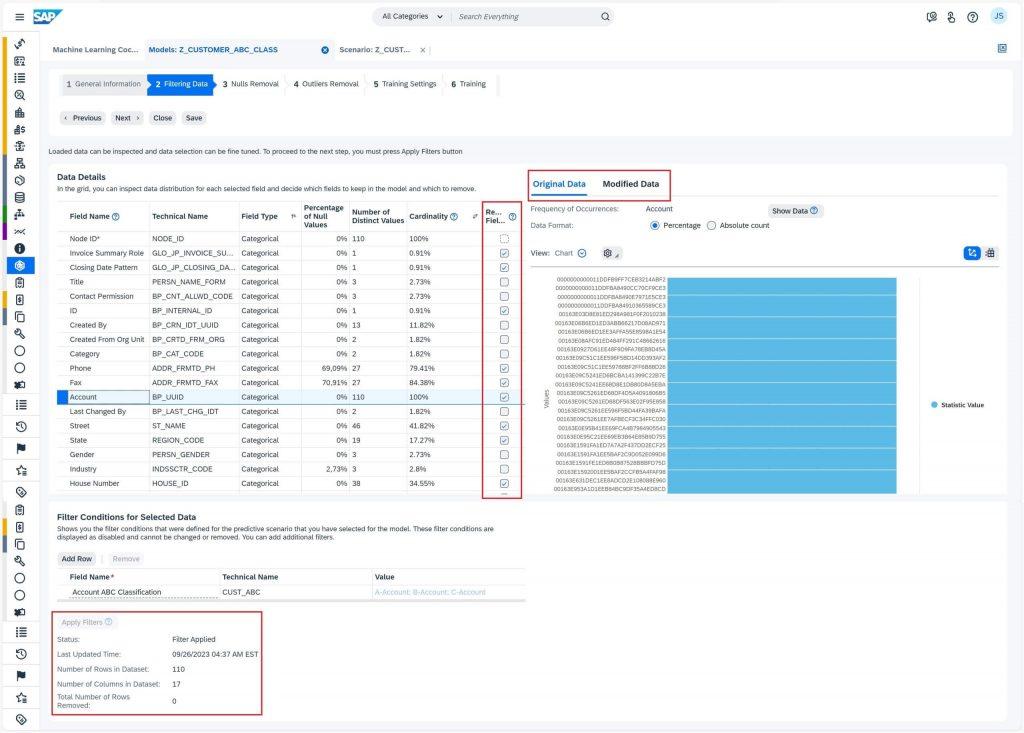
As we move to the Filtering Data tab, you can see all the fields which we selected in scenario to be included in training. Now you have to decide which columns to keep based on the data distribution information provided, like removing the fields which contains a large number of null values. The tool will by default, mark the fields to be removed based on the default settings from scenario. I would suggest to see the section Model – Filtering Data in online Help Portal for details. Do make sure to check the number of rows and columns to ensure you don’t end up removing a larger portion of data. Select the Apply Filters button to perform the filtering operation. We will then move to Nulls Removal tab by selecting Next button.
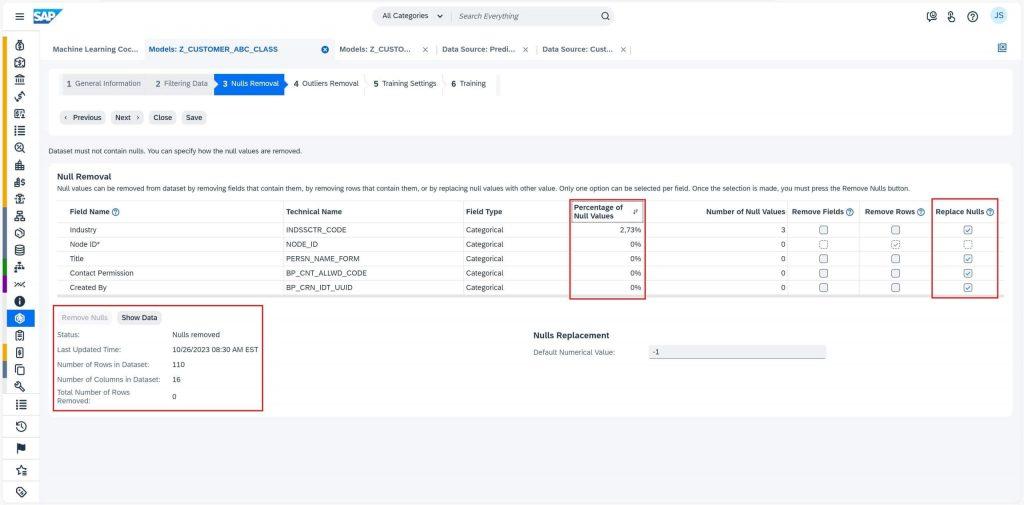
In Nulls Removal tab, you can see the percentage of null values identified in every field in training data. we usually replace null values with -1 to avoid them influence the model training. To do so, select on the Remove Nulls button. The status will then be updated to Nulls removed once the operation is performed. Selecting Next now will take us to Outlier Removal tab.
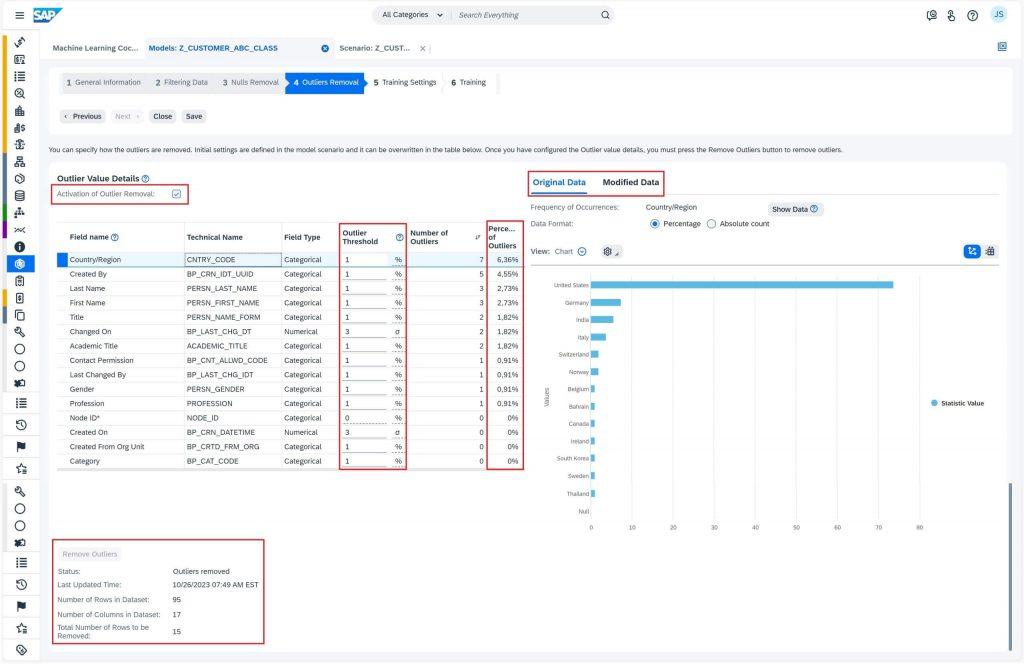
Outlier removal is a crucial part of ensuring that your data is accurate and will produce reliable results. When you get to the Outliers Removal tab, make sure you activate the checkbox Activation of Outlier Removal to start the operation. You may want to sort your table by the number of outliers so you can see which fields are causing the most problems. Keep an eye on fields with long-tail values like Account, as they might be flagged as outliers even if they’re legitimate data points.
If you find that too much data is being removed, you can try adjusting the threshold values for those specific fields. Select the Remove Outliers button to perform this operation. Just ensure that you select this button after each change to see how it affects your data. You may keep the “Activation of Outlier Removal” unchecked if the amount of training data is small, like in this case, to avoid removal of crucial data. I still chose to keep them as I found training results to better when these outliers were removed. If you’re happy with the results, hit Next to move forward.
Don’t forget to check out the Model – Outliers Removal section in online Help Portal for more information. With a little tweaking, you can ensure that your data is clean and ready to be used in your models.
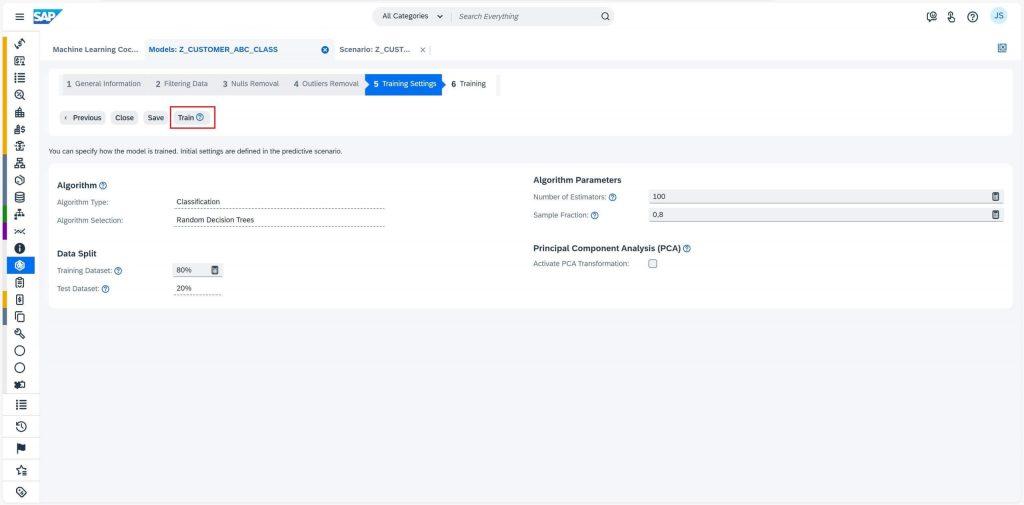
Finally, we are ready to train our model. In the Training Settings tab, you can see the algorithm our model will use for learning. You may keep the default training algorithm or change it while creating scenario under Data pre-processing tab. However, if you are not satisfied with the training results later and wish to try different algorithm, you must create a new scenario or copy existing one and change the algorithm.
To start the training, select the Train button. Once the “Training in Progress” Status is shown, you can close the Model UI and check the model training status periodically in the Models work center view.
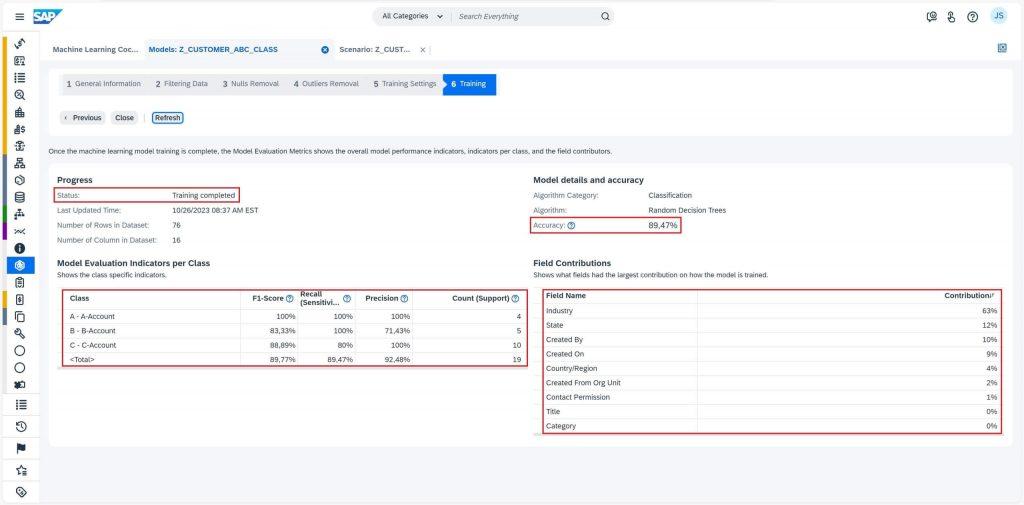
When model training is complete, you should check the Accuracy to determine the training quality. To see the extended model quality indicator, select the Show Training Results button and check Model Evaluation Indicators Per Class. Higher the value of any above parameters, better it is, but a score of 100% is always suspicious of overfitting. This is how you can decide if the model quality is acceptable, or should you retrain the model with different settings. In case of acceptable model quality, select the Activate button to activate the model.
You can also check Field Contributions to understand the influence of the respective fields on the model training. Just a tip, if you see failed training then check the error log by selecting the Results tab under Show Log link to troubleshoot.
Great job! Now our model is trained and tested. It’s the time to run predictions on open sales quotes. Prediction Run Management section below explains that in detail.
Prediction Run Management
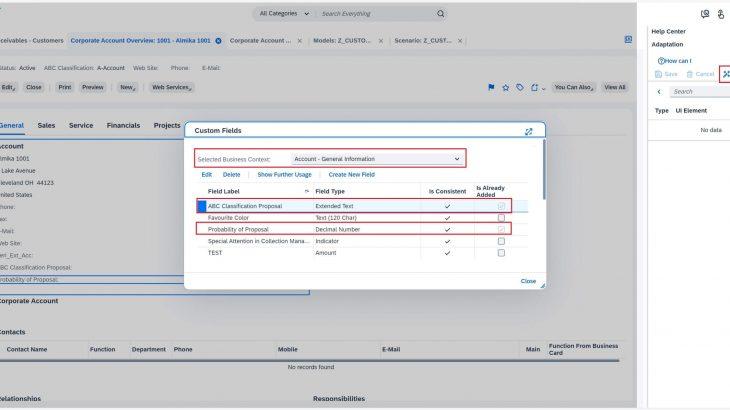
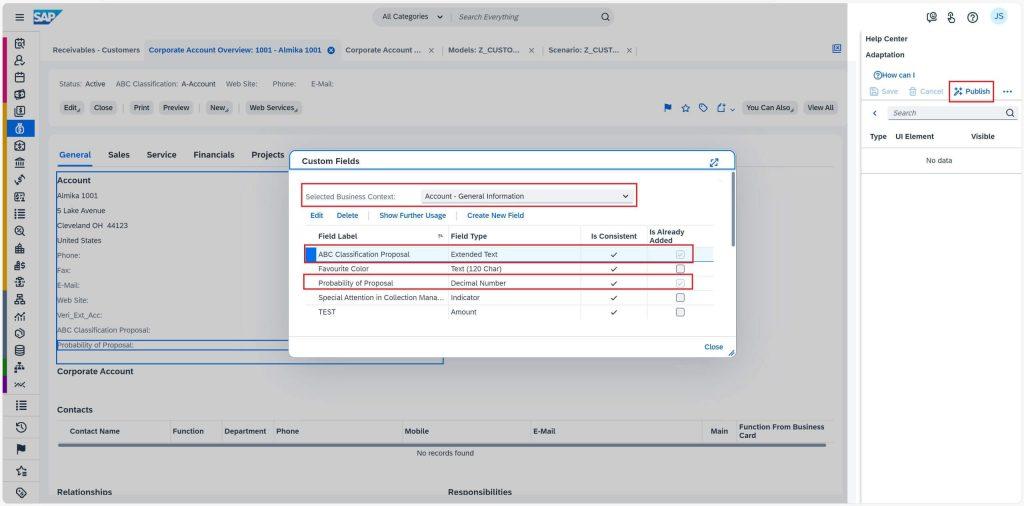
This is the process where we will be able to do the prediction for new data. To get started with Prediction Runs, you first need to create two extension fields in the Customers work center view using the Adaptation Mode under Key User Settings. In business context General Information, create ABC Classification Proposal and Probability of Proposal. My recommendation would be to use field type ‘Extended Text’ and ‘Decimal Number’ respectively. Later, these fields will be used to map the prediction results to be able to view them in the Customers UI. You can read more about creating an extension field in SAP online Help portal.
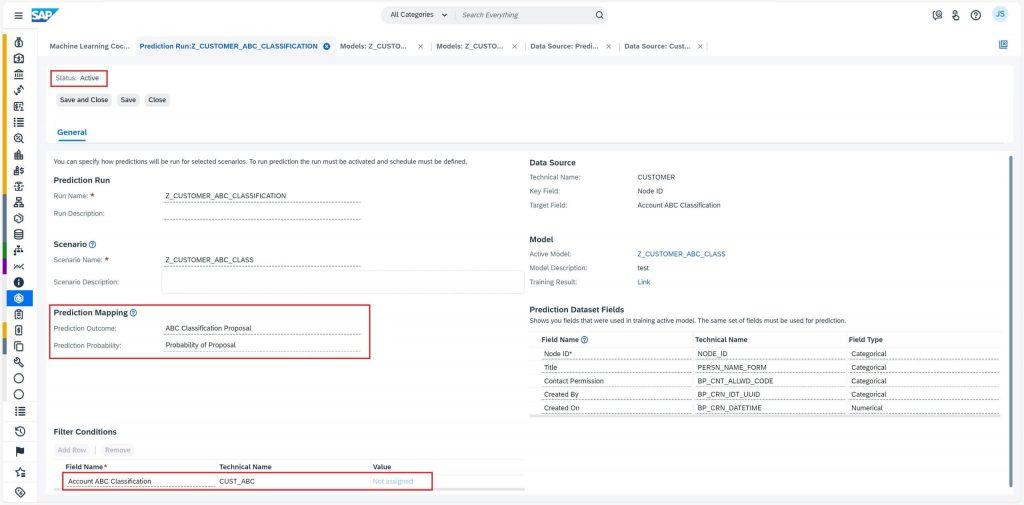
Once you’ve created these fields, navigate to Prediction Run work center view and select New to create new prediction run. This is where you’ll set the name and scenario for your prediction, for e.g., Z_CUSTOMER_ABC_CLASSIFICATION. Also, map the extension fields “ABC Classification Proposal” to Prediction Outcome and “Probability of Proposal ” to Prediction Probability. You’ll also want to add a filter condition to restrict the training data to quote items for which the business outcome is not yet known, for e.g., Account ABC Classification = Not assigned.
Once your Prediction Run is set up, you can activate it and schedule the background job by selecting the Schedule button or run it directly by selecting Start Immediately button. Be sure to check the execution details periodically in Execution Details tab to ensure that the processing status is Finished. Once it is, you can check the execution status in the Application Log.
That was it. All the customer accounts should now have a predicted class assigned to them and the probability of that outcome being true. Now comes the exciting part – checking the prediction results!
Prediction Consumption
You did it! These predictions can be viewed in both business documents and Business Analytics.
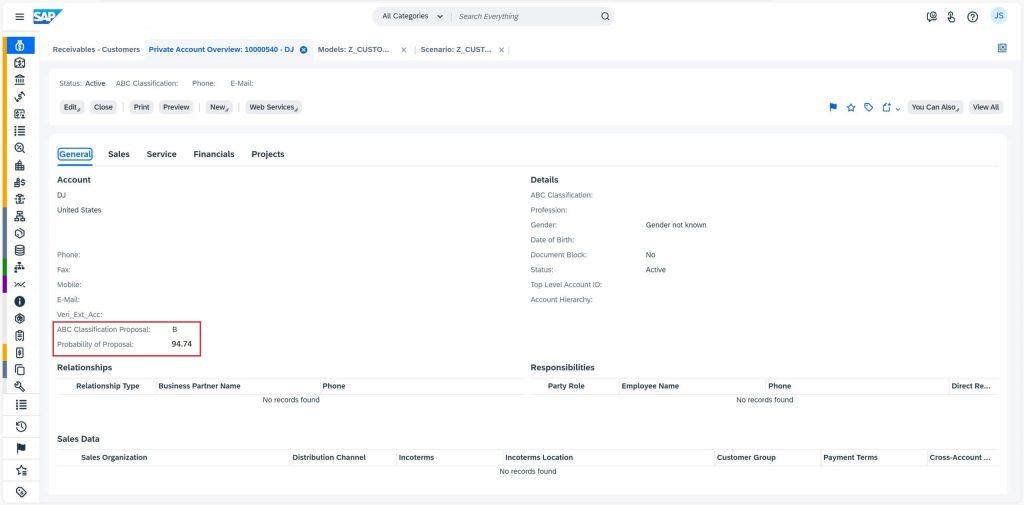
To view them in business documents, let’s move to Customers work center view under Receivables. Select a customer of your interest. Voila! The extension fields ABC Classification Proposal and Probability of Proposal now displays ML predicted outcome and how confident the model is about the prediction.
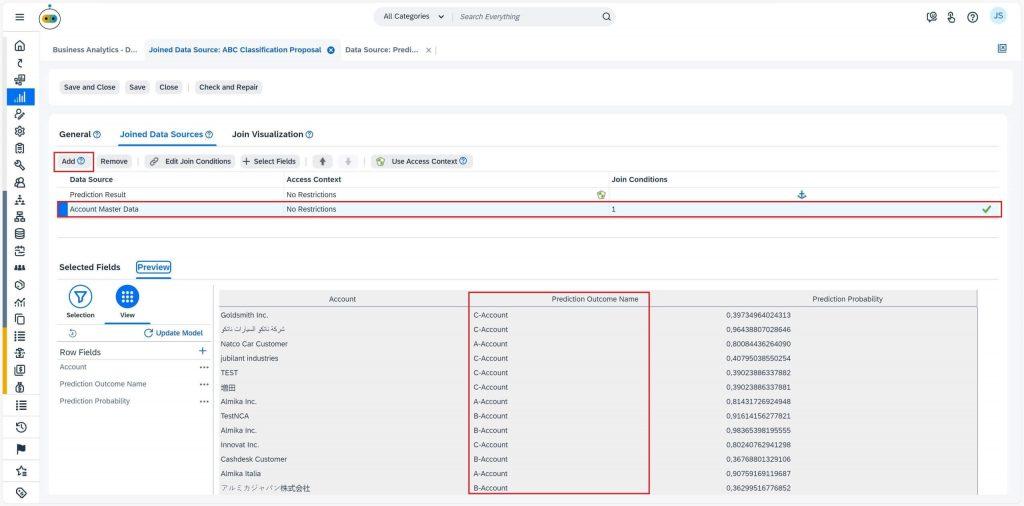
In Business Analytics, you can consume predictions by navigating to the Prediction Results data source. This data source provides a list of all prediction scenarios in the form of Prediction Outcome, Prediction Probability, and key influencers. To view these predictions in the context of current scenario data, you will need to create a new join data source. You can do this by navigating to the Prediction Results data source, selecting New -> Join Data Source, entering a new name for the data source, for e.g., “ABC Classification Proposal” and selecting the Next button. You then select all the available fields before selecting Finish. Now switch to the Joined Data Sources tab and select the data source with you want to join with Prediction Results data source by using Add option, Account Master Data in this case. In the Next tab, you should select the Key field in the “Prediction Results” data source and the Account field in the “Account Master Data” data source. Create the join by selecting the Add button and move to the Next tab. Here, select all fields before finishing the process. Now, switch to Preview tab to make sure the join works, and finally Save and Close. This new join data source will provide you with a consolidated view of predictions for all open customer accounts.
That’s how Machine Learning Cockpit can help by doing the analysis and prediction for you so that you can focus on your strategies for each customer group and strengthen your business by enhancing customer satisfaction.


