This is the second part of my mini blog post series, where I will show how to model and consume data in SAP Analytics Cloud. In the first part, I have shown how to build the first version of the model for Confirmed cases. In this blog post I will show you how to:
- Resolve data quality issues (see Part 1, where i got some rejected rows).
- Add new measures and data sets associated with them.
- Import/upload new data

Please also note that there might be some redundant steps in this procedure, but I wanted to show you how you could adjust the process in case something unpredictable happens. After all, this is what happened to me. Furthermore there is always some room for improvements and this I leave for final thoughts of this blog post.
Read More: SAP Analytics Cloud Certification Preparation Guide
Images in this blog post are the screenshots that I have made. Data sources that I have used are available (at the time writing this blog post) on
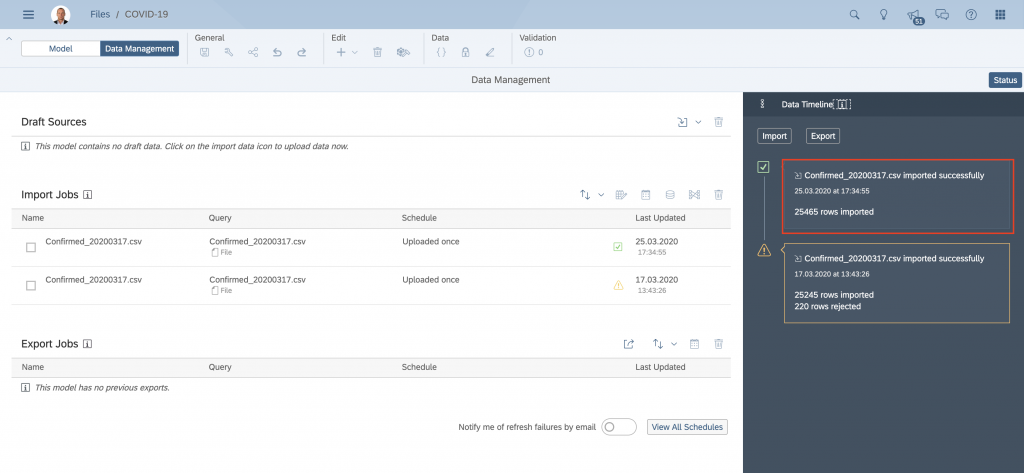
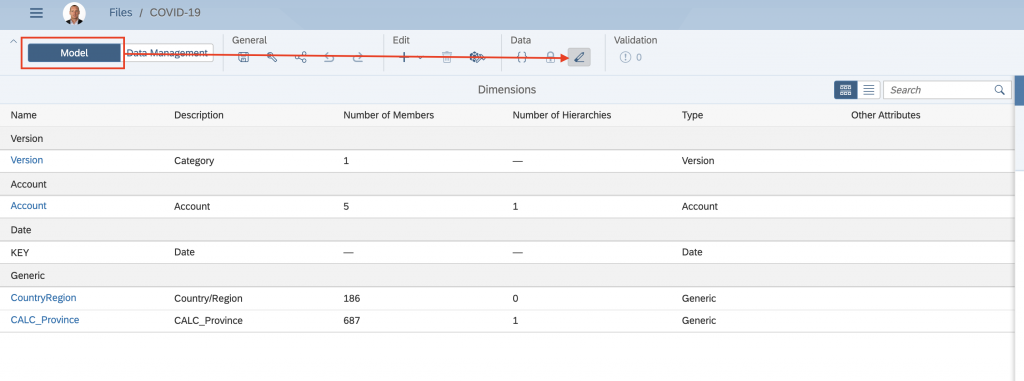
AD1:Resolve data quality issue
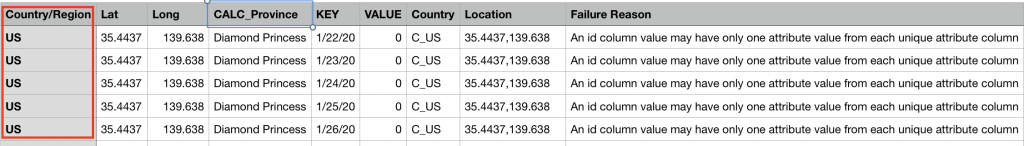
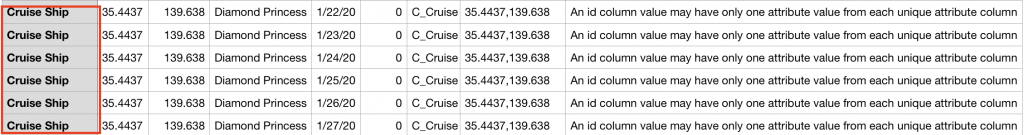
Just to refresh the memory…In the previous blog post some rows were rejected during the data upload. As you can see “Diamond Princess”(the same goes for “Grand Princess”) is using two different countries – “US” and “Cruise Ship”. This would not be a problem if we would use “Country/Region” as a separate dimension, but in our case we are using it (actually the calculation based on it) as a parent in our GEO dimension (That way we can aggregate & drill down from the country level into Province/State.
If we would detect this issue during data preparation phase, we could adjust the values of the parent before loading into the model, but this was not detected so we need to go down the different path.
Let’s upload the same file again into the SAP Analytics Cloud and enter into the data preparation mode by clicking on it:
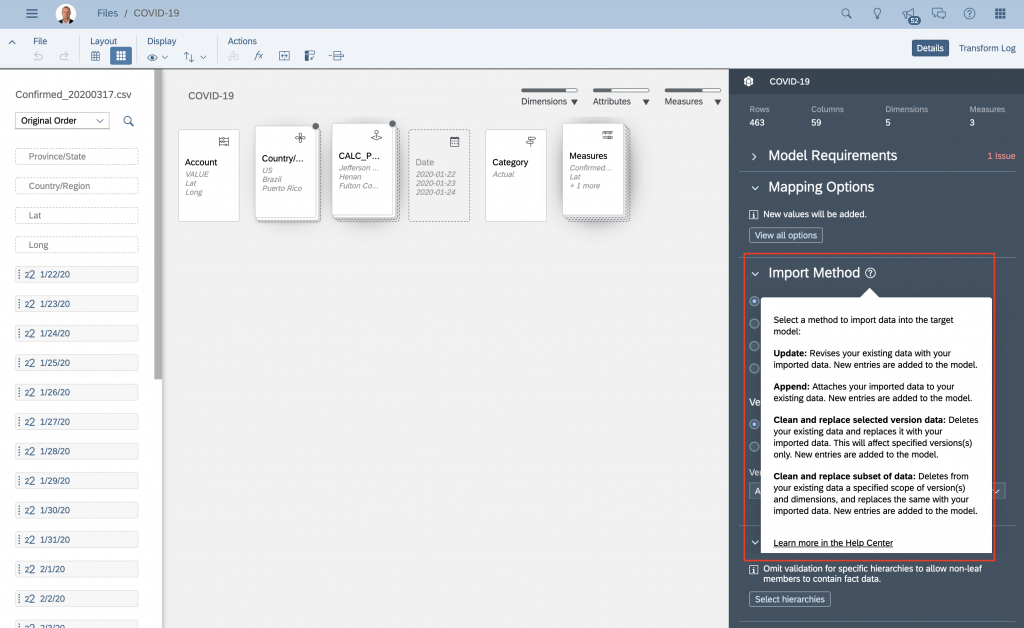
We are going to work with the “Update” mode of SAP Analytics Cloud (since this is our first slice of data that we have uploaded into the model, we could also use “Clean and replace”).
So, please repeat all the steps that I have listed below from the blog post part 1:
- Transpose the date from column header
- Create “CALC_Province”
- Create “Country” column
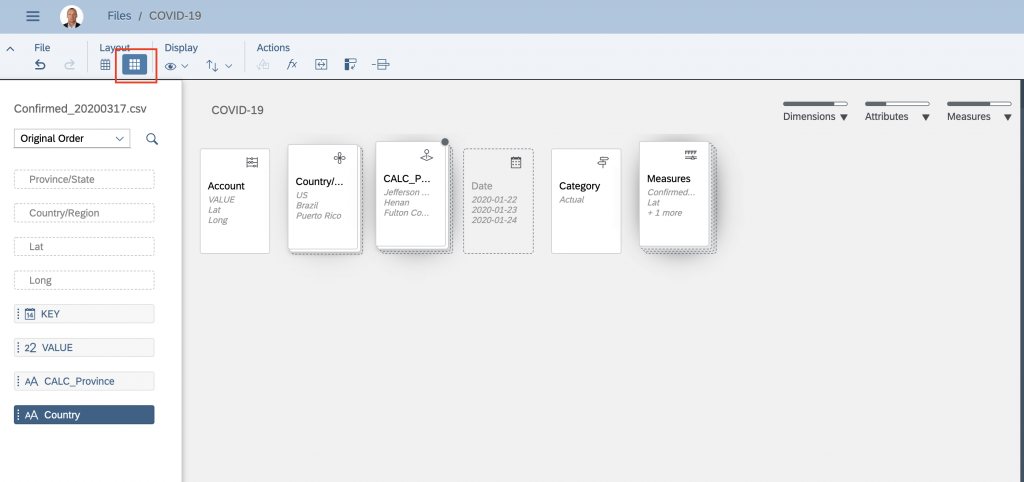
This is how your card layout should look like:
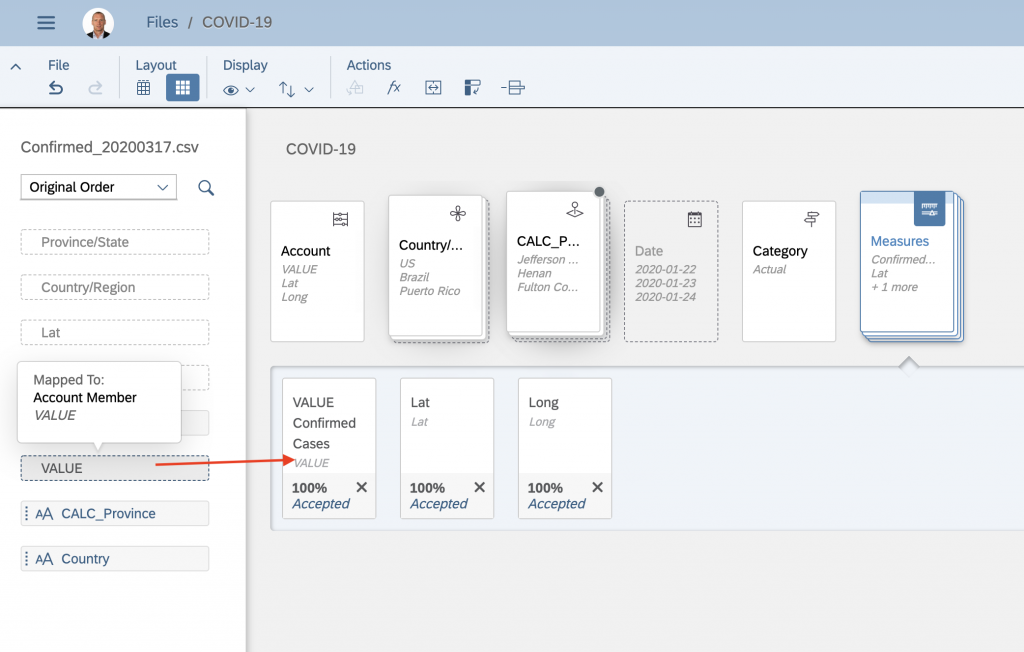
Now, let’s do the mapping. Double click the “Measures” card and drag and drop “Value” into “Confirmed cases”.
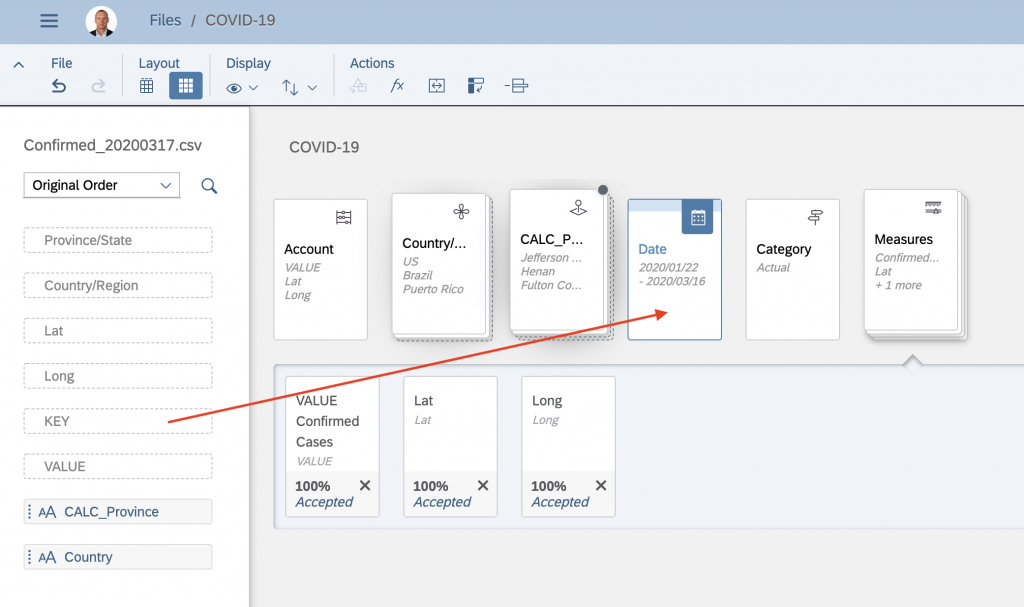
Move “Key”(our date field) into the “Date” dimension:
Disconnect current mapping of “CALC_Province” dimension by clicking X of the card and then double click it to open it:
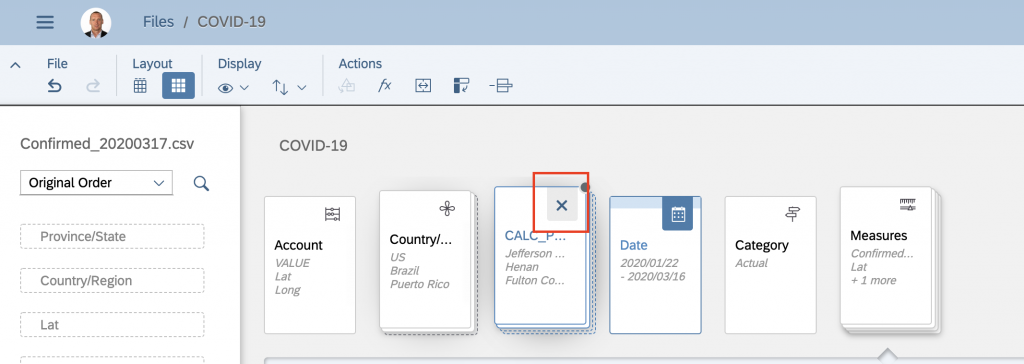
All items inside should be empty, meaning not linked to any existing columns of the data set.
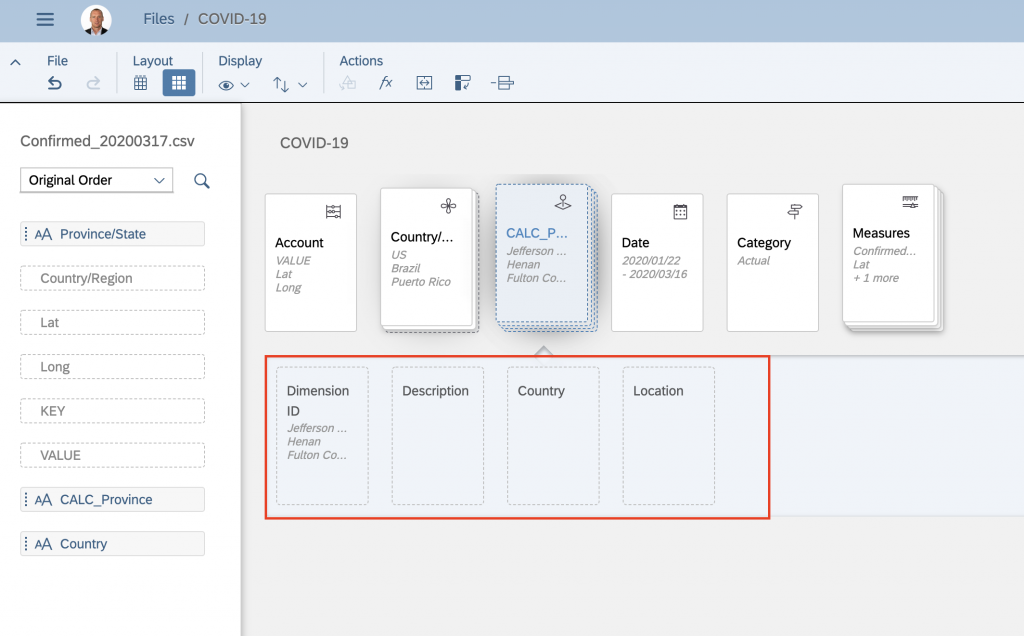
Now drag and drop fields from the data set as indicated:
CALC_Province -> Dimension ID
Country -> Country
After you did this, click on the “Location” card and adjust the mapping in the right side bar as shown below:
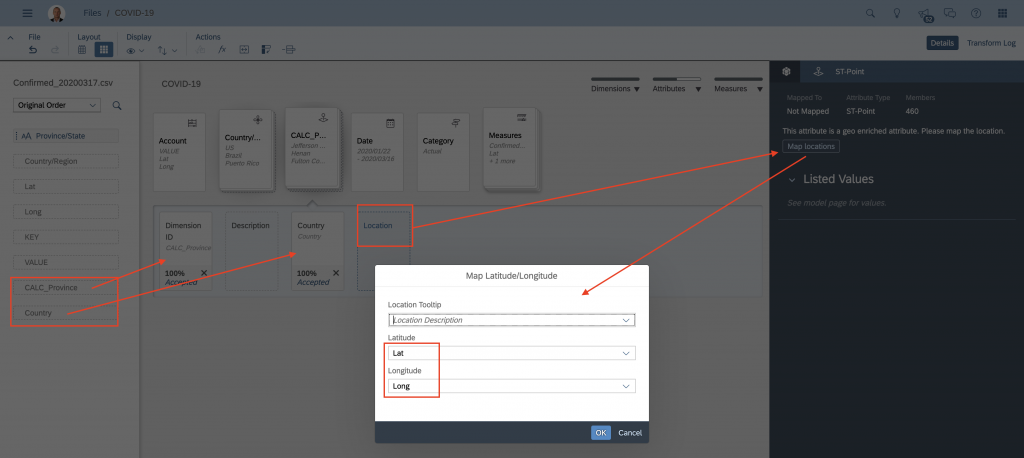
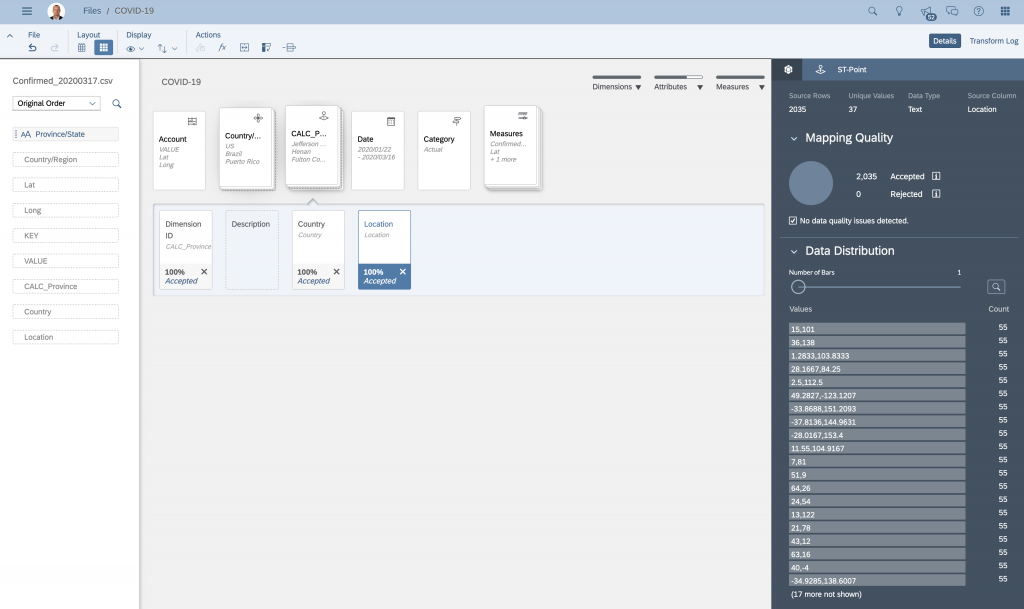
The result should look like this:
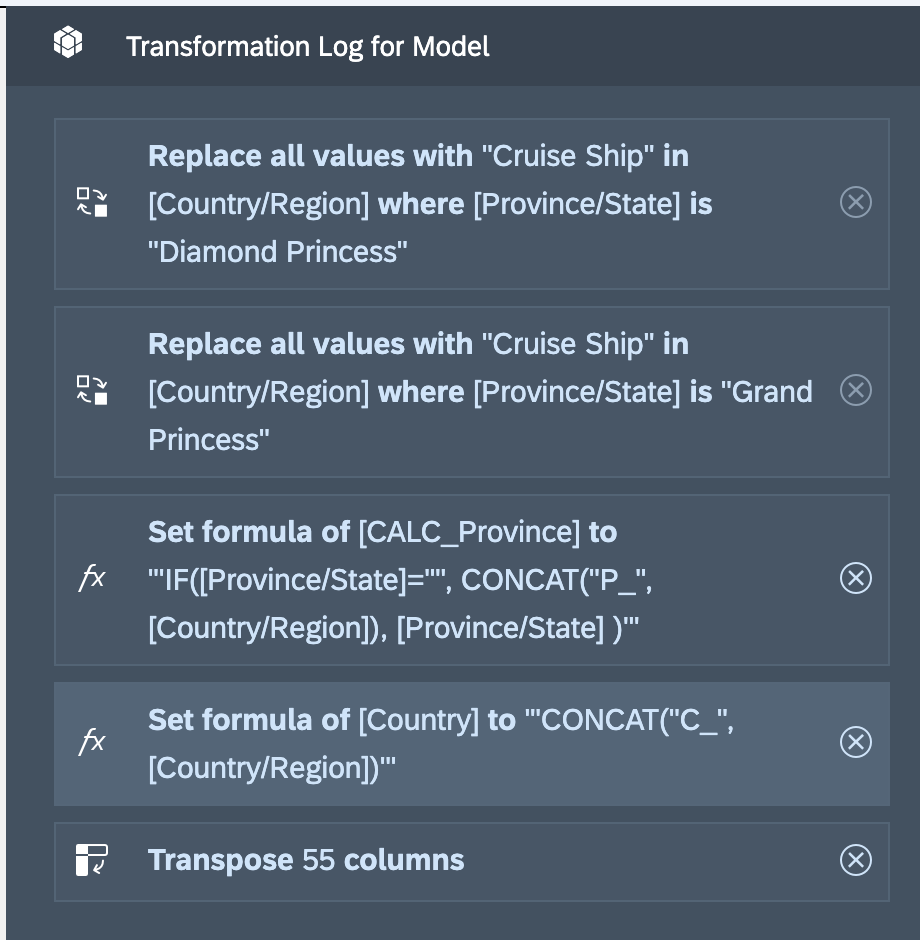
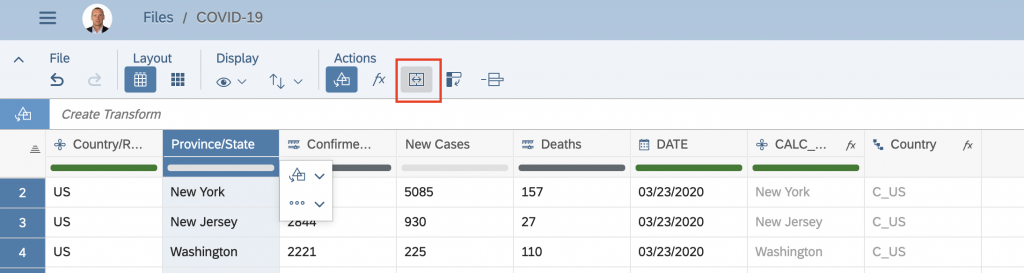
Now we are going to deal with the “Princess” problems described at the beginning. Please switch to the grid/column view and click on the column “Country/Region”. Then click into the formula bar and select “REPLACE” transformation:
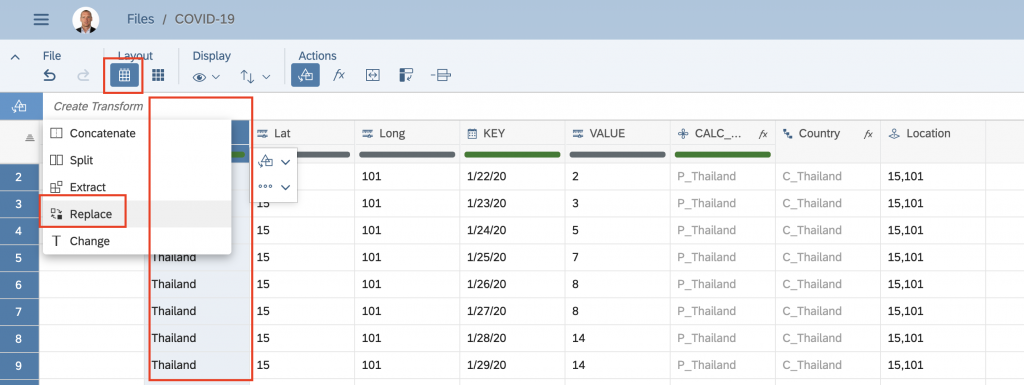
You will have to do the same process twice, for both ships: “Grand Princess” and “Diamond Princess”.
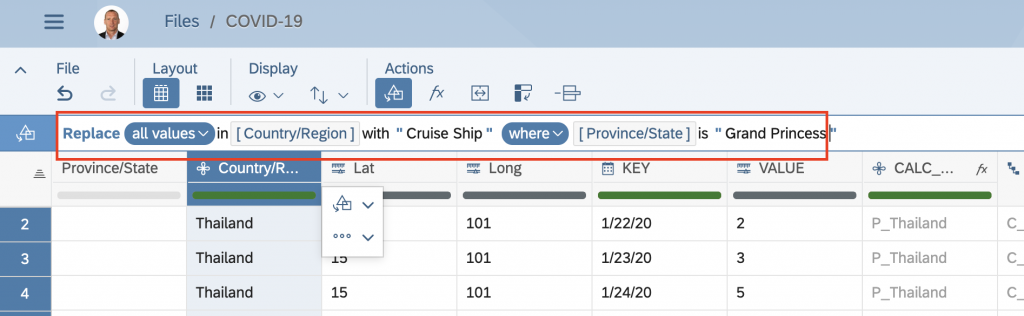
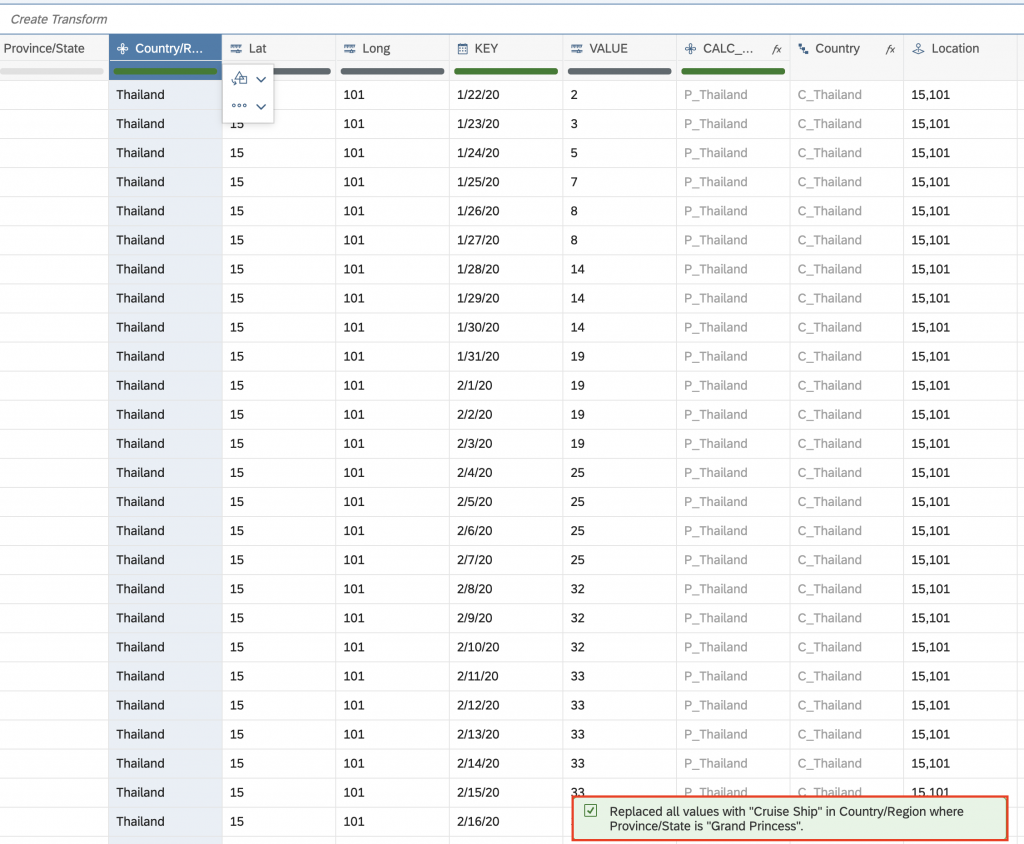
When you create the replace transformation, just press “Enter” and it will be activated. You should receive 2 messages bellow (the missing on in my screenshot was referring to the calculations update)
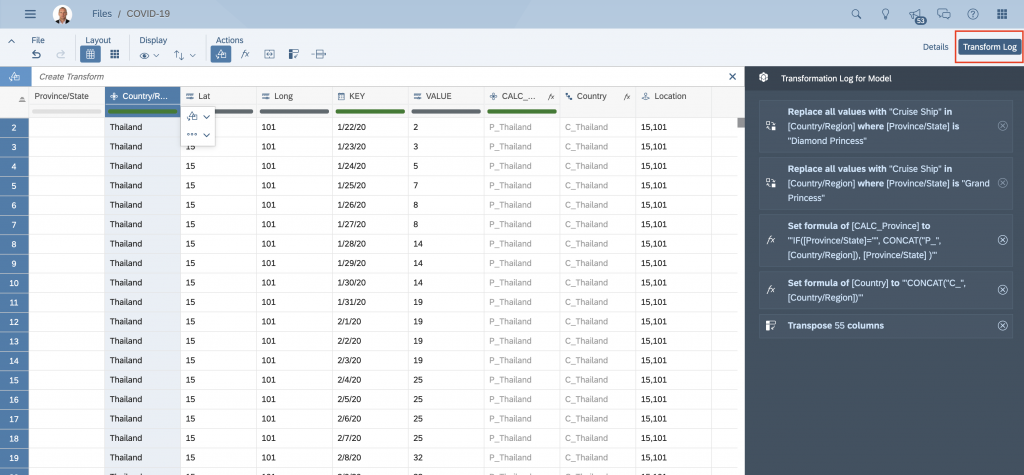
When done, you can also check all transformation in the transformation log and in case there is a mistake, just delete the transformation and perform it again, of course this time correctly:)
When done, press “Finish mapping” and finalise the whole data loading process. You should have zero rejected rows:
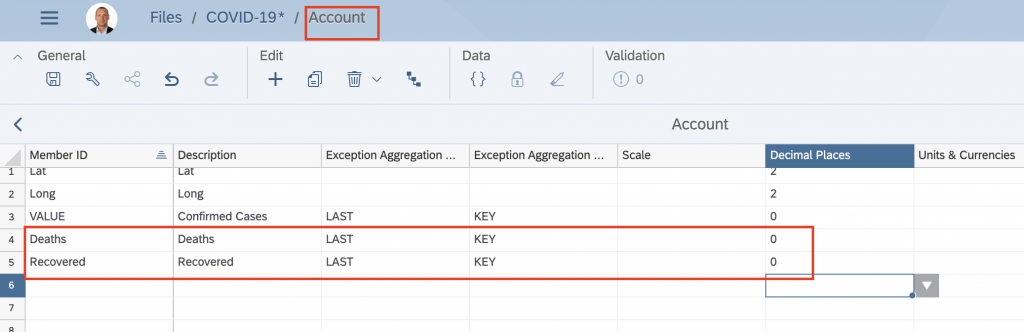
AD2: Add new measures and data sets associated with them
We are going to extend our model with two additional data sets that have the same structure but additional measures. So each data set contains only one (new) measure, a data set for deaths and a data set for recovered statistics.
First open our model and add two new measures as indicated below (don’t forget to setup the exception aggregation and decimal places) and save changes in the model.
We are going to load both data files into SAP Analytics Cloud as indicated below:
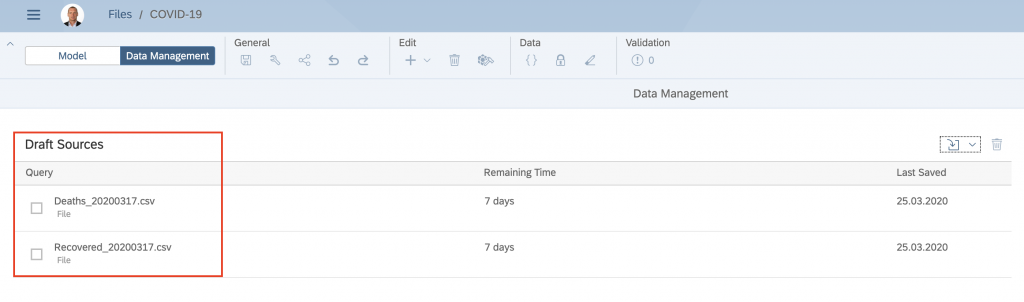
You need to repeat all the steps from above twice – remember we have two data sets – Deaths and Recovered, with one exception, the measure mapping:
- Transpose the date from column header
- Create “CALC_Province”
- Create “Country” column
- Mapping of date column
- Mapping of CALC_Province, Country, Location (don’t forget to do this otherwise your maps will be half empty)
- Perform 2x Replace transformation (“Grand/Diamond” Princess”)
- Measure mapping: map VALUE of corresponding data set to corresponding measure:
- Deaths.VALUE -> Deaths
- Recovered.VALUE ->Recovered
- Deaths.VALUE -> Deaths
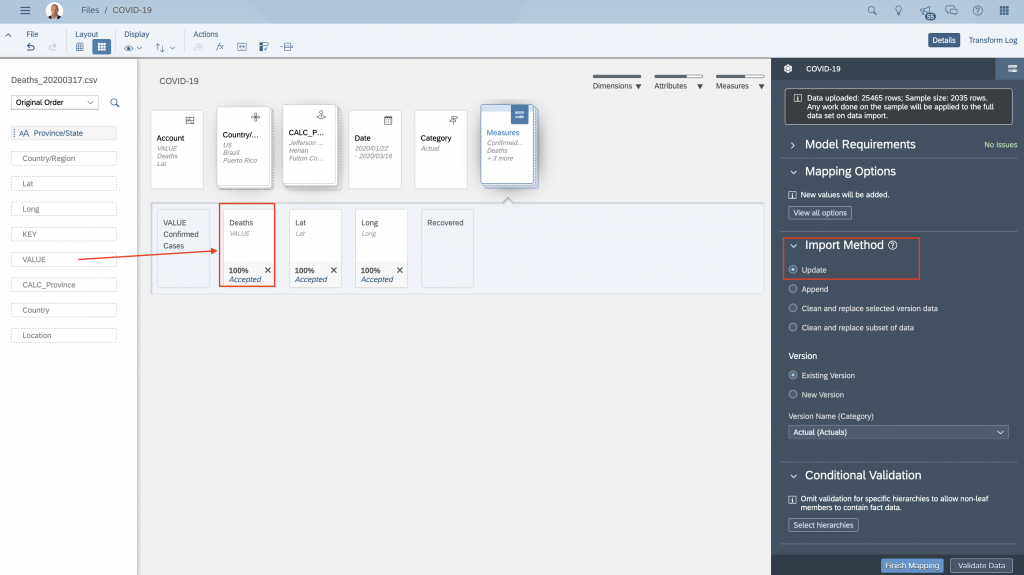
Please make sure that you have to select UPDATE import method (should be there by default, but still).
This is the list of transformations that I’ve done:
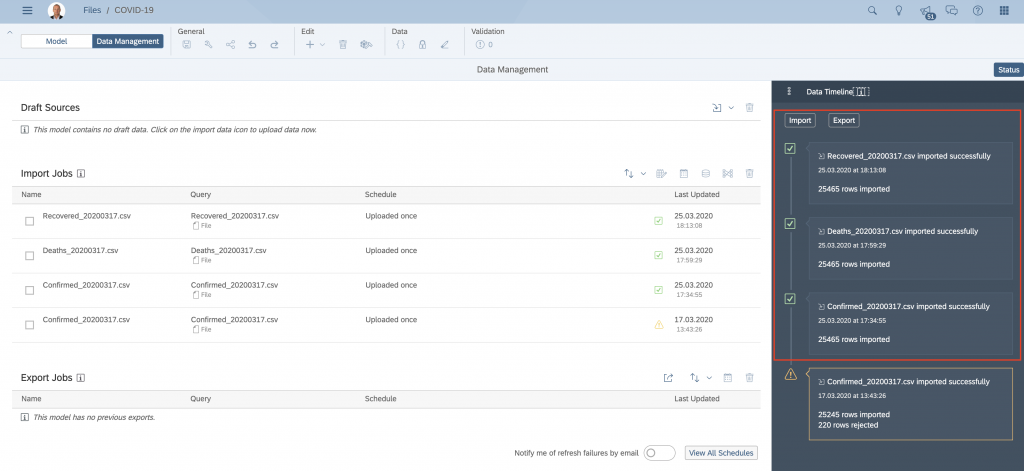
After you’ve done this should be the number of data sets loaded in your model with row count as indicated in the picture below:
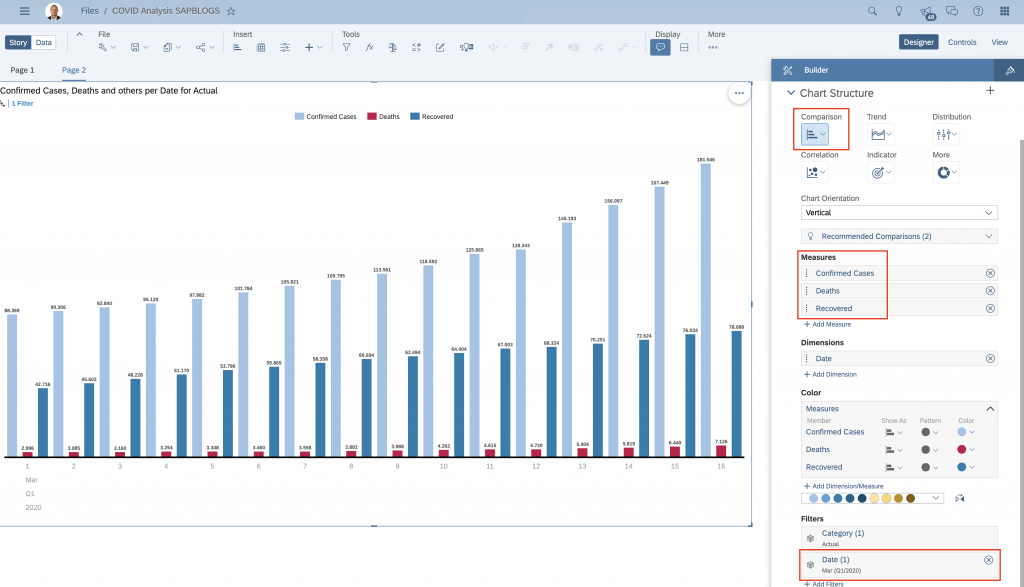
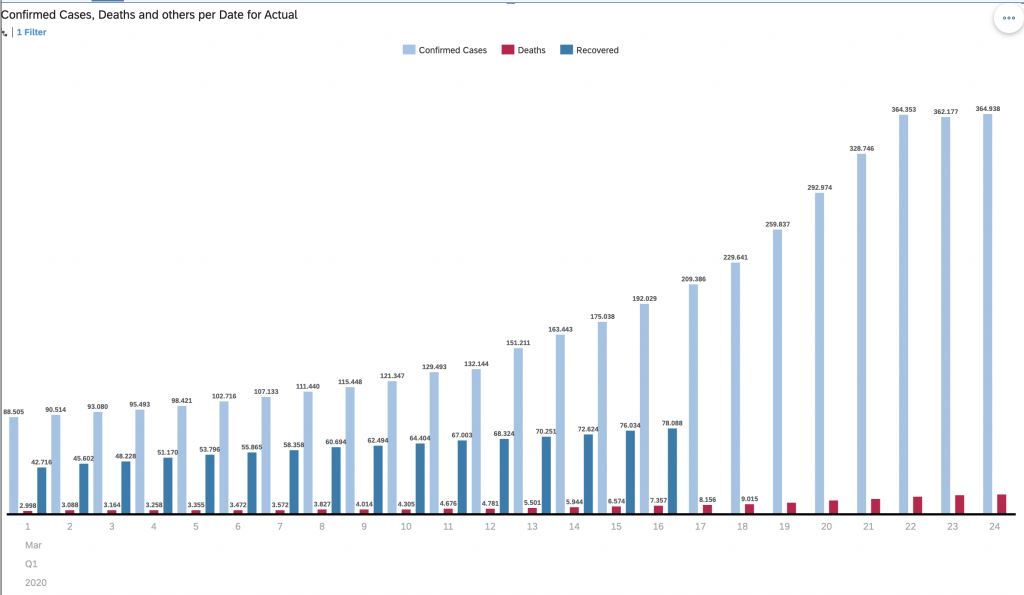
Another thing that I warmly recommend is to do a simple data check by building a simple story just to see if the data was imported & mapped correctly. It is easy to spot anomalies/data quality issues in a simple bar/column chart.
In our case you should have data loaded for 3 measure until 16.3.2020 (we are using files that contain data until 16.3.2020).
AD3: Import/upload new data
Ok, so here we are at the time of writing this blog post (25.3.2020), many things related to COVID19 data sets have changed so I’ll try to show how we can manage it. In this section we are going to upload all the data available until yesterday, which means until 24.3.2020.
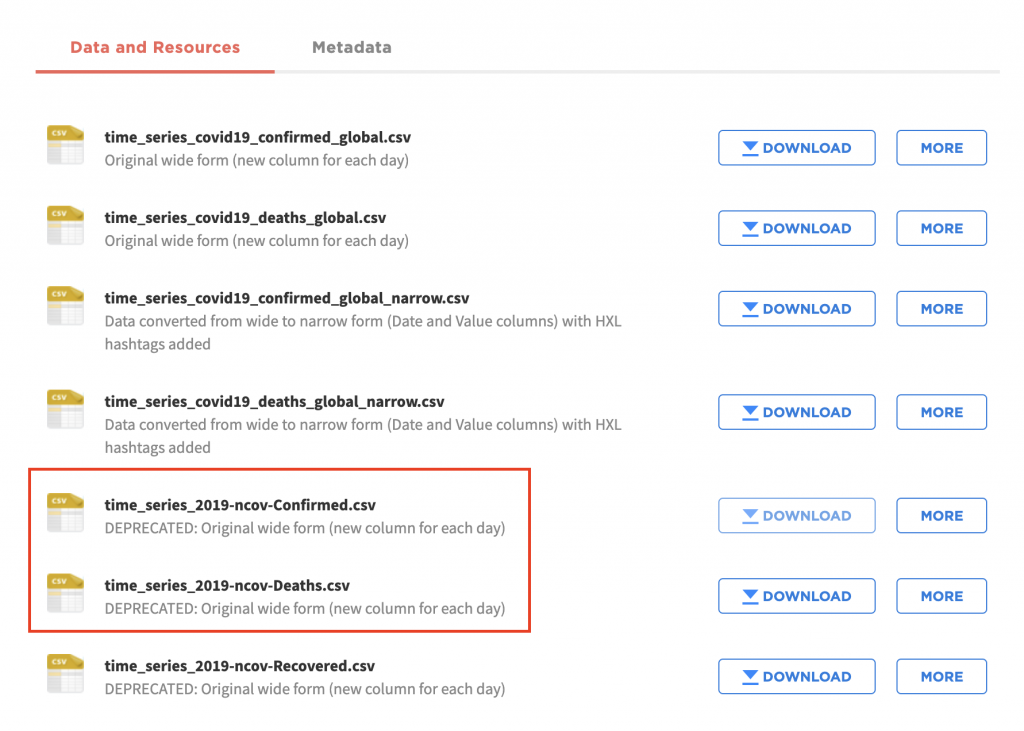
So the most important change is that previously used data sets are not updated any more, and the new data sets contain only aggregated numbers for the US Federal States. So we could just simply start using those, but since this is a blog post where I would like to show you other options of data integration, we will make this a bit more complicated, but not too complicated. Another important notice is that the “Recovered” data set is not going to update anymore, so we’ll ignore it during the loading and also when performing analysis. Feel free to flag it as hidden in modeller.
and we will combine it with more detailed data for the US Federal States, taken from here
Let’s first work on the DEPRECATED “Confirmed cases” data set so that we get the latest available data that includes US Federal States details as well.
First we plan to import this data set and then delete data where:
- Date =”23-03-2020″ (it’s just the copy of “22-03-2020”) AND Country = “US”
In order to do this, please repeat all steps from the AD2: Add new measures and data sets associated with them of this blog post:
- Transpose the date from column header
- Create “CALC_Province”
- Create “Country” column
- Mapping of date column
- Mapping of CALC_Province, Country, Location (don’t forget to do this otherwise your maps will be half empty)
- Perform 2x Replace transformation (“Grand/Diamond” Princess”)
- Measure mapping: map VALUE of corresponding data set to corresponding measure:
- Deaths.VALUE -> Deaths
- ConfirmedCases.VALUE ->Confirmed Cases
- Deaths.VALUE -> Deaths
You can also see the steps in this video here:
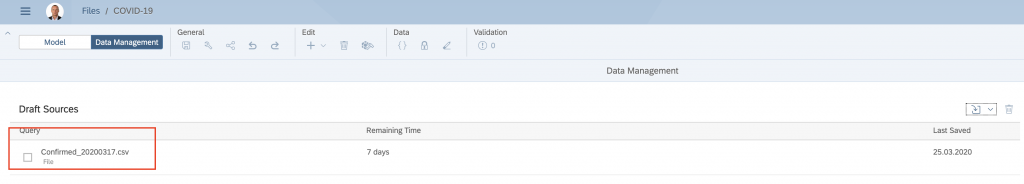
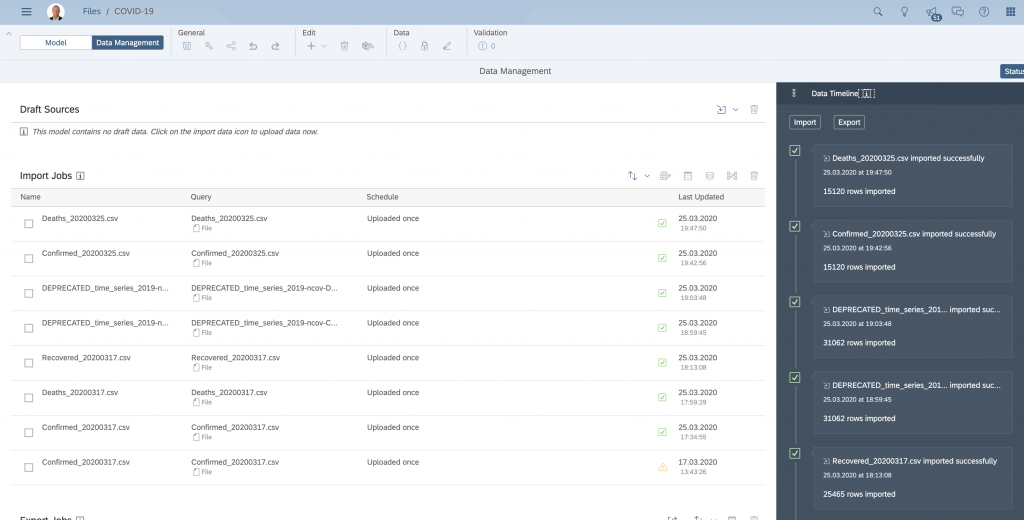
You should have this information in the import section of the model:

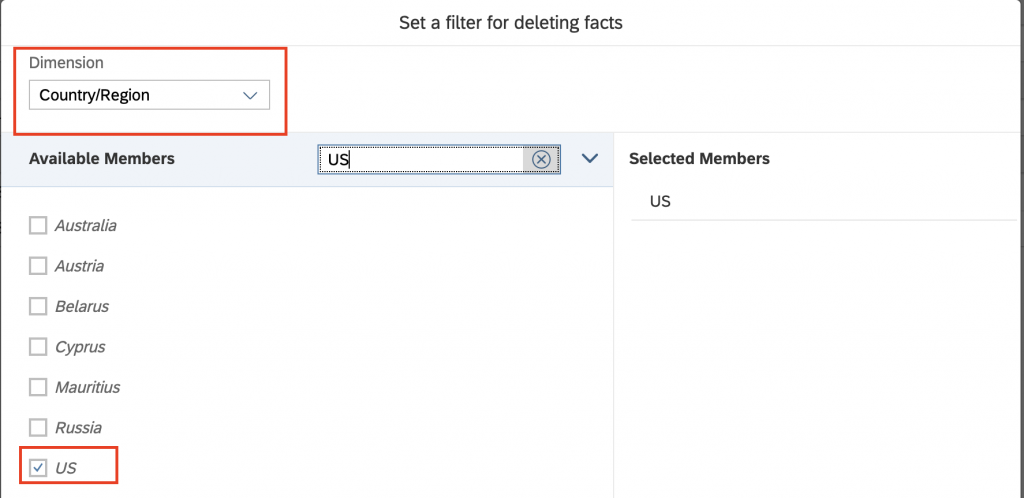
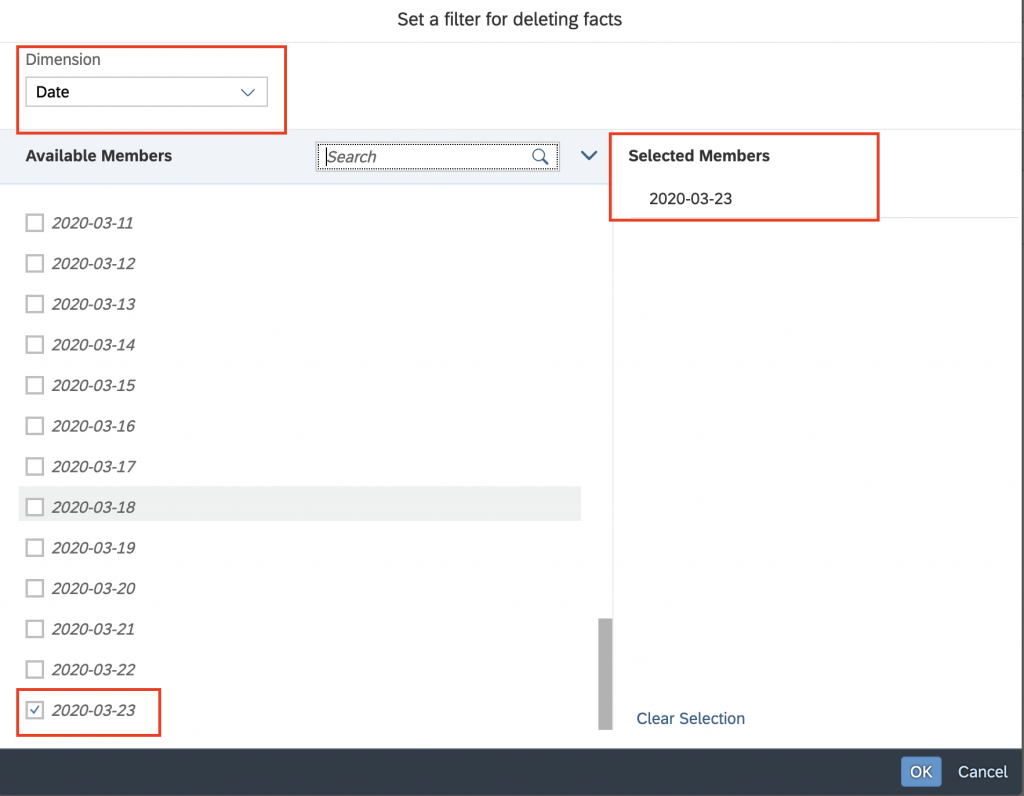
In the next step, we are going to delete the data for:
- Date =”23-03-2020″ (it’s just the copy of “22-03-2020”) AND Country = “US”
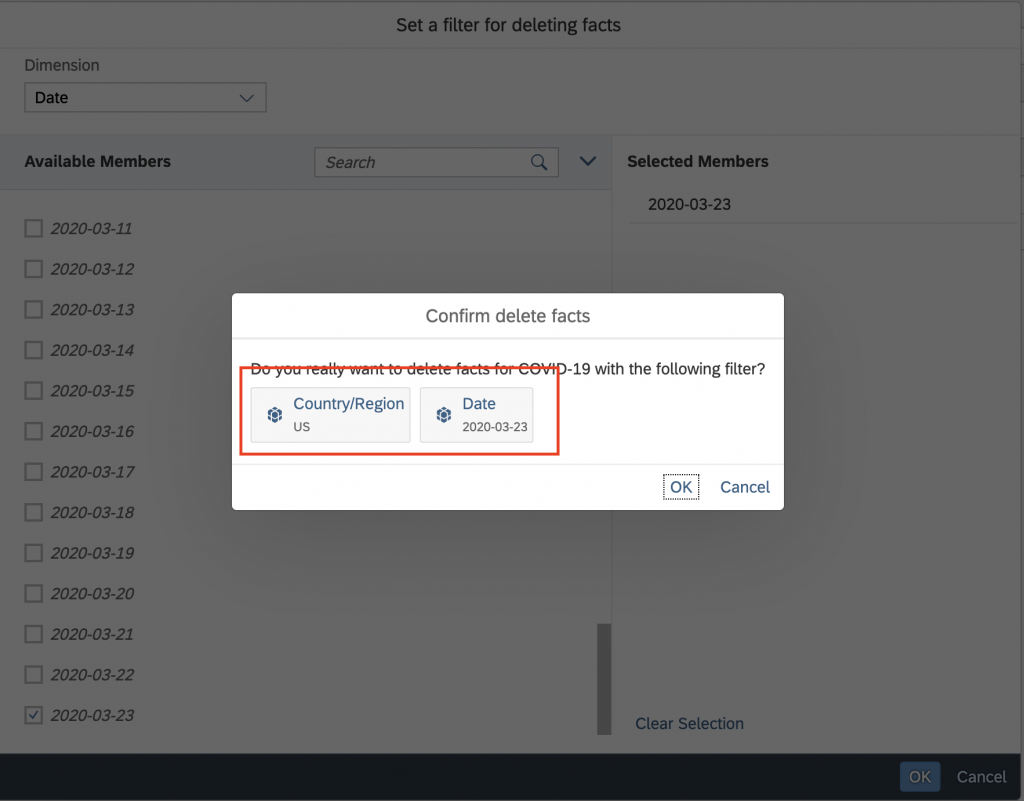
Enter the model section and jump into delete section:
Select Country US and Date as “23-03-2020” and proceed with data deletion.
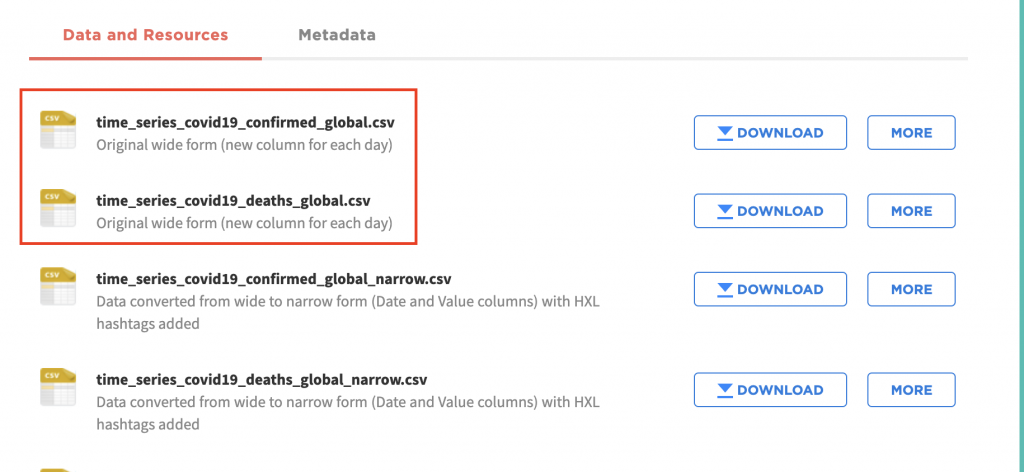
The data has been deleted. Now we are going to upload the latest data set available until the date 24-03-2020 (included). Please download the files from here and before you upload them into SAP Analytics Cloud DELETE the cumulative row for US from the CSV file. We are going to upload the US data from another source.
Please repeat steps indicated above with import method UPDATE or just replicate them from the video above:
- Transpose the date from column header
- Create “CALC_Province”
- Create “Country” column
- Mapping of date column
- Mapping of CALC_Province, Country, Location (don’t forget to do this otherwise your maps will be half empty)
- Perform 2x Replace transformation (“Grand/Diamond” Princess”)
- Measure mapping: map VALUE of corresponding data set to corresponding measure:
- Deaths.VALUE -> Deaths
- ConfirmedCases.VALUE ->Confirmed Cases
- Deaths.VALUE -> Deaths
Ok, so by now you should have this situation in model and in our “control” story:
Remember, we still need to upload the US data for last two days that i downloaded from a different source: Worldmeters I have copy/pasted the data from a table into the spreadsheet and cleaned it a bit. Like I mentioned at the beginning of this blog post, the files are available here.
So this is the final chapter of this blog post and this is how it goes.
THE “COMBINE” CHAPTER:
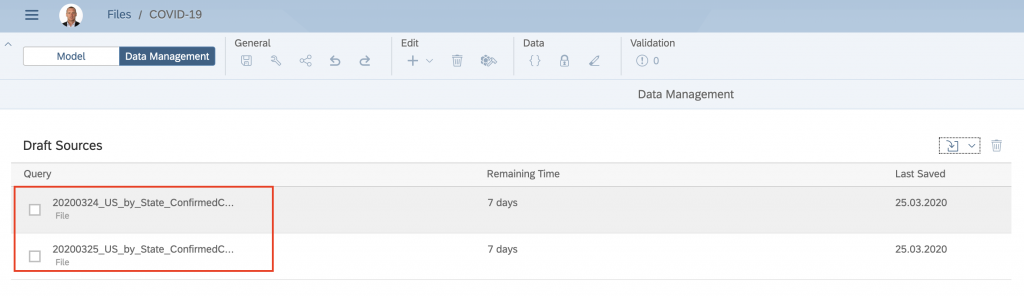
Upload both files that contain US data:
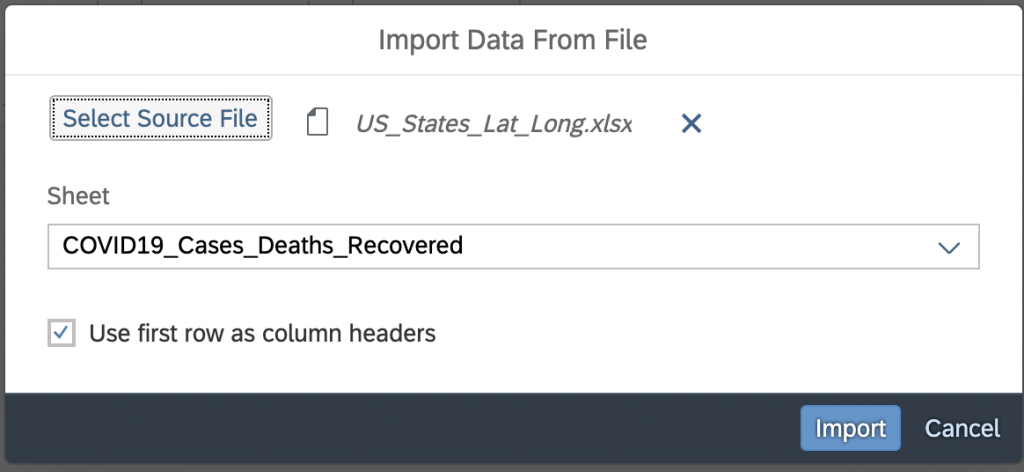
Open the one starting with “20200324….” and work with it. Because the data set doesn’t contain LAT & LONG info we are going the use another data preparation functionality called “Combine data” where we are going to combine it with the data set that contains US State, LAT, LONG columns.
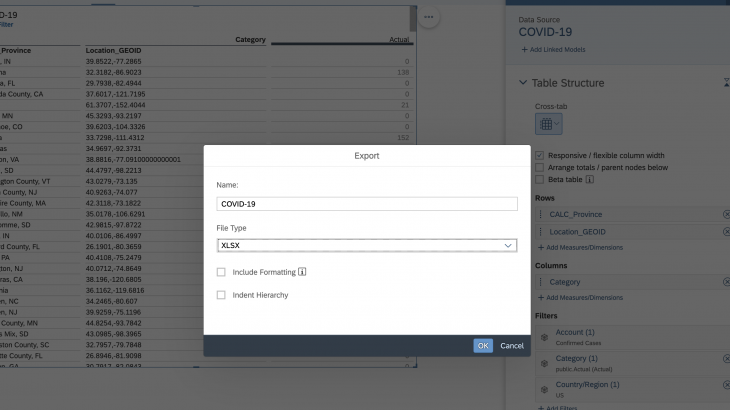
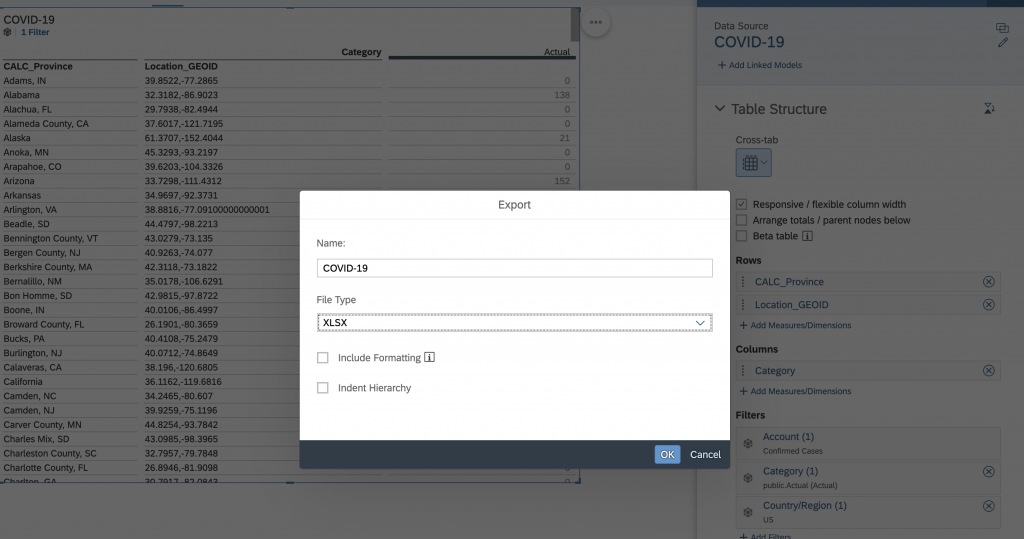
TIP: In order to the “perfect” merge, i have created a simple table in our SAP Analytics Cloud story and then exported the data in the XLSX format, so that i can reuse it in the “Combine data” action.
You should also use FLAT hierarch display for it. Afterwards I have cleaned up a bit the file so that I can use it here.
Here are the steps that we’ll perform before going into the “combine data” part:
- Create “CALC_Province”
- Create “Country” column
- Map newly created columns “CALC_Province” and “Country” to the ID and Country members of “CALC_Province” dimension.
- Check if the measures are mapped correctly (data set contains both relevant measures)
Ok, so now we are going to combine this data set with the US LAT & LONG data set so that we can visualise the data on a map.
Click “Combine Data”
and select the LAT & LONG data set:
Click on both “Province” columns that we’ll use in our “JOIN”, you can leave other options as is (of course feel free to explore them:)) and press “Combine” at the bottom right.
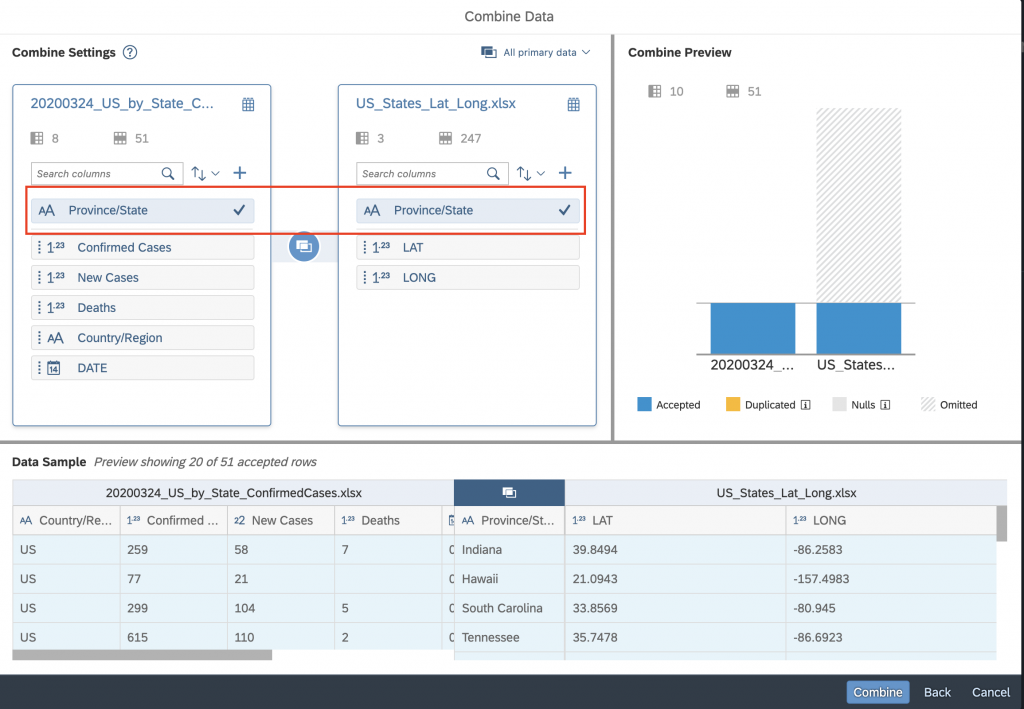
NOTE: Please also make sure that “All primary data” on top is selected (should be there by default) because we don’t want to loose any “fact data”.
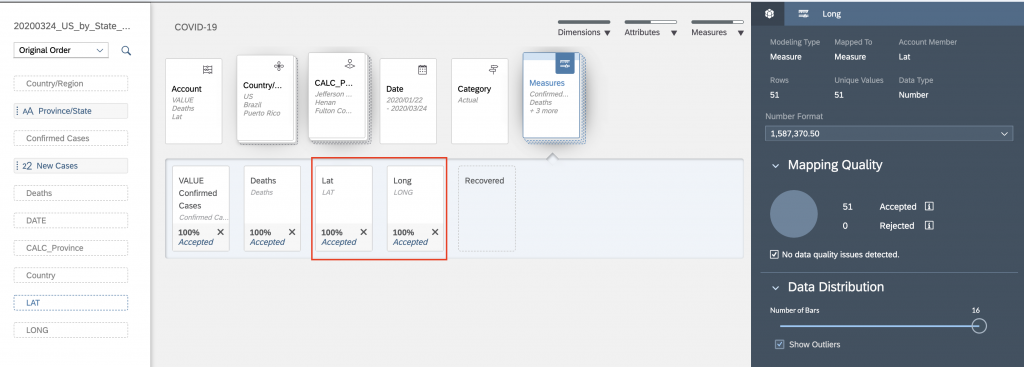
LAT and LONG are added as additional columns. Please them into the measures as indicated below:
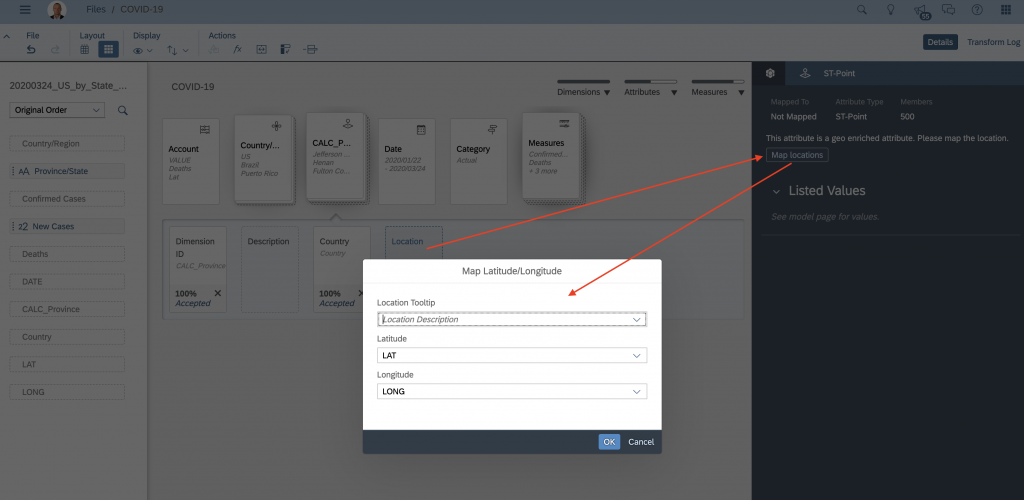
And even more important make sure to perform GEO mapping, double click on CALC_Province card to open all members of it and then do it:
Finish the mapping and import the data into the model. Please repeat all steps from THE “COMBINE” CHAPTER for the second data set of US only data that we have uploaded into SAP Analytic Cloud.
Ok, with this task we have concluded the exercise. Your model and story should look something like this:
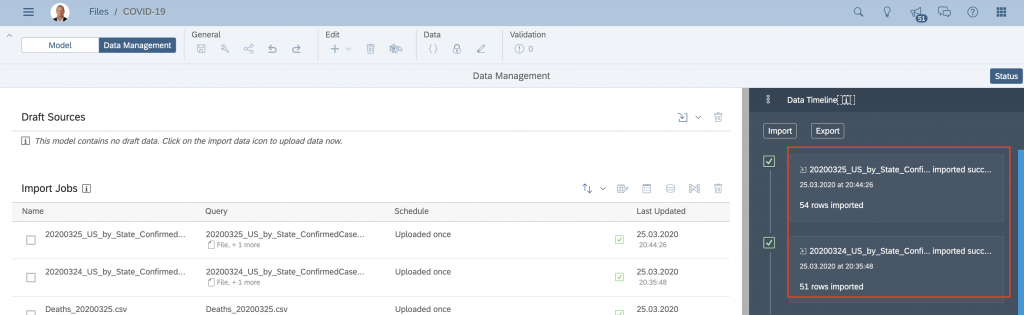
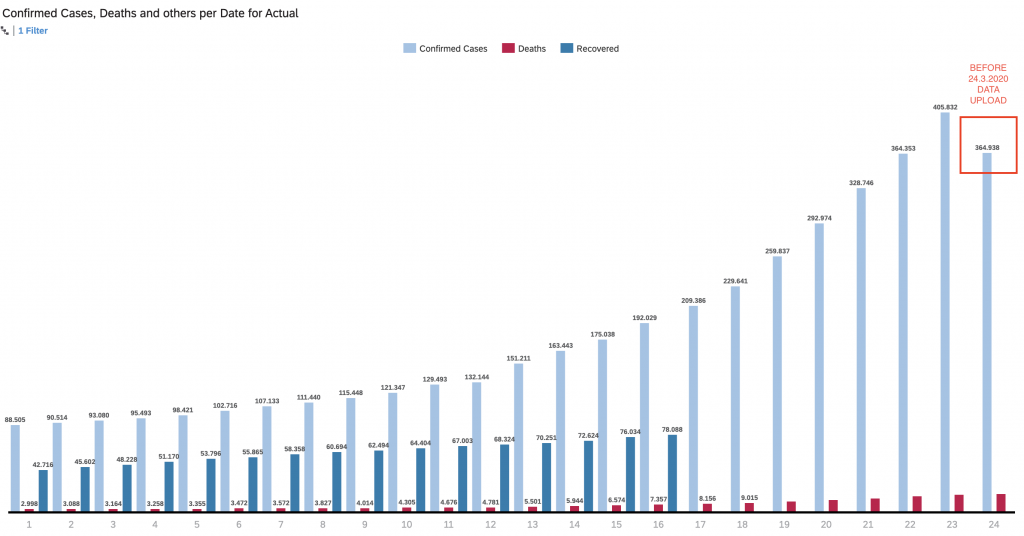
Here is BEFORE the 24-3-2020 upload:
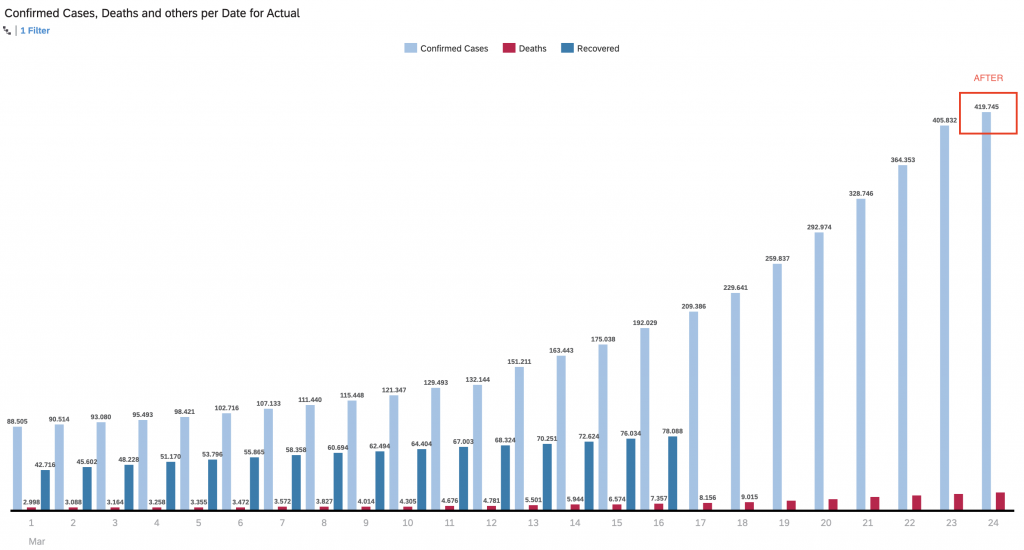
…and AFTER the upload.
As you can SAP Analytic Cloud offers a lot of flexibility to work with your data even before it comes into the dashboard/story. Of course there are also some other ideas how you could improve the whole process, but I wanted to show you how somebody like “DATA ANALYST” could work with the data and perform some steps to clean and structure it properly.
FINAL THOUGHTS
Here are some additional ideas on how to simplify, but not necessary make this process cheaper:
- Integrate COVID-19 data into a data mart – like SAP Data Warehouse Cloud and consume it from there with SAP Analytics Cloud
- Establish a scheduling of file import from a FILE SYSTEM (location)
- for this you’ll need to setup SAP Cloud Connection and SAP Analytics Cloud Agent
- the good thing is that all those transformation that we did manually will be applied during every import
- of course you need to make sure to have a stabile data source:)
- Use different data source like Microsoft OneDrive or Google Spreadsheets and perform import into SAP Analytics Cloud
- the connectivity is available
- scheduling is available
- transformation will be respected during data import
- you need to make sure to have a stabile data source
Solutions mentioned above, their advantages/disadvantages can be also a discussion worth of a stand alone blog post.
Ok, that’s all for this part, stay tuned fo the next one where I will show how to visualise & analyse the data.
Stay COVID19 free!!!
#StayAtHome


