SAP Business Technology Platform offers great capabilities in analytics space under the Intelligent technologies offerings with products like SAP Data Intelligence, which provide ways to club the advancements in the open source analytics world with data integration options to SAP and Non-SAP systems.
In this blog post you will learn an example use of Computer Vision (using OpenCV Python) in SAP Data Intelligence to scan QR codes on material labels to retrieve attributes , scan a bikes images to get its dimensions and then run a data pipeline to ingest gathered material information to S4HANA .Finally we use the Master Data Consolidation module in S4 to enrich the product master records.
CASE 1: Our scenario here is that of a product for which we need to get latest weight in KG by scanning QR codes on its new package label from a video feed (remote shipping location), then processing data and triggering a data pipeline to submit the details to S4HANA for consolidation. Outcome is an enriched product record in S4HANA which is then utilized by several downstream systems.
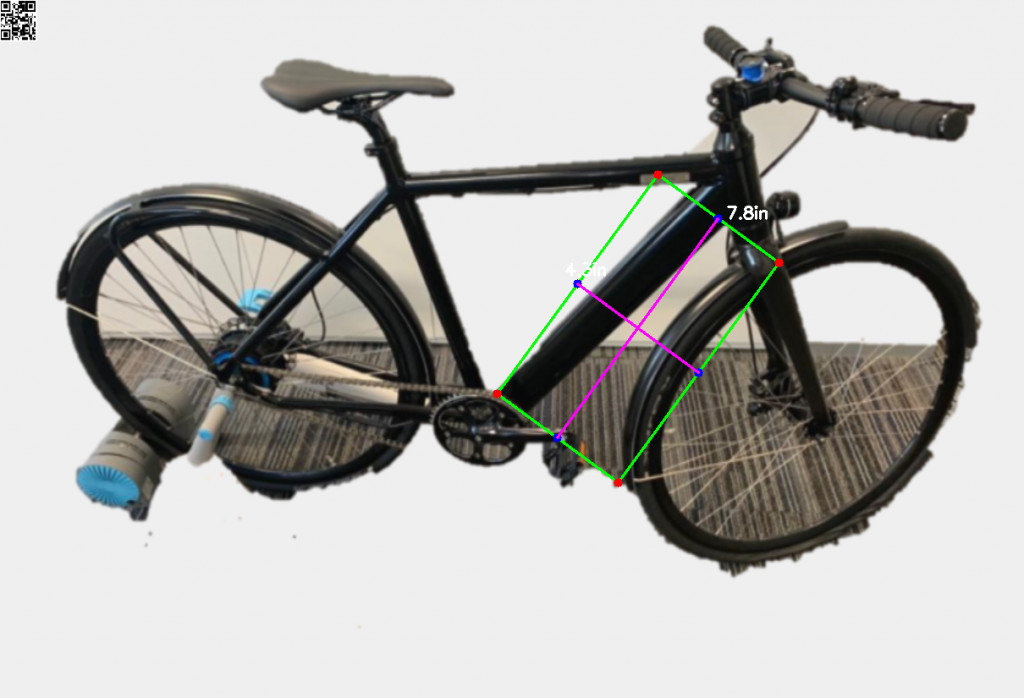
CASE 2 : In our aim to show the possibilities around OpenCV , we further examine a bike’s Image and try to deduce its dimensions (using a reference point), we then process the data ( length & height) , and again trigger a data pipeline to consolidate records in S4HANA. The outcome is that the bike gets its dimensions recorded/updated in S4. We would be showing the OpenCV part in Jupyter Notebook, the data pipeline step is exactly same as in CASE 1.
Let’s begin!
SAP Data Intelligence Cloud
We start with SAP Data Intelligence cloud’s notebook environment wherein we are analyzing a recorded video of a few materials on a shelf, we further develop a function to decode QR codes in Python and then use open CV to load the video stream and process it frame by frame to detect QR codes & apply our decode function!
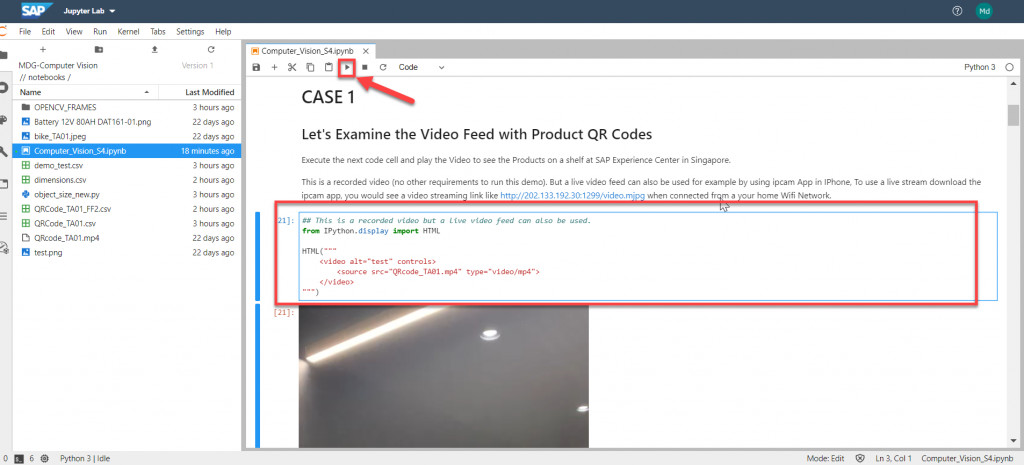
Let’s look at the video which is already uploaded in the notebook session, note we can also work here with video streams if available on http/https links to process feeds as they are made available, we will see it in the later section.
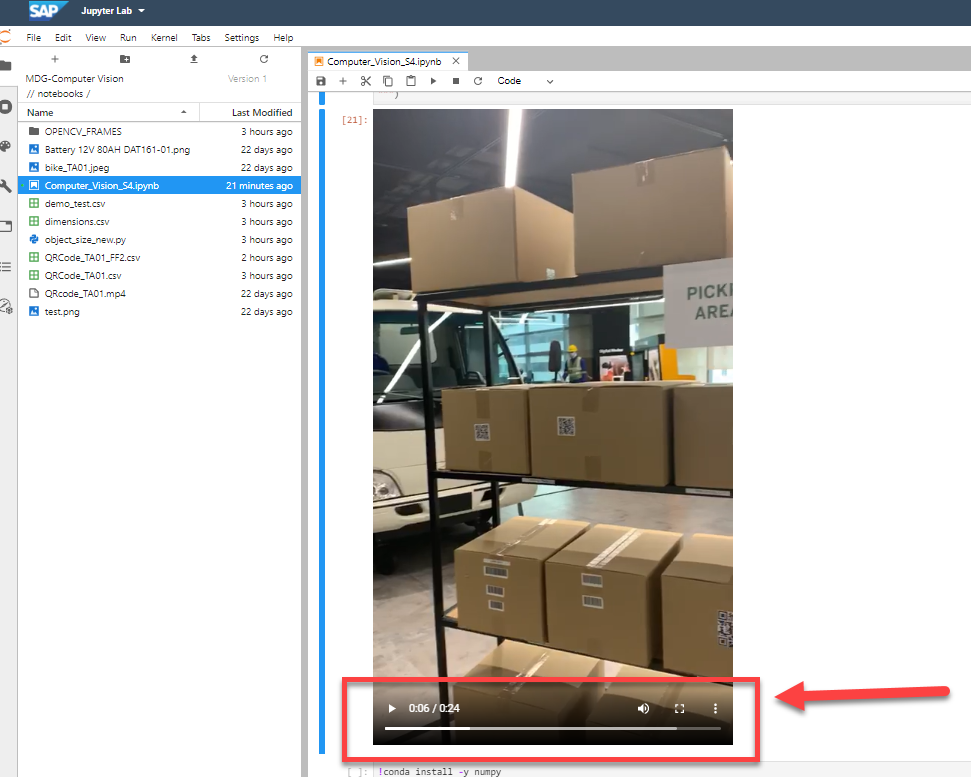
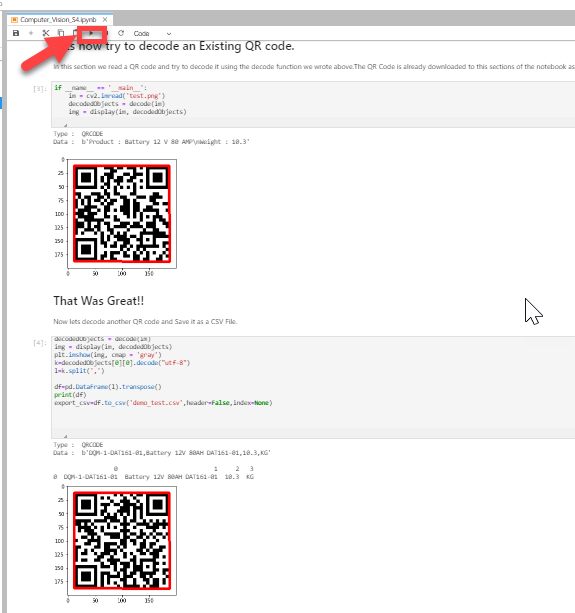
We have two sample QR codes which are being read and decoded by the decode function using pyzbar library in Python. The decoded information is seen below with
Product name : Battery 12 V 80 AMP , weight : 10.3 KG.
We can of course now use the pandas dataframe handling to persist this as a csv:
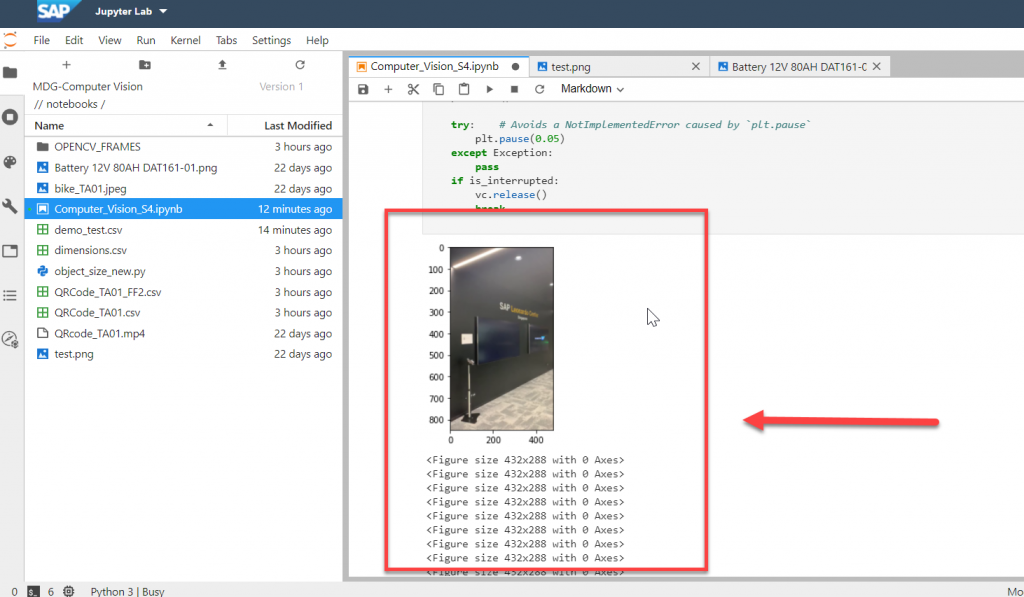
Now Let’s perform a video capture using OpenCv (a cv2 object below) :
vc = cv2.VideoCapture('QRcode_TA01.mp4')  #--> Recorded video to enable
#vc = cv2.VideoCapture('https://202.133.192.30:1299/video.mjpg')  #--> Example Live Video Stream from Factory or Plant or Warehouse
For each frame captured detect a QR code , apply decode the function and persist the decoded information to a CSV file:
while is_capturing:
    is_capturing, frame = vc.read()
    try:
        frame = cv2.cvtColor(frame, cv2.COLOR_BGR2RGB)
    except:
        pass
    try:
        decoded_Objects = decode_di(frame)  # apply the QR Code decode Function
    except:
        pass
    if decoded_Objects:
        plt.draw()
        k=decoded_Objects[0][0].decode("utf-8")
        l=k.split(',')
        df=pd.DataFrame(l).transpose()
        with open('QRCode_TA01.csv', 'a') as f:
            df.to_csv(f, header=False)                 #save the decoded information into a csv file.
We can now begin processing the Video Stream , frame by frame :
For each frame if a QR code is found then the information is decoded and written to CSV :
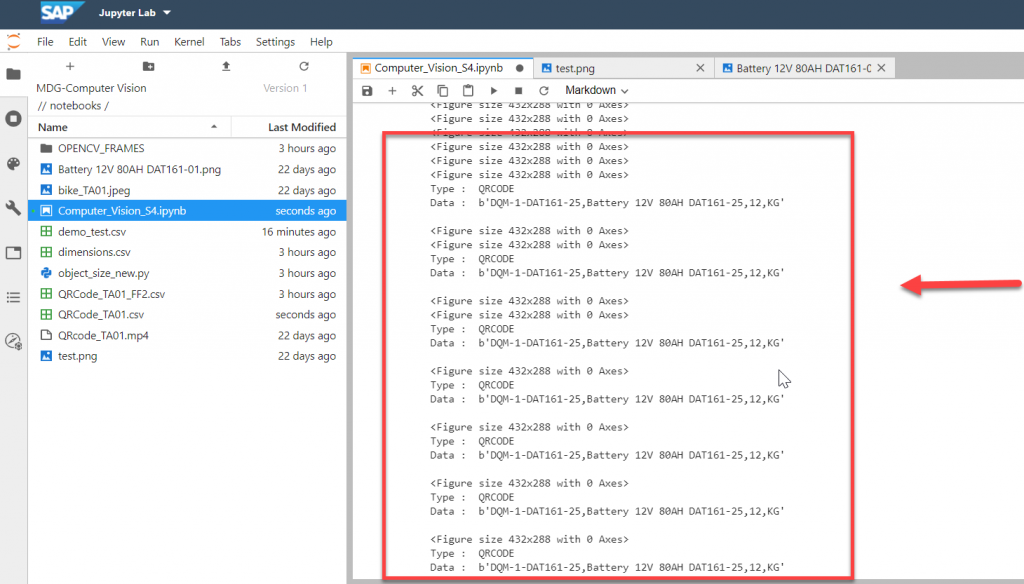
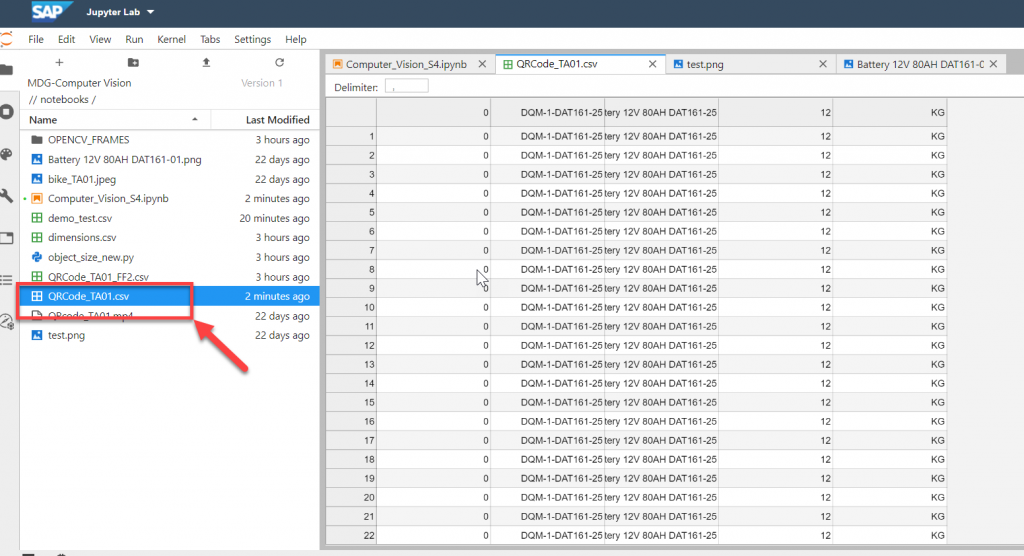
Here is the CSV with the output , note we have duplicates as for each QR code there were multiple frames but these can be easily handled :
Let’s move to the second use case!
Bike’s Dimensions
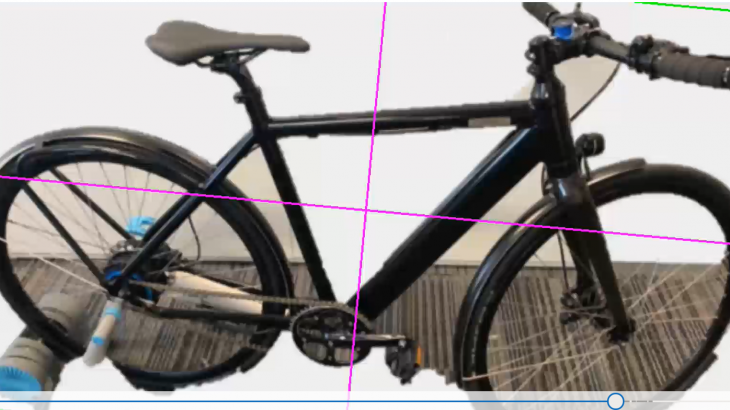
Let’s load the sample Bike’s image
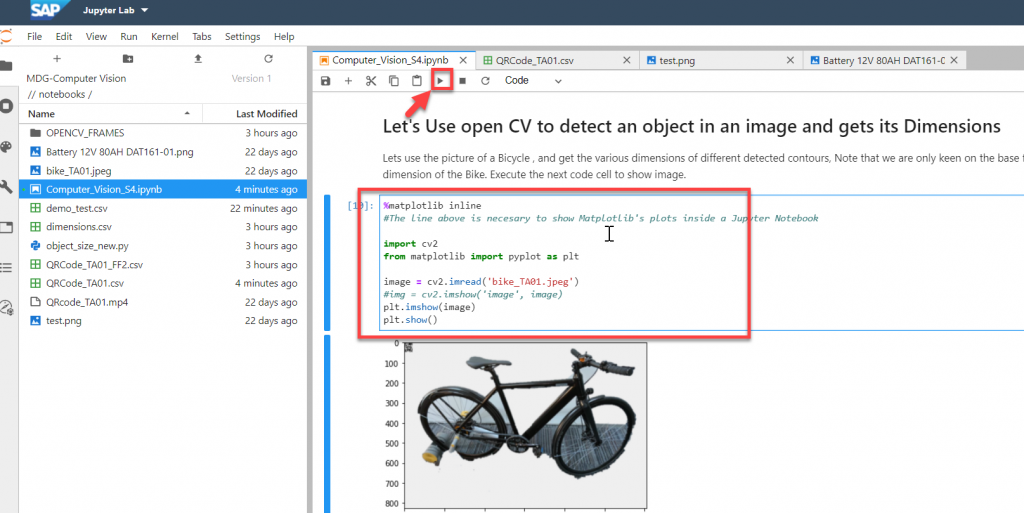
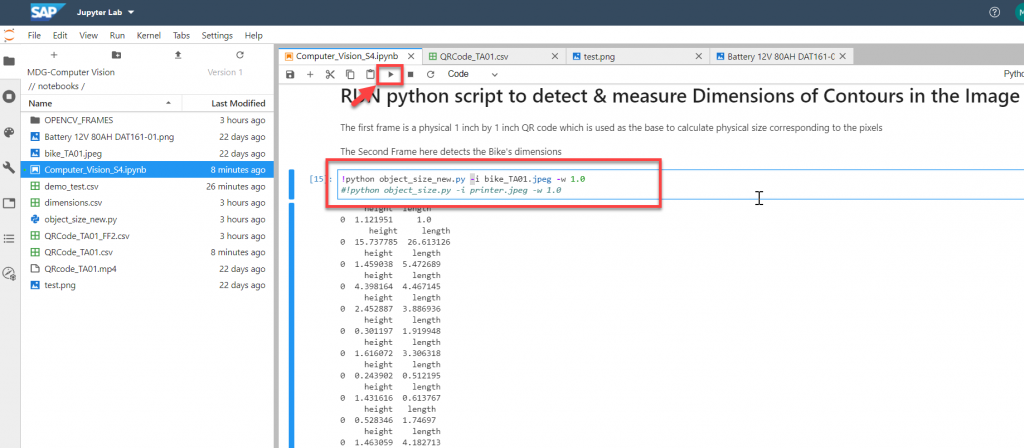
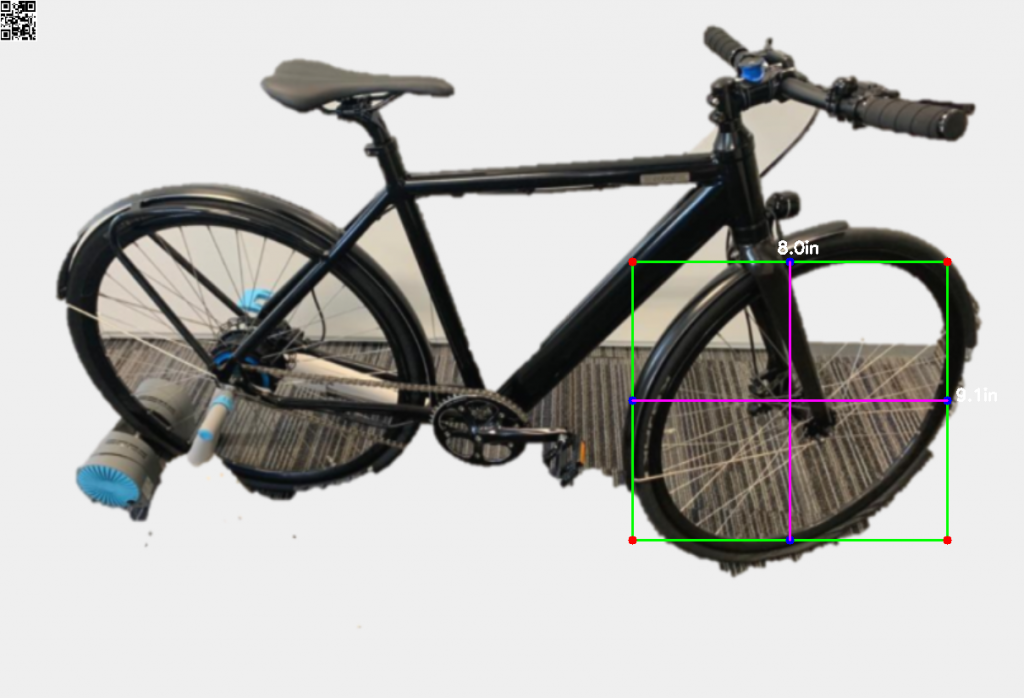
We run a python script which takes in the image name and the size of the left most object (a 1inch by inch qr code in the image) .The python script in this case uses edge detection , finds the contours in the edge map, and then loops over the contours found applying the calculated pixel density to physical size measurement to calculate the dimensions:
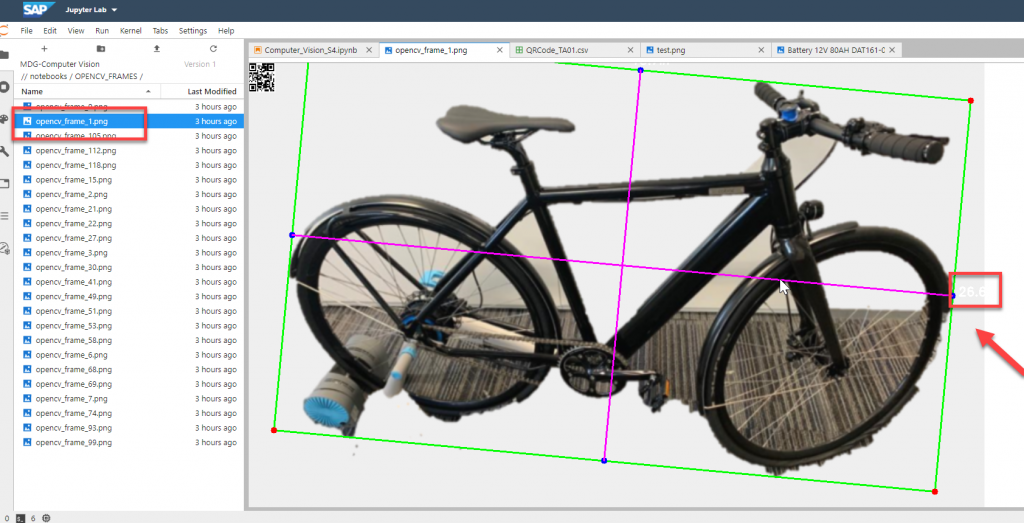
All contours found are saved as image files under a folder in notebook , The first contour has the frame of the bike , below example shows some other contours with calculated sizes but we wont use any of them, I hope we get an idea:
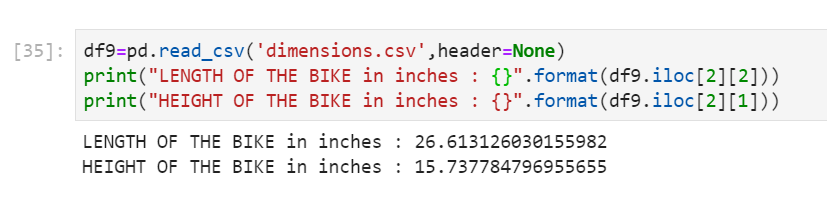
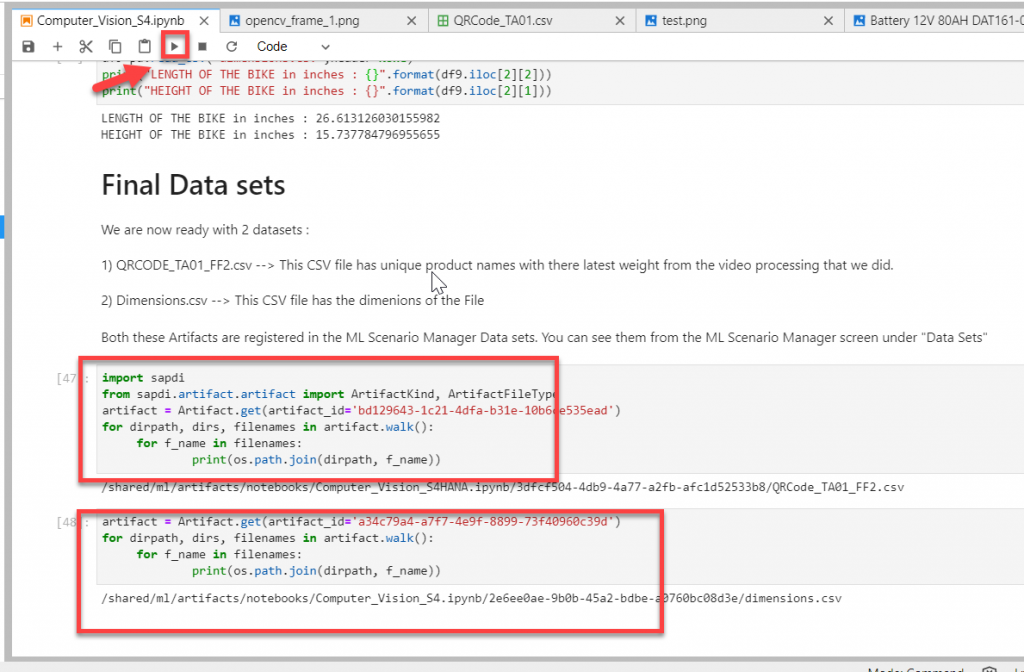
Final data set
Finally after performing some duplicate record handling (QR code CSV file), we can save the final datasets in DI Data lake and get the unique artifact ID’s which we can utilize to consume these data sets in a data pipeline :
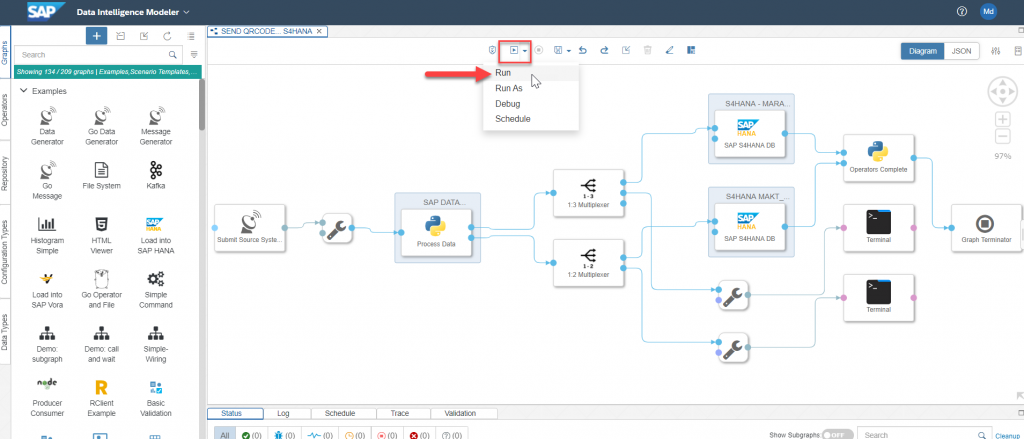
SAP DI Pipeline modeler
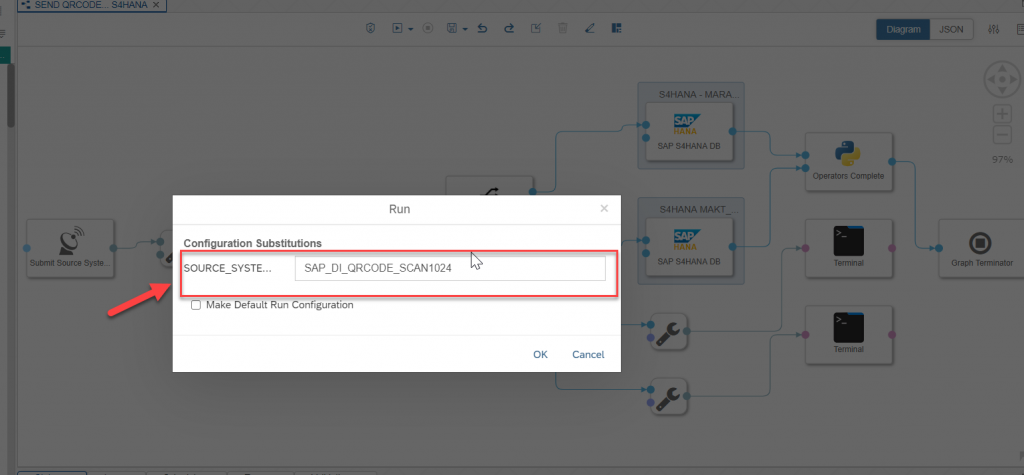
Let’s Trigger the data pipeline with S4HANA as target.
This step triggers a data pipeline to push the records to S4HANA ETL Tables MARA_SRC and MAKT_SRC. The logic and SQL’s are handled in the python operator to match the data types of the target tables:
We enter a Parameter value for SOURCE_SYSTEM name which will be registered in S4HANA < populates the SOURCE_SYSTEM column in MARA_SRC table, and has to be Unique>.
S4HANA MDG
Enrich Master Records with MDG
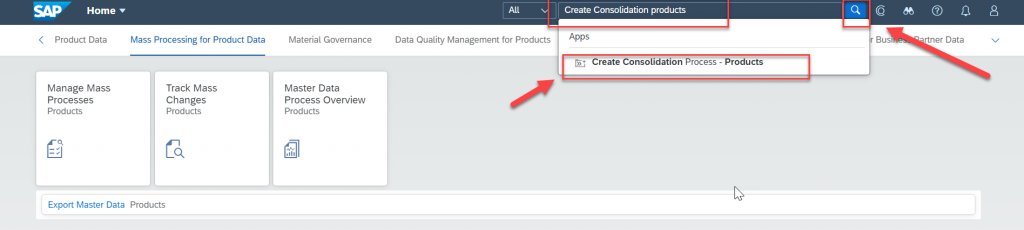
Let’s login to the S4HANA fiori launchpad!
We launch the “Create Consolidation Process products” using the App :
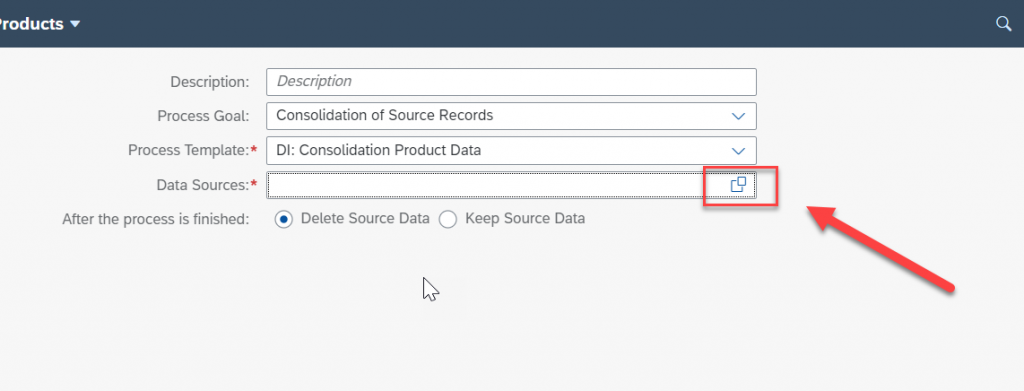
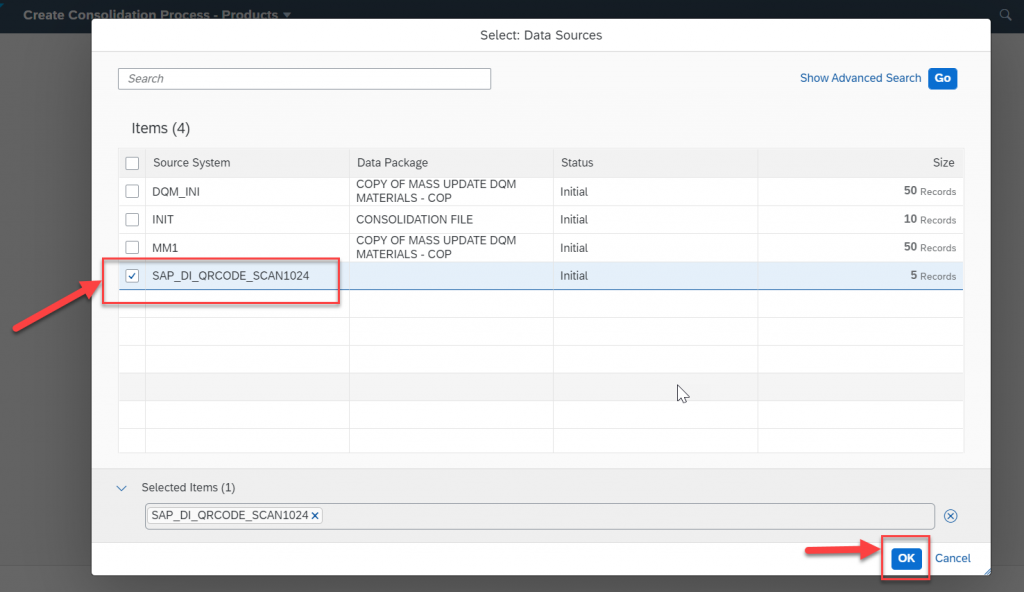
Now we select the DATA SOURCE :
Notice here that the SOURCE_SYSTEM that we specified in the SAP DI pipeline is available in S4:
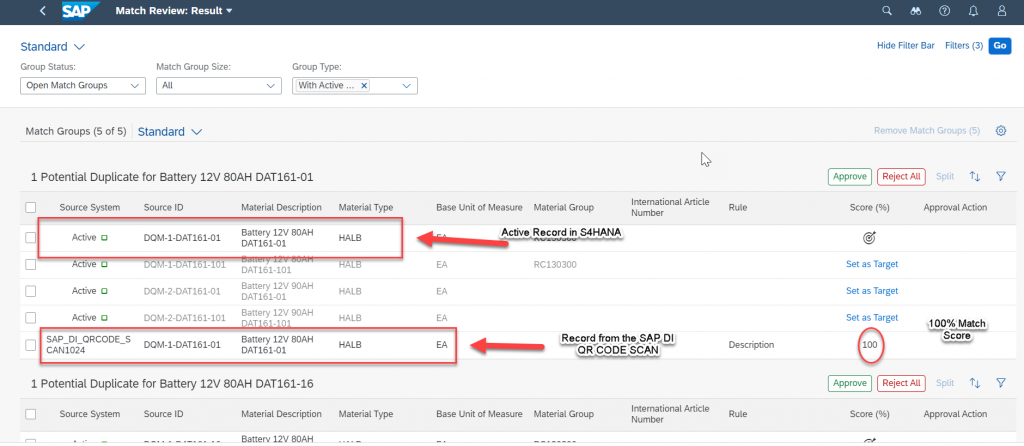
MDG consolidation module starts with the phase : Record Matching
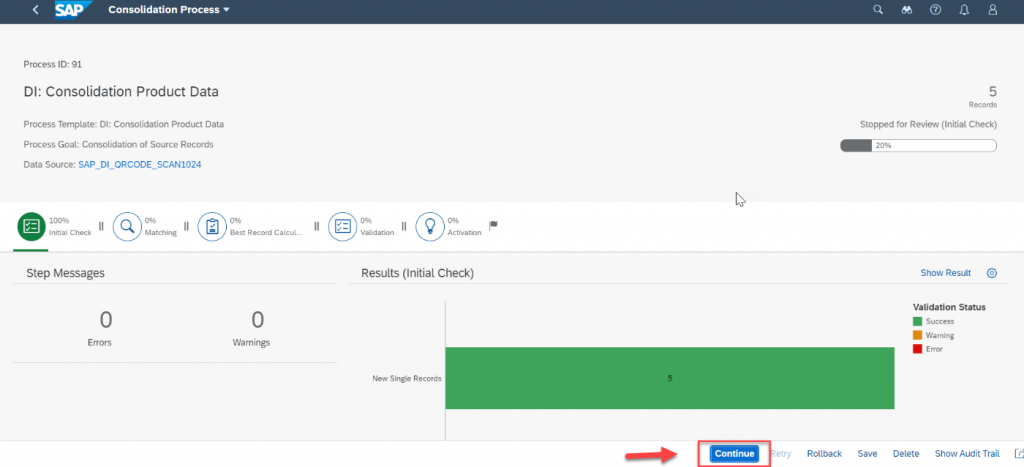
SOURCE_SYSTEM records are matched against Active S4HANA records :
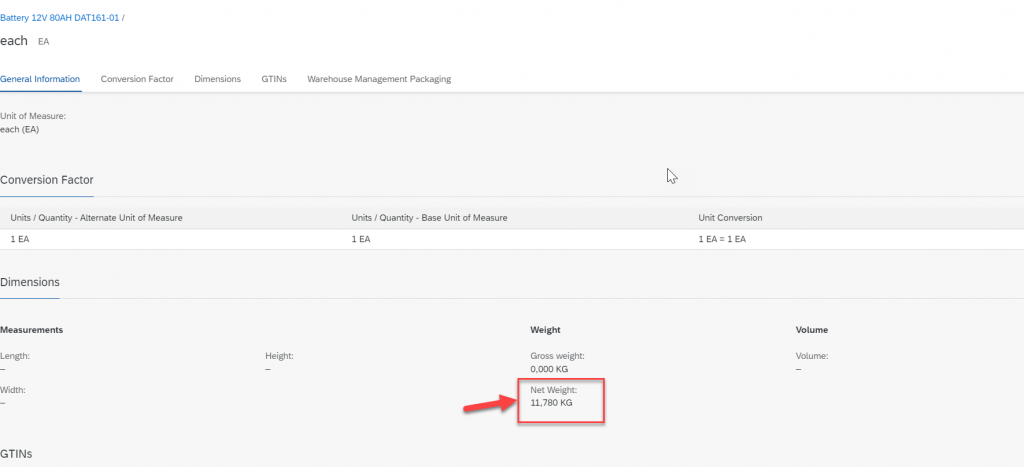
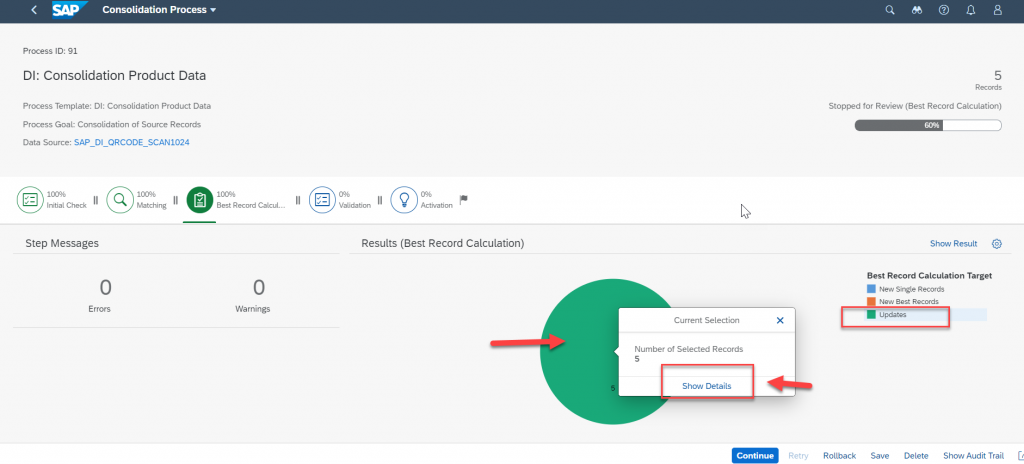
Best Record Calculation : A comparison is made to see what is the best record, the weight is coming in from the source system and S4 Active record does not have the weight.
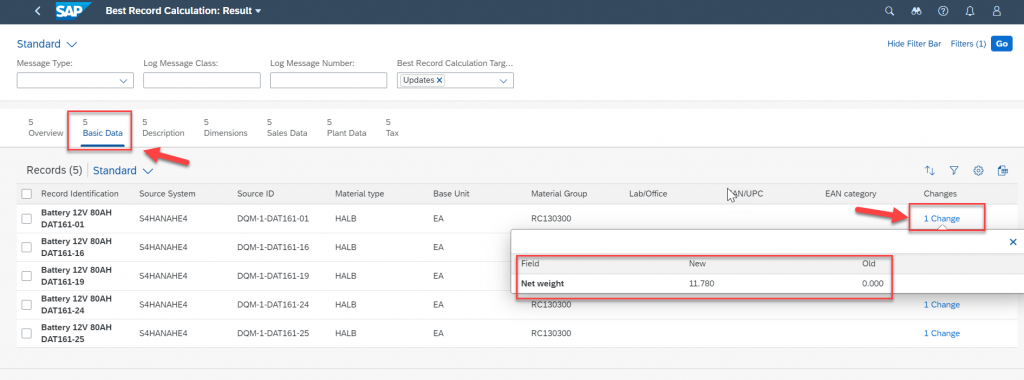
Here we can see under Basic data –> changes that the new weight is available:
We can continue and complete activation of records and below is an screen print of the updated record in S4 Master product data: