Old habits die hard. Developers took quite a long time to move from old ABAP debugger to the new debugger. Even though the new debugger has way more advanced features. Similarly, ABAPer still do their development using SAP GUI, even if they have the advanced ABAP Development Tools available in their infrastructure. Change is difficult. But, survival of the fittest is the mantra.
ADT (ABAP Development Tools) provides variety of tools to analyze an existing DDL Source to help understand CDS View definition in detail.
In this tutorial, we would like to make the developers comfortable with ADT and provide detailed information of the various tools which make developers life bit easy to analyze the CDS Views.
1) Navigation From SQL View To DDL Source
If you have found SQL View and want to know its DDL Source (CDS View entity), right click the SQL View in Project Explorer and choose Open with -> Definition
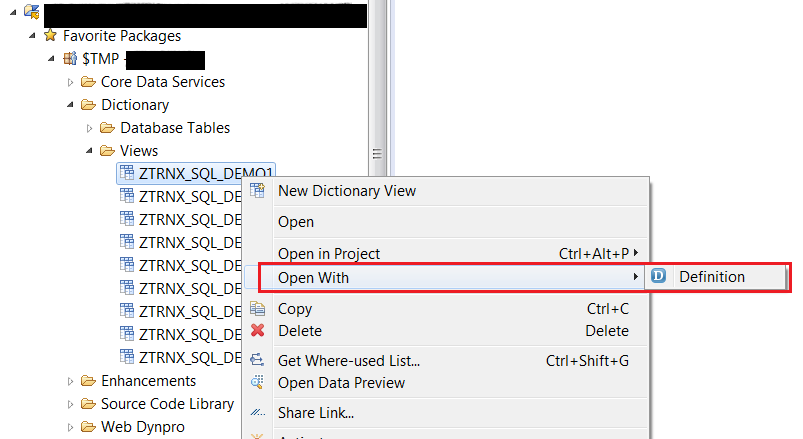
You will be navigated to the data definition of CDS view.
Alternately,
You can find DDL Source and CDS Entity from table DDLDEPENDENCY, since table DDLDEPENDENCY stores the objects of DDL Source.
Enter SQL View against field OBJECTNAME to get the DDL Source Name.
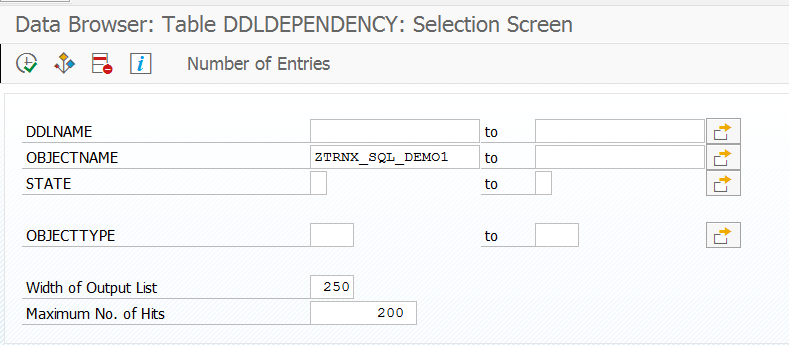
You will get the DDL Source Name in field ‘DDLNAME’ as below

Now again execute the table with only DDLNAME we got above, you will find two entries against the DDL Source– 1) CDS Entity name and 2) SQL View Name. So, this table holds the link between CDS View and SQL view for DDL Source.

2. Display Of SQL Create Statement
On activation of DDL Source, the development environment sends a SQL statement to the database to create the SQL View. We can display the SQL CREATE statement as follow:
- Open the DDL Source
- Right click anywhere in the DDL Source
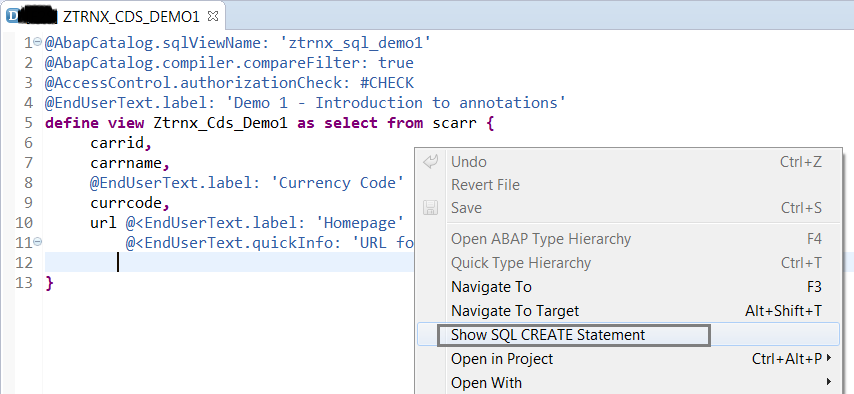
- Choose Show SQL CREATE Statement
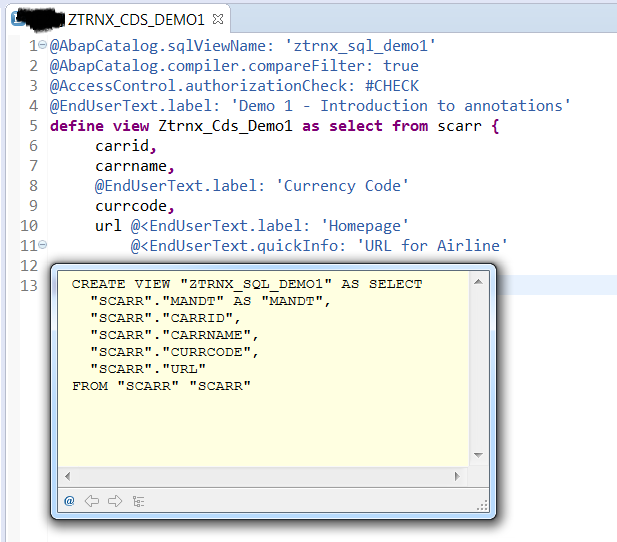
It will open a dialog window (popup) to display the SQL CREATE statement. The SQL CREATE statement is native SQL statement which depends on the type of database used by the system (in this case HANA).
3) Active Annotations View
Active annotations view summarizes the semantic information of the CDS View and of its view fields.
It not only takes annotation information but also lists semantic information that is taken/inherited from other CDS Views or DB table definitions and data elements.
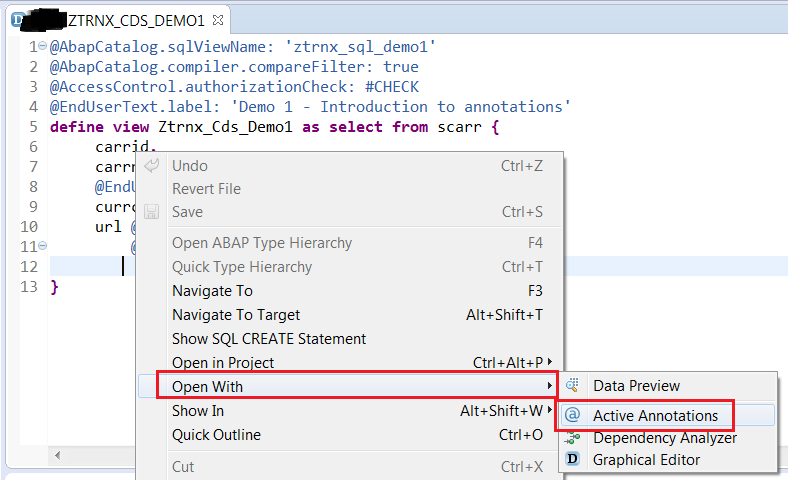
Open the active annotations view as follows –
- Right click on DDL Source. (Either in the editor window or in the Project Explorer)
- Choose Open with -> Active Annotations.
Active Annotations View will open in a dedicated tab in the tab strip below the editor window.
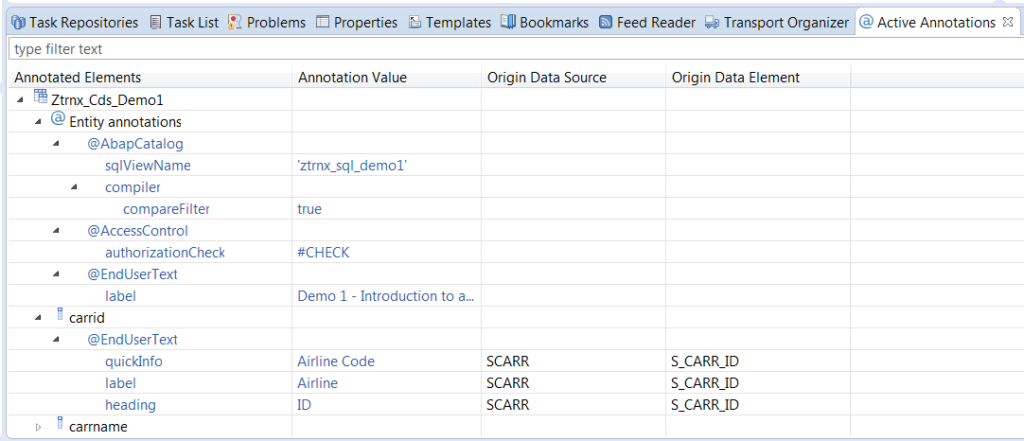
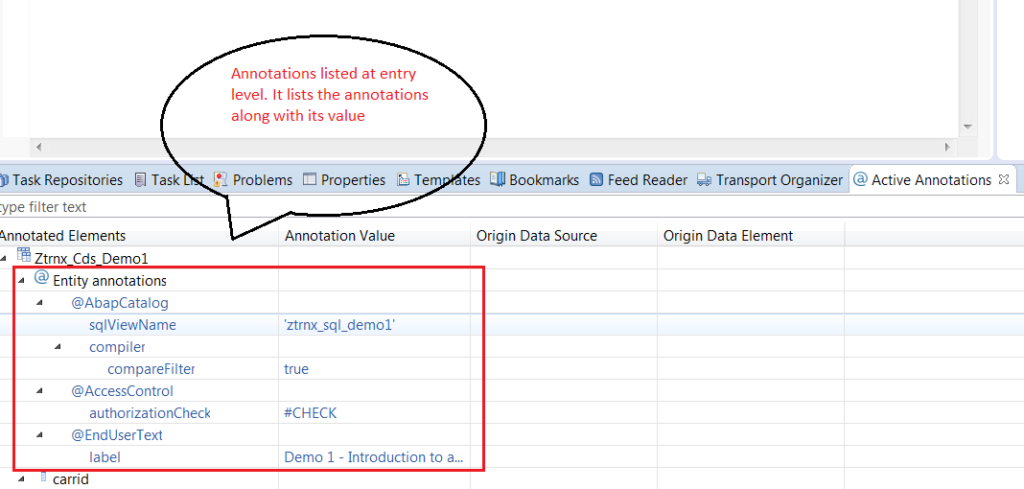
Active Annotations View summarizes the semantic information at both entity level as well as view field level.
Entity Level –
View fields level –

If annotation is provided against the view field it overwrites the original data source since priority is given to annotation ahead of original data source.
In the example above, we can see that fields CARRID has label ‘Airline’ that is not defined in the corresponding DDL Source. This label is inherited from source field in SCARR and originates from S_CARRID.
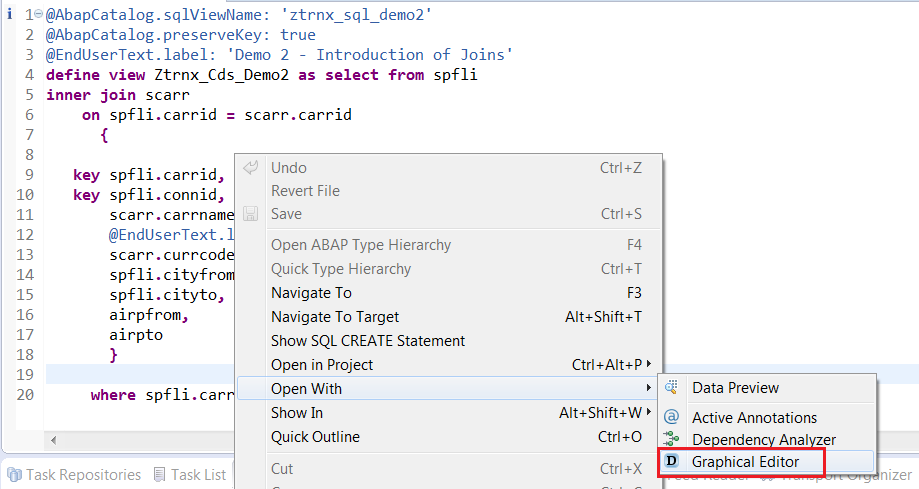
4. Graphical Editor
The graphical editor is another useful tool that supports you in analyzing complicated DDL sources. It not only shows how the given CDS View depends on other repository objects, it also provides graphical representation of the projection list and displays details about join conditions, aggregations, filters, annotations, etc.
Open the graphical editor as follows-
- Right click on DDL Source. (Either in the editor window or in the Project Explorer)
- Choose Open with -> Graphical Editor

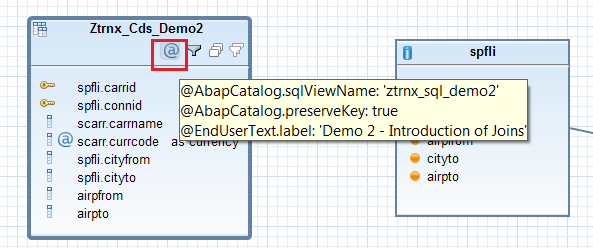
CDS entity annotations details as highlighted in above pic.
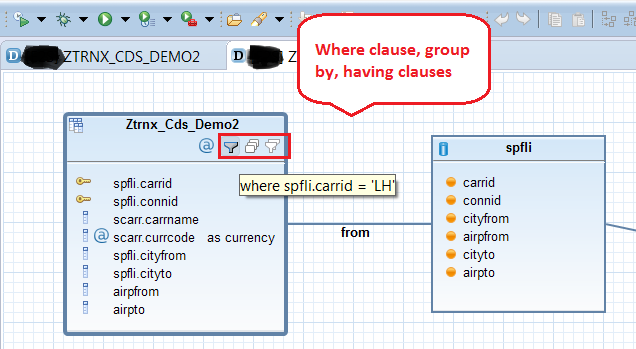
5. Dependency Analyzer
The dependency analyzer offers a simplified view by focusing on the dependency tree and discarding the rest. This becomes very useful in case of more sophisticated DDL sources where it is difficult to find the actual source of the data. There may be cases wherein the view reads data from another CDS view which is further dependent on other objects.
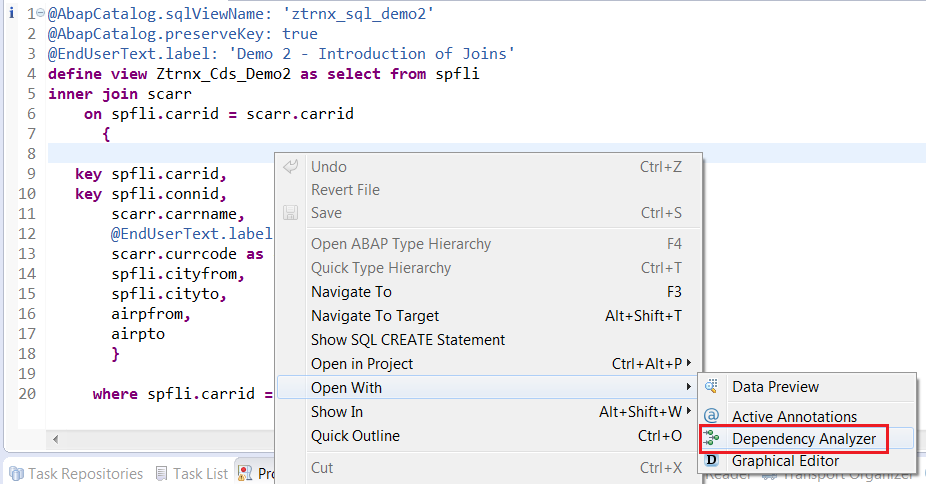
Open the dependency analyzer as follows-
- Right click on DDL Source. (Either in the editor window or in the Project Explorer)
- Choose Open with -> Dependency Analyzer

6. Data Preview
Data preview tool allows you to analyze the data returned by a CDS View without the need to implement a SELECT statement yourself.
There are several ways to open data preview for a given DDL source as follows –
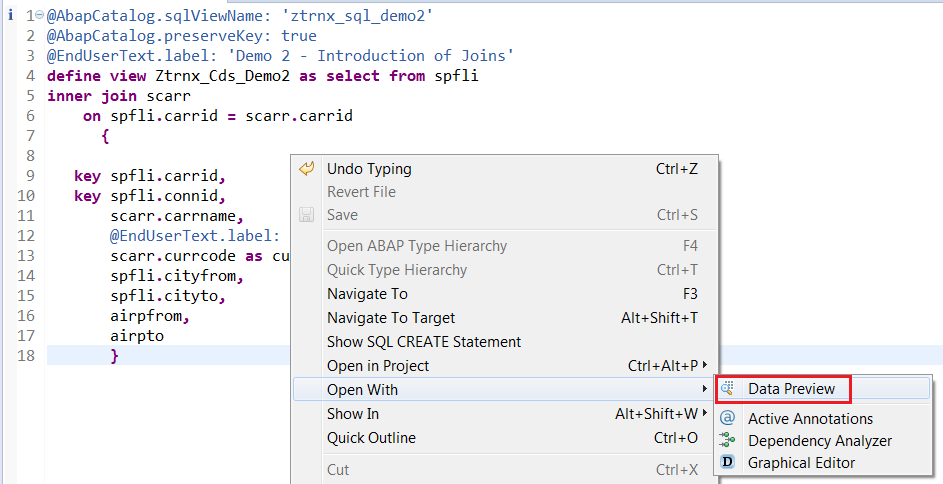
- Right click on DDL Source. (Either in the editor window or in the Project Explorer)
- Choose Open with -> Data Preview
Or
- Open DDL Source.
- Press F8.
By default, data preview lists 100 entries, but you can increase or decrease this value manually by setting Max. Rows
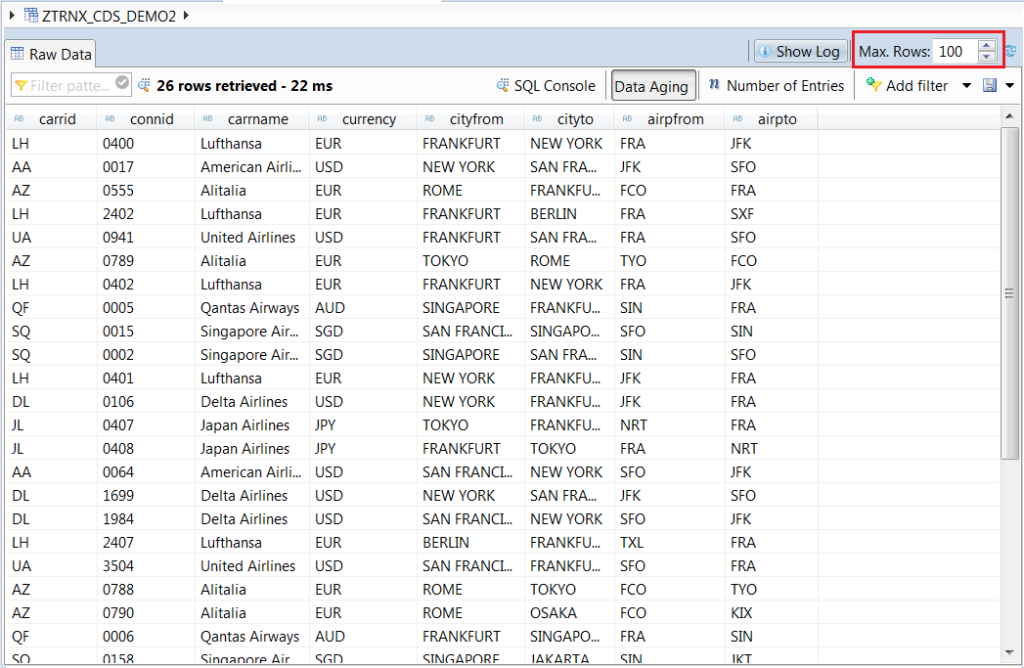
The toolbar of Raw Data tab offers additional functions –
- Add filter
User can enter selection criteria to filter the data.


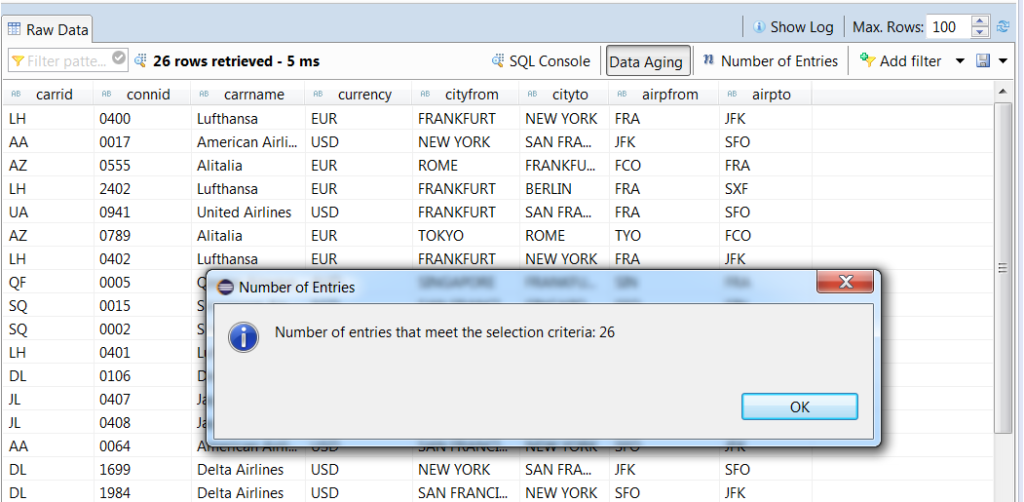
- Number of Entries
Displays total number of rows in the table/view that match the selection criteria
- SQL Console
Opens a new editor window with a SELECT statement for the view/table. You can edit the statement, execute it and display the result to run a more sophisticated ad-hoc analysis of the data.

I hope this tutorial would give confidence to the novice developers who are still reluctant to use ADT and work in CDS. Core Data Service has been invented to make the life of developers easy. Treat it just like the normal view with some super human power.


