Core Data Service (CDS) along with Annotations are some of the innovations which would stay and evolve with S/4HANA. OData Services and Netweaver Gateway is another pillar. Do you know how to Create Smart Business KPI & Consume CDS Views in the KPIs with the help of OData Service?
In short we will use Smart Business Service for Creating KPI & Tiles and Consume CDS View directly with the help of OData Service.
Part 1 – Create Smart Business KPI and Tiles
Use Case:
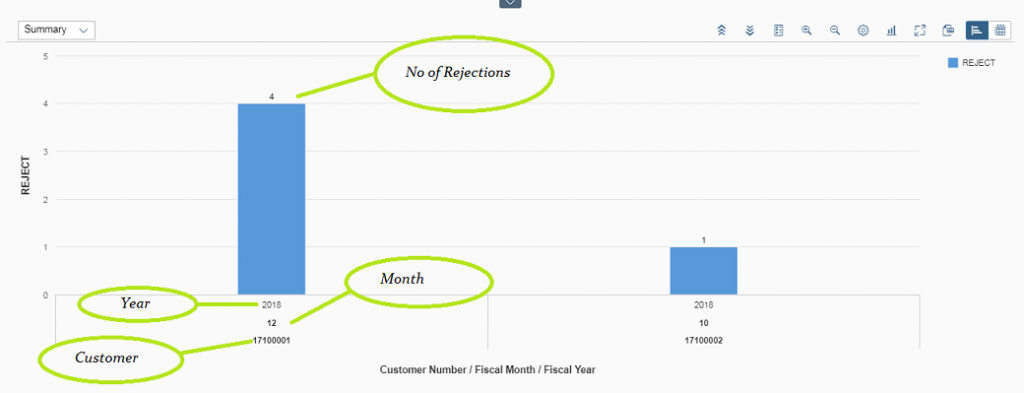
Create an Analytical App to analyze the number of Rejections in Sales Document Item Level for a Particular Year entered by the User which would be grouped based on Customers and Periods (months) as shown below.
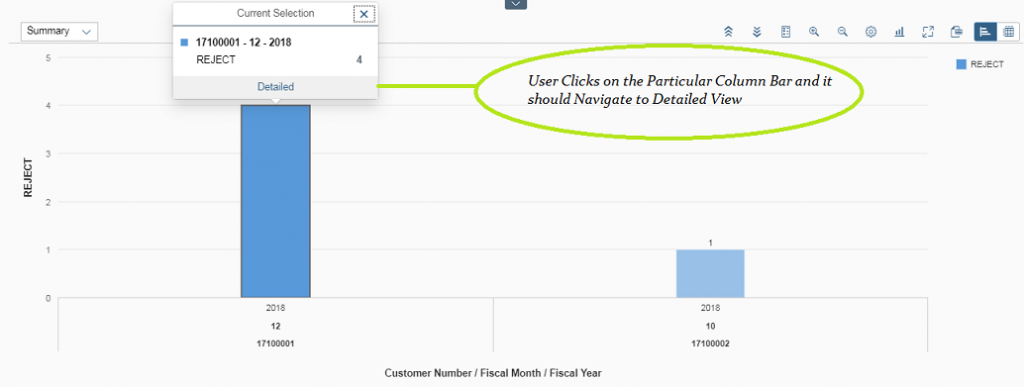
In addition, when the User clicks on a Particular Column it should Navigate to the Detail of all the Documents Line Item on the basis of that Customer as demonstrated below.
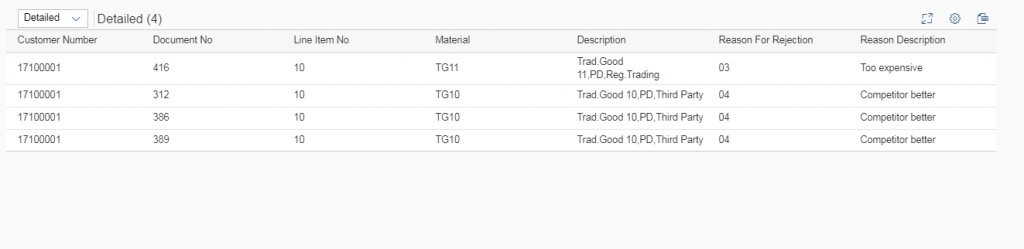
Detailed View Should be displayed in Tabular Format.
Let us refresh some of the theories which we covered in earlier tutorials.
For KPI we must have Measures and Dimensions in CDS View.
Measure: A Key Performance Indicator (KPI) is a measurable value that demonstrates how effectively a company is achieving key business objectives. In our example, the Number of Rejection is a Measure.
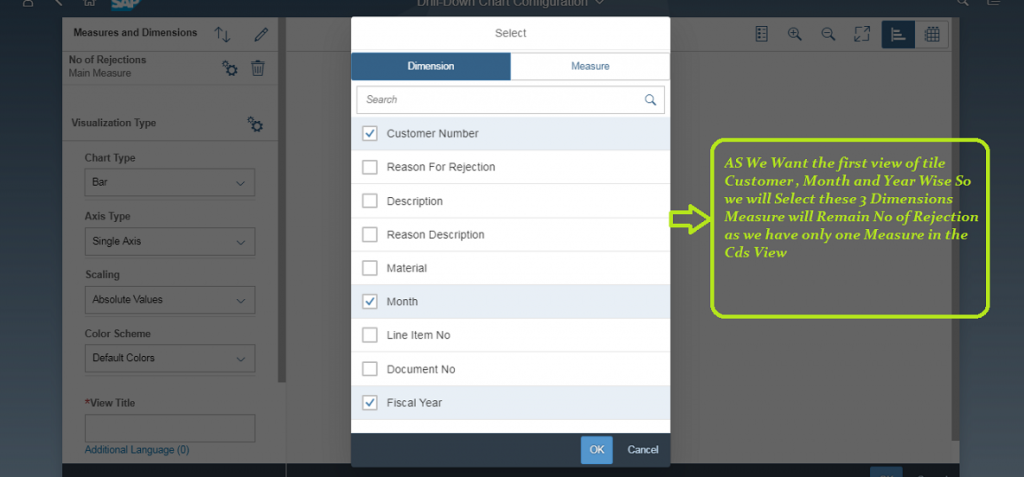
Dimensions: It is an Aspect on which we want to get the Measure Value. In our example, we want it on the basis of Customer, Year and Month Wise. These three parameters are our Dimensions.
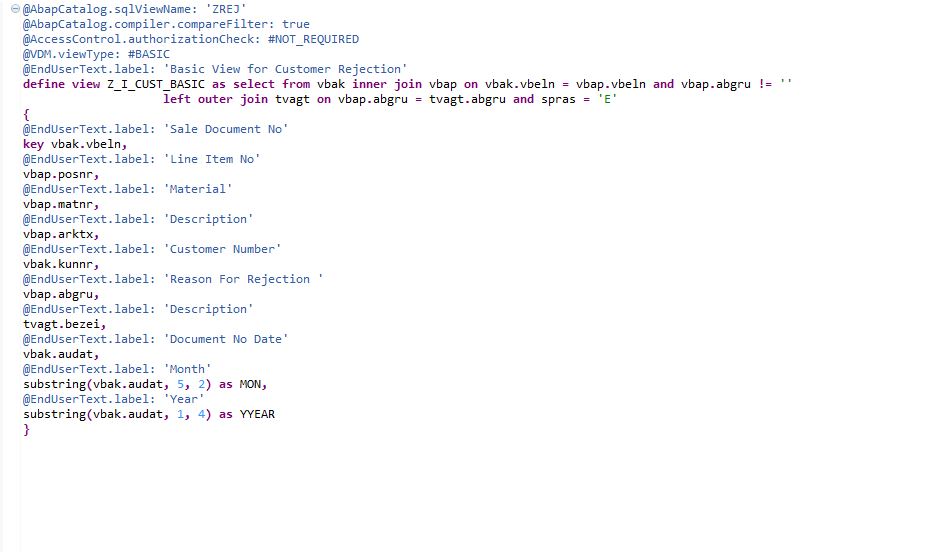
1. Create CDS View
Now we will Create CDS Basic View to fetch the required fields from VBAK as Header Sales Document table and VBAP as Sales Document Line Item table and TVAGT to Fetch the Description of Rejection Code.
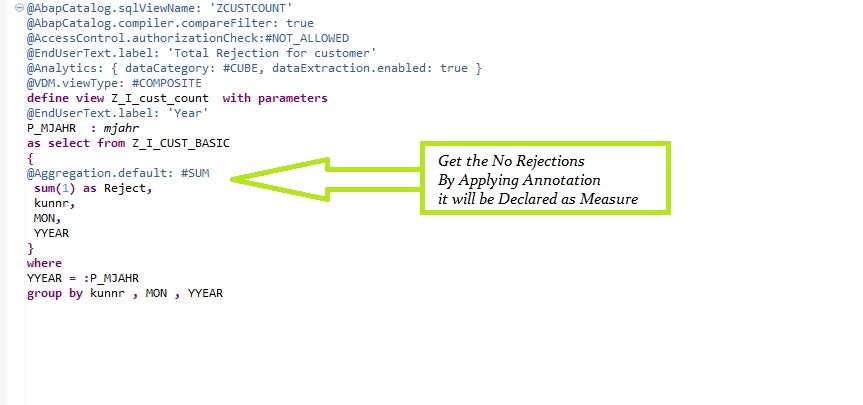
2. Get Number of Rejection Count on the basis of Customer, Month and Year
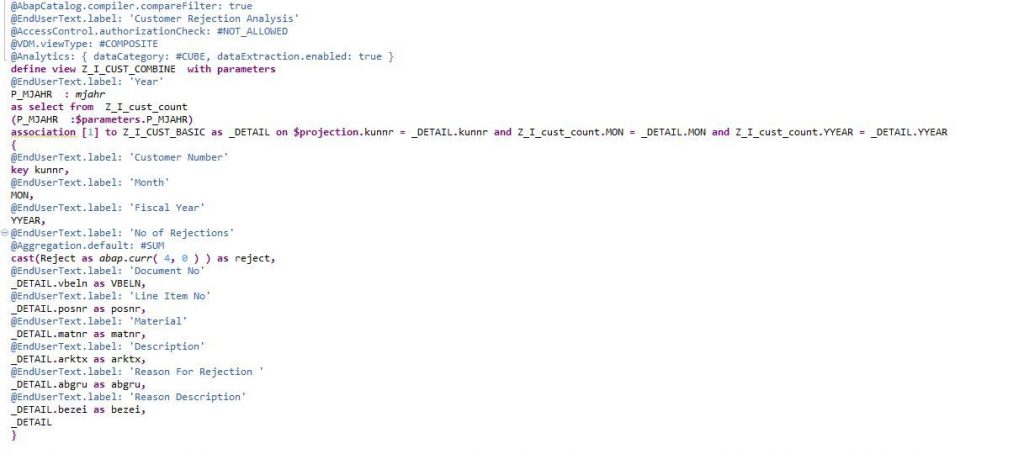
3. Combine both the CDS View to Create Analytics Cube and Composite Virtual Data Model (VDM) View
Please check the below updated code snippet for reference.
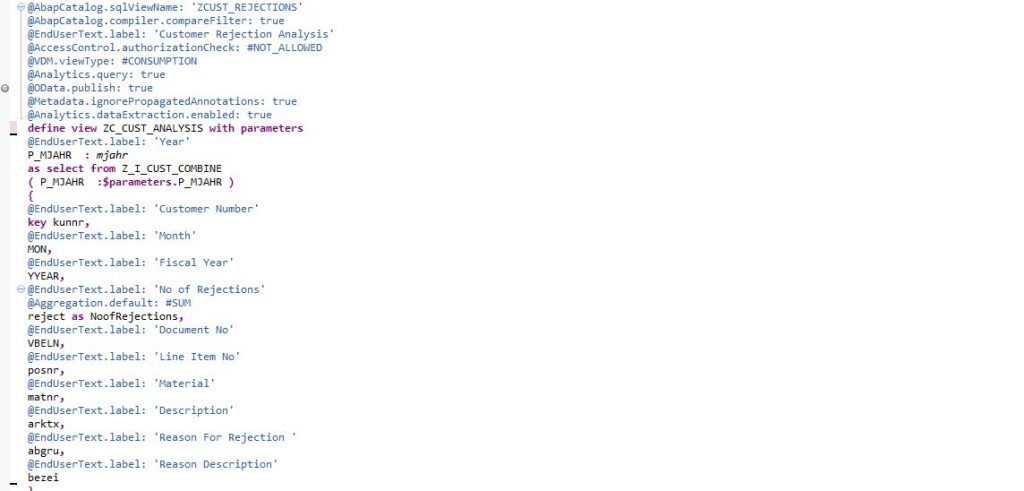
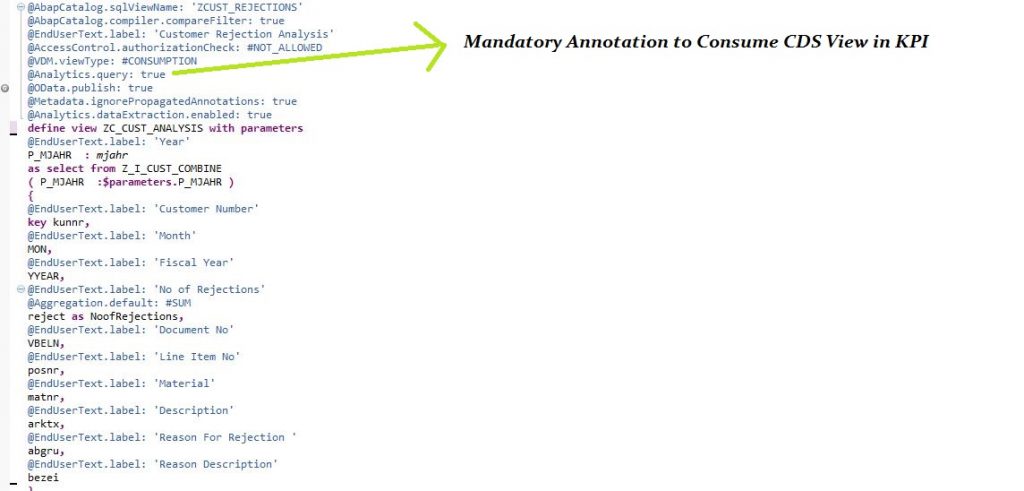
4. Consume the View with @ODATA.PUBLISH : true and Analytics.Query : true
Part 2 - Create KPI and Consume CDS View Directly in KPI
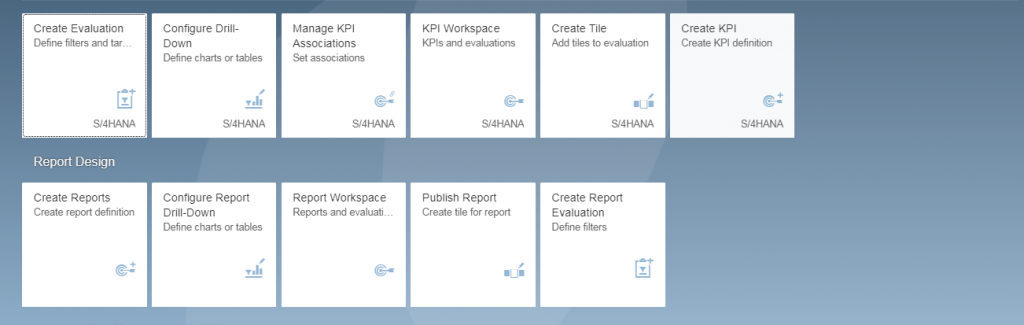
- Go to Fiori Launchpad.
- KPI Design.
- Click on Create KPI.
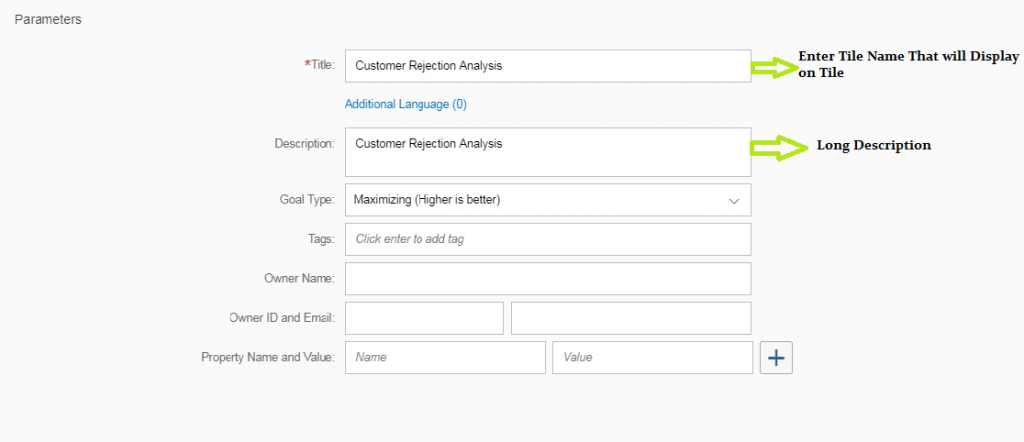
4. Enter the Tile Name and Long Description.
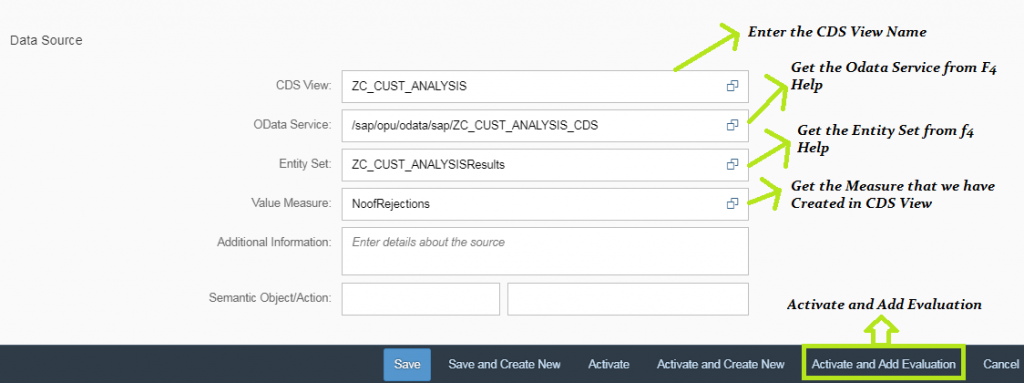
5. Enter the CDS View Name.
6. Get the Service Name from F4 Help.
7. Enter the Entity Set from F4 Help.
8. Get the Measure Value that we have Created in CDS View.
9. Activate KPI and Add Evaluation.
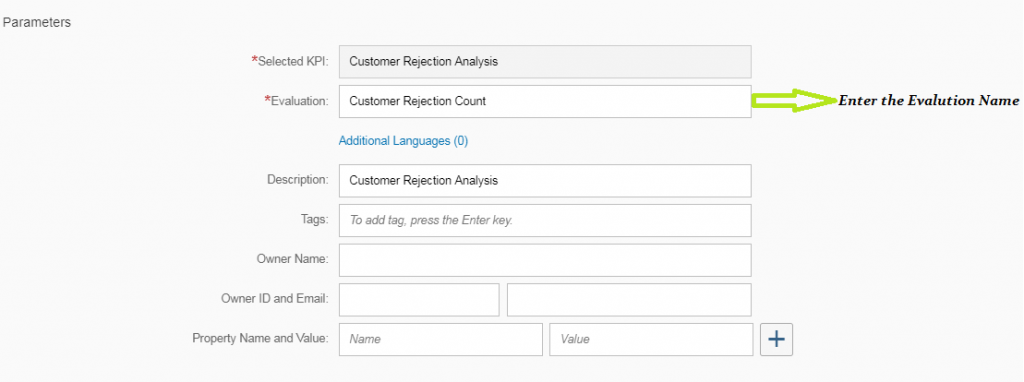
10. Enter The Evaluation Name.
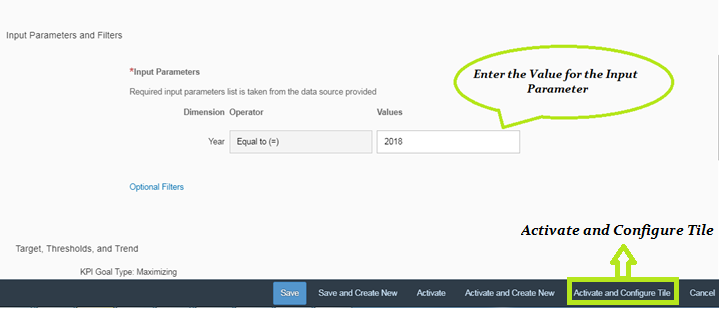
11. Provide the Fixed Input Value for Parameter.
12. Activate and Configure Tile.
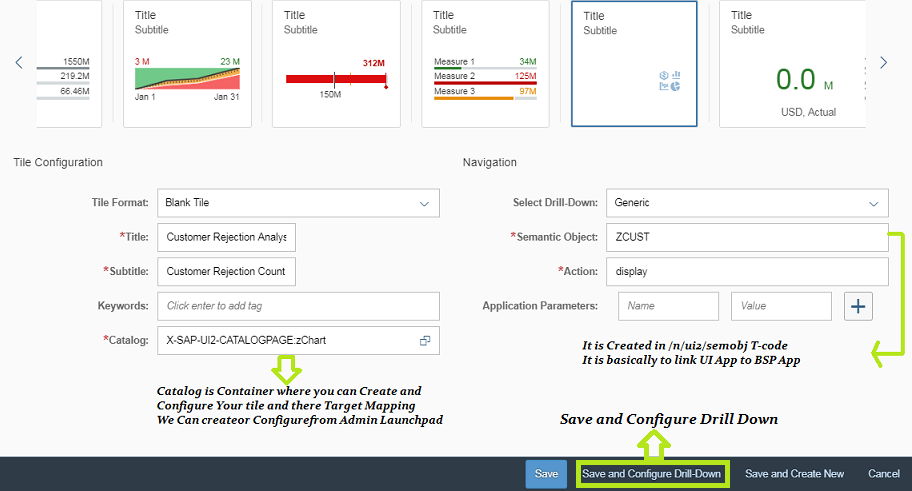
13. Select Tile Format as per your Requirement.
14. Enter the Semantic Object.
15. Enter the Catalog.
16. Enter Action( It can be anything ) Like we have taken Display.
17. Save and Configure Drill-Down.
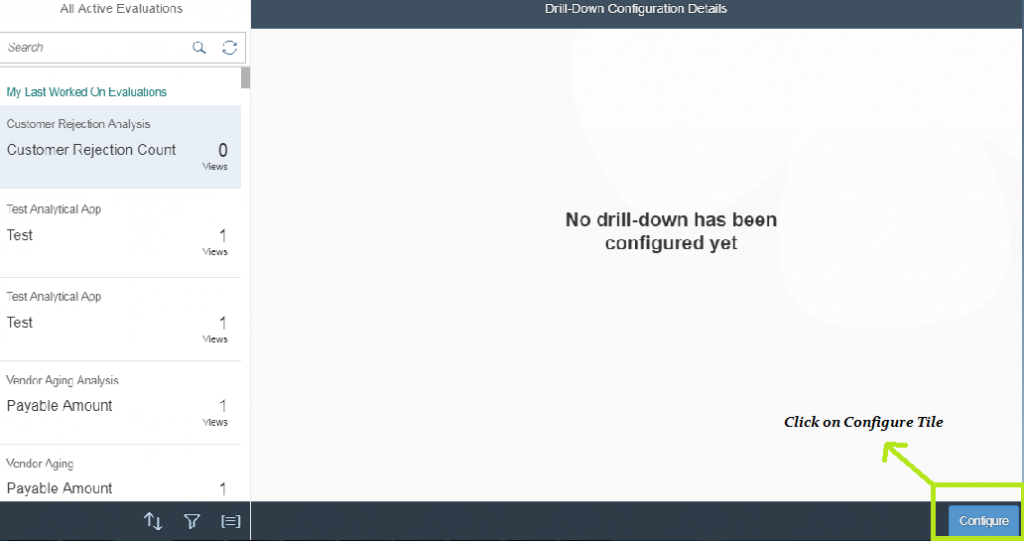
18. Click on Configure.
19. Select the Dimensions on which you want to display Analytics Data.
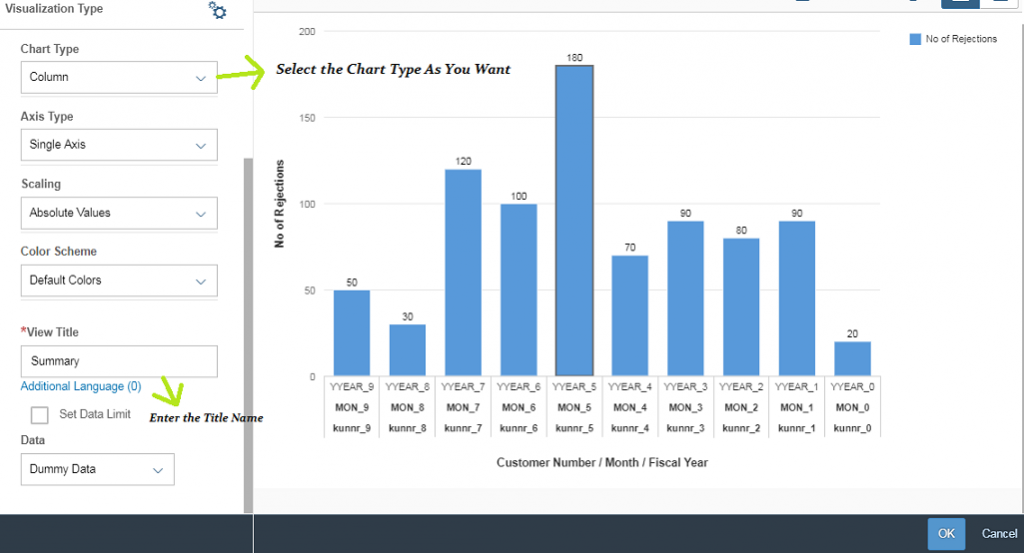
20. Select the Chart Type.
21. Give the View Title Name.
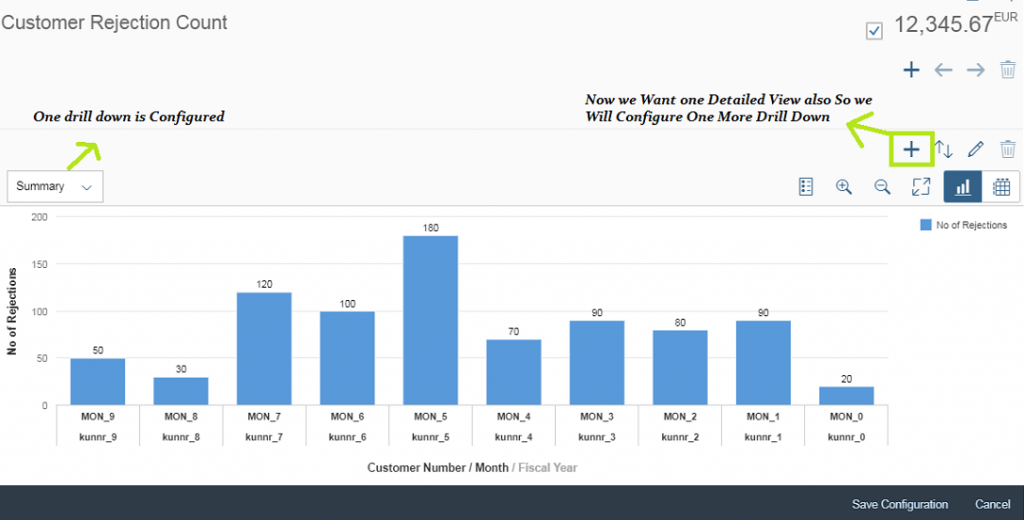
21. Add one More Drill-Down for Detailed View.
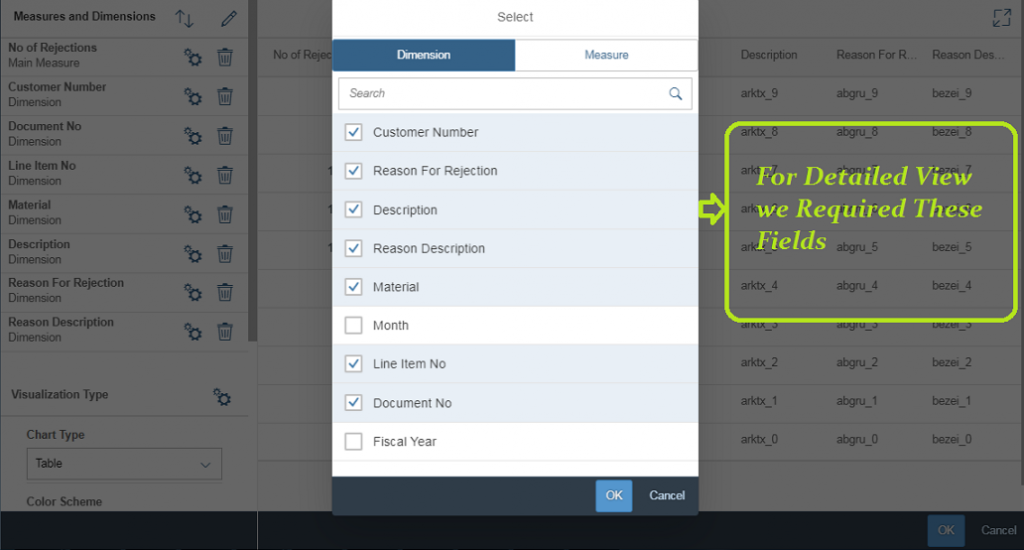
22. Select the Dimensions for the Detailed View.
23. If we Don’t want Measure to be in Detailed View Mark The Check Box Hide in table.
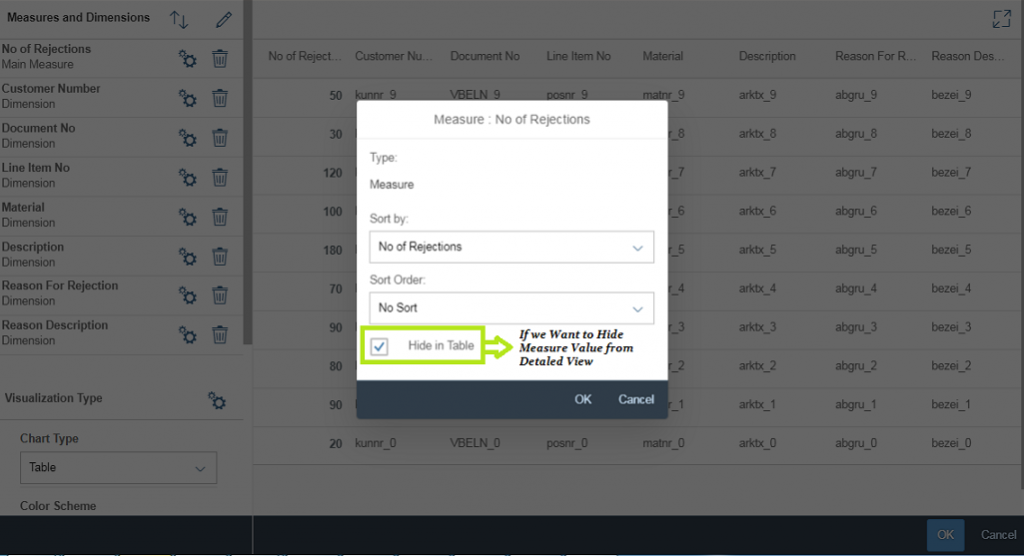
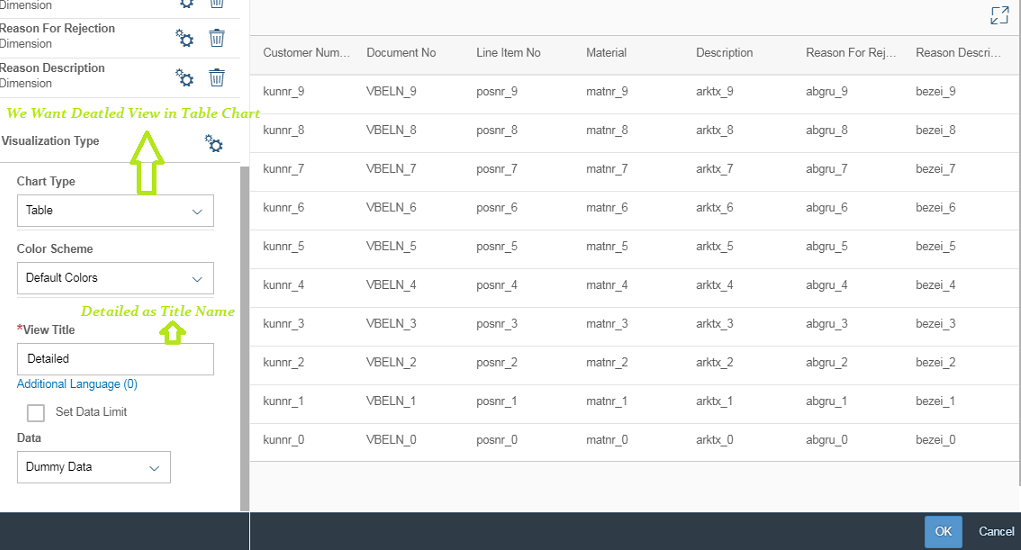
24. Select the Chart Type as Table.
25. Give the Title Name.
26. Click on OK and Save the Configuration
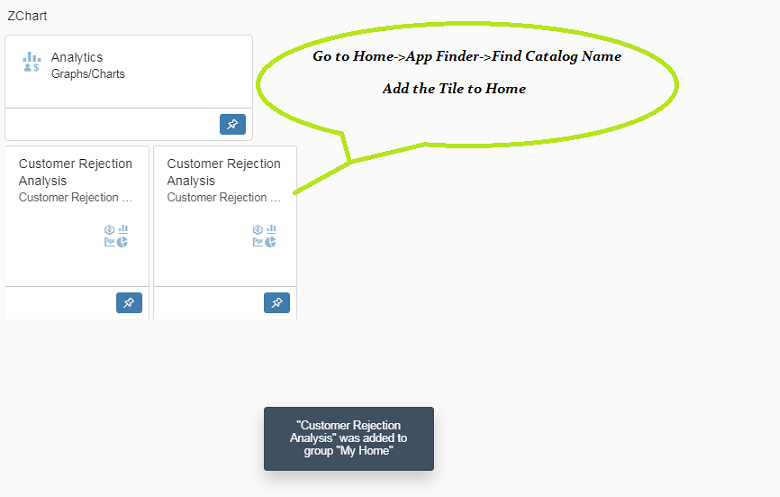
27. Go to Home->App Finder->Find Catalog Name in which you have added that KPI.
28. Pin it to Home.
29. Customer Rejection Analysis KPI.
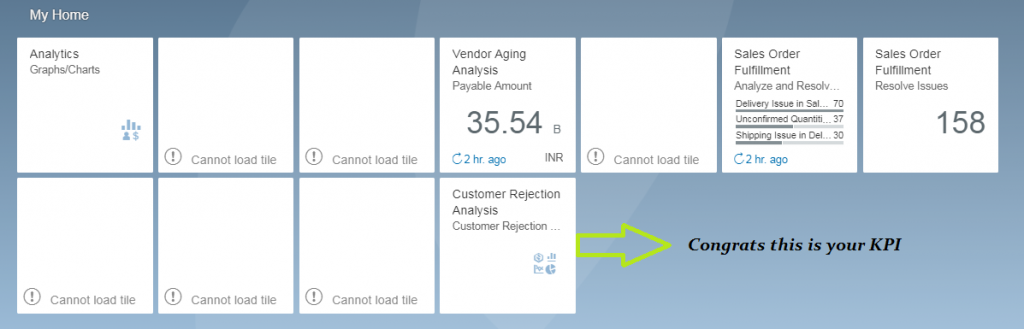
Congratulations!! If you followed all the steps shown above, you should have your first KPI configured and ready for use


