Introduction
This blog covers building an application in SAP Analytics Cloud using APIs in order to perform data analysis on a specific data source.
Overview
Analytics designer is the functionality in SAP Analytics Cloud that allows to create analytic applications. A dedicated design environment in SAP Analytics Cloud to create such applications. We can design complex applications with input controls of different kinds: input, dropdown, checkbox along with that some powerful scripting capabilities using JS.
This allows to build application that would cover scenarios such as below, to name a few.
- Build Application with the ability to save the navigation state. Also provide user with options to format the output prior to saving.
- Custom Scenarios that integrate Planning, BI and smart features into one.
- Close Loop Scenarios that allow for calling Rest (OData) services in backend system.
- Integrate SAC stories.
- Integrate with Web.
Detail
As part of this document, I will be covering the first scenario which involves creating a Generic Application for group of users with the ability to set Navigation state, save bookmark, open bookmark, delete bookmark and use display options to format output.
There are ways to achieve similar outputs by creating Generic Analysis using the configurable Ready-to-Run Application Designer for flexible ad hoc Analysis, delivered via the content network. However, a generic application using API (Application Programming Interface) via Application Designer can be built per model (as illustrated in this document below). This provides additional flexibility to design and extend existing application and provides features via API that have not been made available via Generic Analysis. Alternatively, Generic Analysis delivered by content network can be extended to include additional features using powerful Application Programming Interfaces (APIs) that accesses predefined services.
These applications are a blank canvas where users can create a view that they can save and reuse without having to go through the steps every time. By using these Users could choose Rows, Columns, Apply Filters, use Hierarchy options, choose Display options, Arrange Totals/Parents node (Below/Above) and Swap Axis all via the Navigation Button.
Navigational Panel
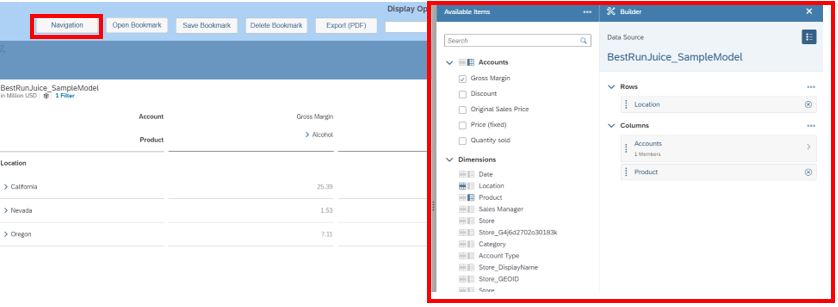
Figure 1: Navigation Pane
Invoke Method: OpenNavigationPannel() on Table component to provide the required functionality as discussed above. Ideally the user would enable pausing of data refresh, prior to selecting this option, to minimize time to select and go through the entire navigation steps. This functionality can be achieved using method setRefreshPaused().
Display Options
Once all the basic elements required to create are selected, data analysis will be created alongside Display Options to format the output. List of Display options that are useful and can be programmed via APIs/, as listed below. Please note that the list is not exhaustive and does not include each option that is available via API. More of these options can be agreed with client while finalizing the template.
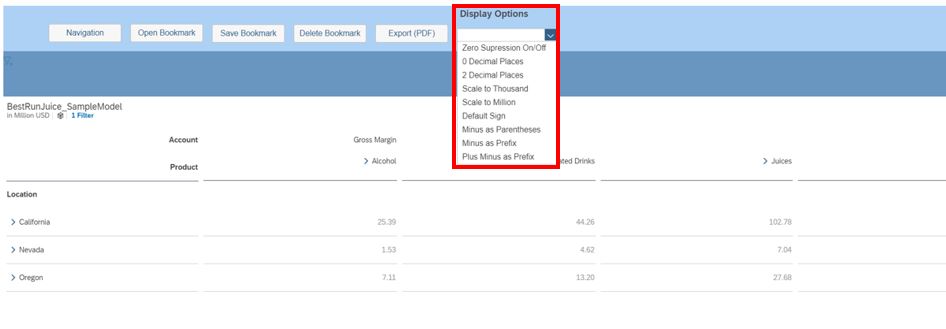
Figure 2: List of display options
Below is the list of methods on Table component that can be triggered on selection of dropdown entry (as an example).

Figure 3: List of methods specific to display options.
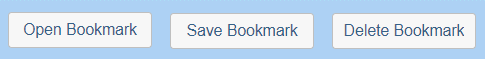
Bookmark
After the relevant Display Options have been selected, the navigation state can be saved in the form of Bookmark. This would save the state of Input Controls, prompts, charts, tables and filters with the ability to revert back to them when needed. Application can be programmed to allow user to switch between multiple scenarios. As part of application build, the same is achieved by selecting relevant button to Open, Save & Delete Button which further provides popups to Save, Open and Delete from relevant list of Bookmark(s).
- Save Bookmark
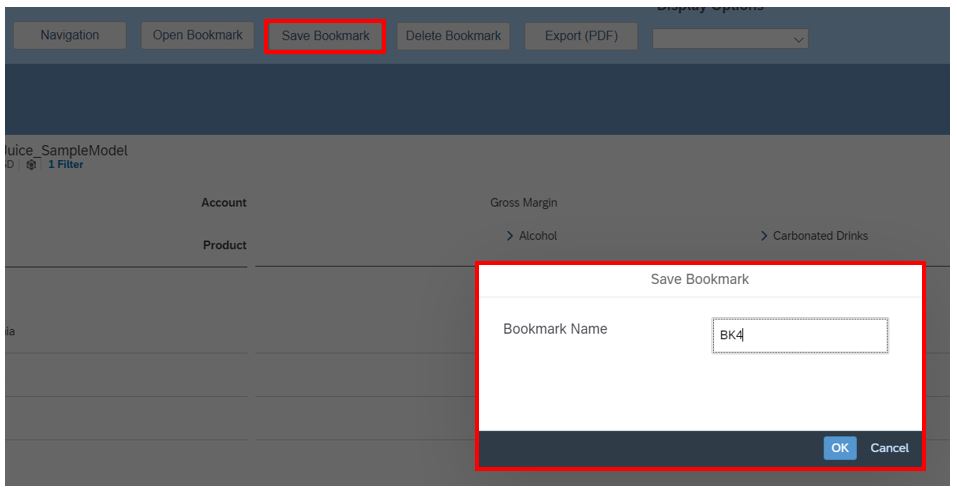
Figure 4: Save Bookmark – Bookmark name
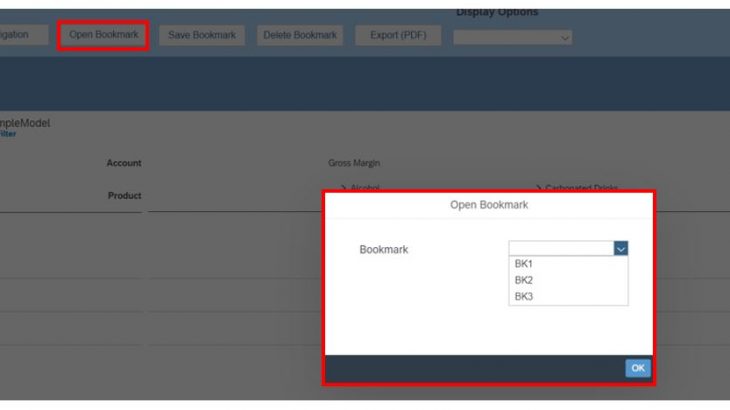
- Open Bookmark
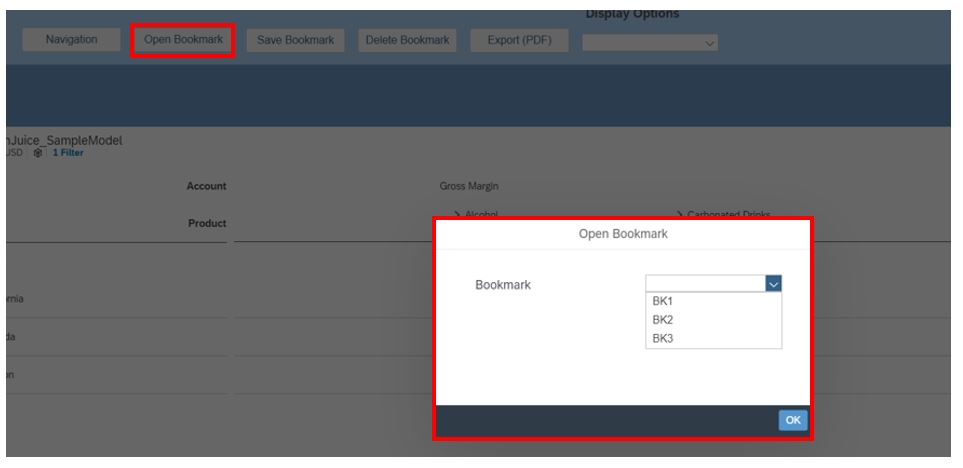
Figure 5: Select Bookmark to Open
- Delete Bookmark
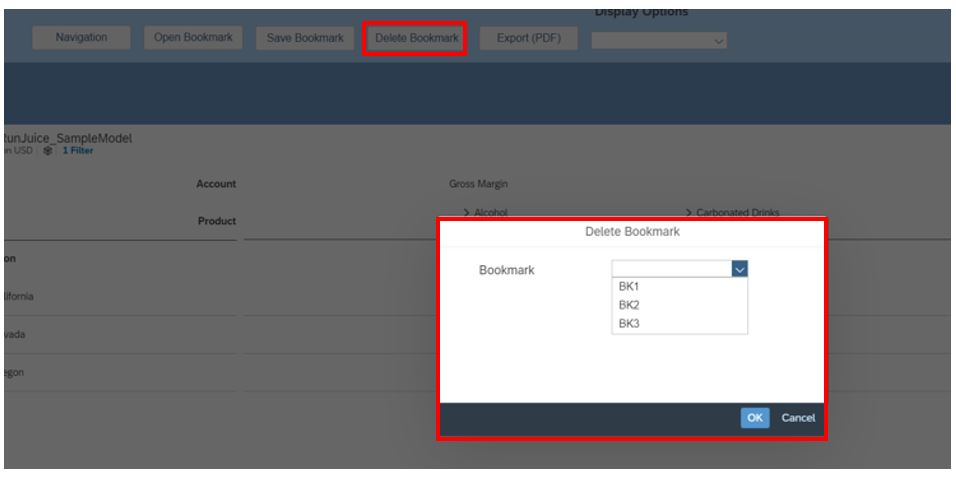
Figure 6: Select Bookmark to delete
Below is the list of APIs/methods that can be triggered after selection of dropdown entry and on click of a button (as an example).
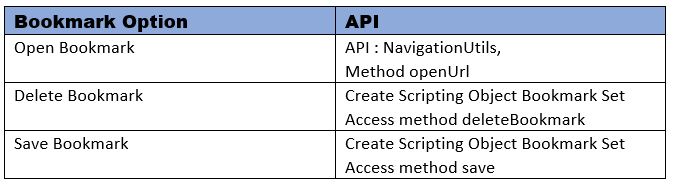
Figure 7: Methods related to Bookmark.
Export (PDF)
Likewise, PDF can be generated for the element selected on a page (during design time) and exported to a file on the local drive. As part of the application design, the elements on output that needs to be exported to PDF can be selected while creating Scripting object ‘Export to PDF’. There are various settings while using the export settings such as PageSize (A2, A3, A4…), Filename, Page Orientation (Landscape, Portrait) to name a few. These settings can be presented on a popup for user to select (shown) below.
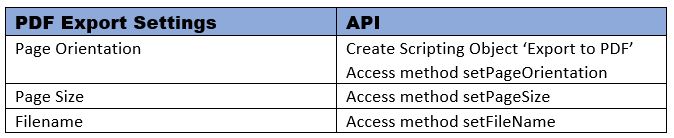
Figure 8: Methods related to PDF Export Settings
Finally, the export could be triggered by executing method exportview() to allow creation of PDF.
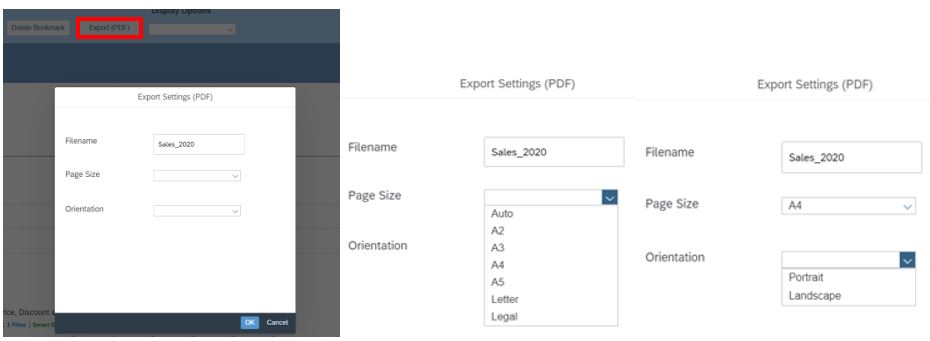
Figure 9: Selection of Export Settings for PDF
Schedule Publication
With this standard functionality from 2020 Q2 SRC, user would be able to Schedule an analytical application with recurrence and distribute the same as a PDF over email to several different SAC and Non-SAC recipients. User can even include a customized message in the email per the schedule and also attach a link to the view online mode which can be used to check the latest online copy of the analytical applications.
Figure 10: Schedule Publication – Standard Functionality in SAC
There are various blogs available on Scheduling Publication via analytics application in SAP Analytical Cloud. You should be able to create single schedule or even a recurring one with a defined frequency like hourly, daily or on weekly basis.


