In this blog post we will see how you can compare the performance of time-series models in stories using custom performance measures.
Scenario
Let us assume you want to forecast the future visits in the US National Parks. You are mostly interested having the best forecasts of the total visits across all the parks. But there are several different predictive models you could create in Smart Predict that would help achieving this goal:
- using a top-down approach, you could create a single model predicting the aggregated total visits.
- using a bottom-up approach you could create a predictive model predicting visits in each park individually.
The best way to know which of these two models is likely to provide the best predictions is to compare the forecasting error the two models have made. Let’s assume that you want to compare your two predictive models using the Meam Absolute Error (MAE) metric. This performance indicator is not provided by the default Predictive Planning reports, so you would need to use a story to calculate and display it.
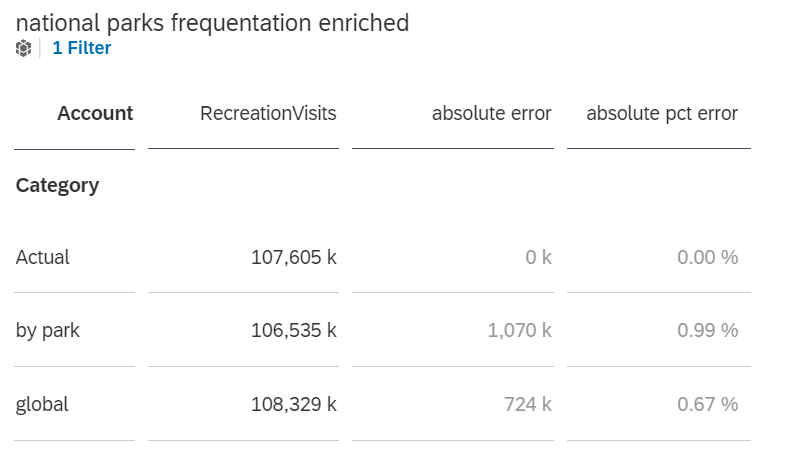
In this blog post we will show you how to calculate the MAE and display in a predictive model comparison table like the one below.
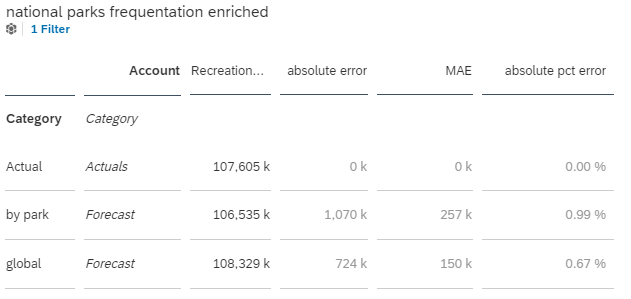
Predictive Model Performance Comparison Table
Obviously, you can easily generalize this explanation to any other standard or ad hoc performance comparison metric.
Prepare the Planning Model
Start by creating a Story referencing you planning model.
Open the and create one “blank” version for each predictive model you want to compare. For our scenario, we need two versions, one for the top-down forecasting model (“global”) and one for the bottom-up model segmented by park.
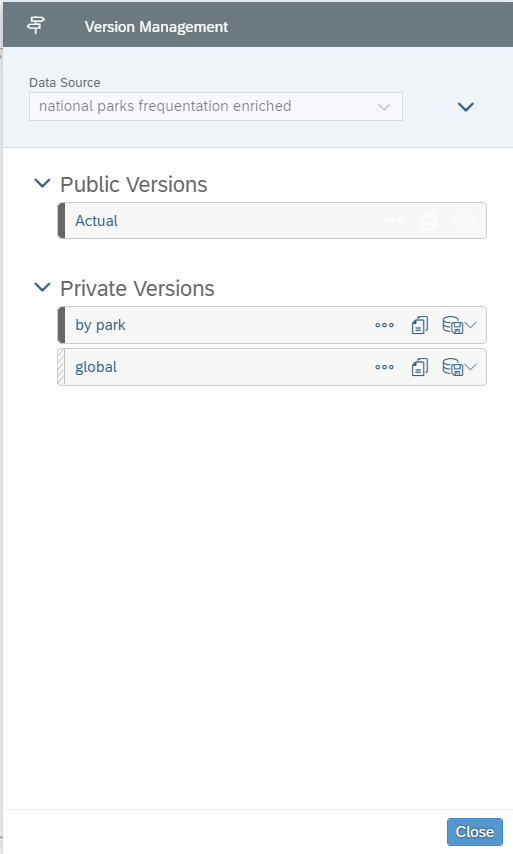
Planning Versions
Your planning model is now ready to receive some predictive forecasts.
Create the Time-Series Forecasting Models
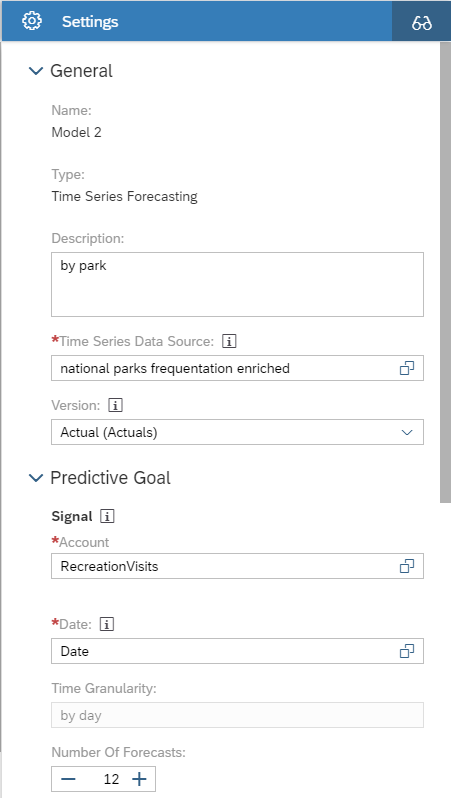
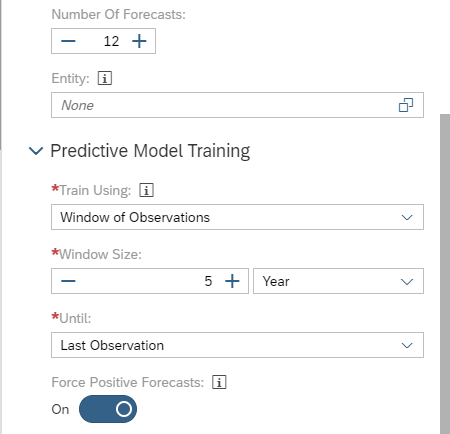
Create a Time-Series predictive scenario. In this Predictive Scenario create two models using the settings presented below and train them.
Only the “Entity” parameter is different for the two models.
Global model (Entity: None):


One model per park (Entity: ParkName):
Write the Predictions
When you write the predictions to the planning model using the “Save Predictive Forecast” option, by default, Smart Predict writes only the forecasts for the future period (red frame below) to the output version. This is all you need when your goal is only to get future predictions.
To calculate a MAE (or any model performance indicator) to evaluate the potential future performance of a predictive model, we need to be able to compare the forecasts to real values (“actuals”). The actuals are obviously known only for the past period. That means that we need forecasts “in the past” (the training data partition) where the actuals are known.
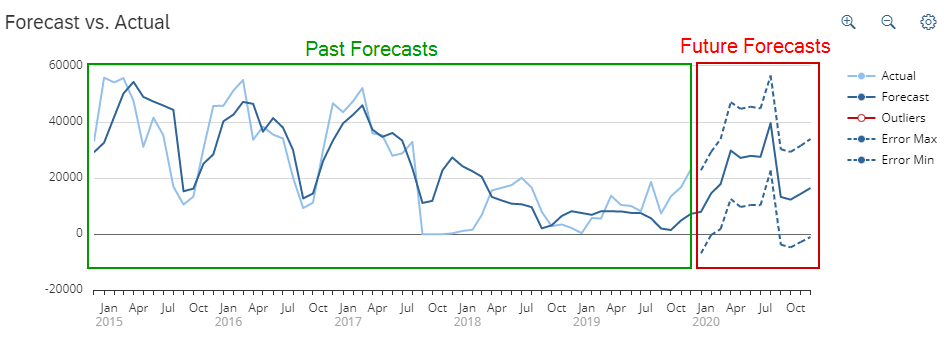
Past Forecasts Vs Future Forecasts
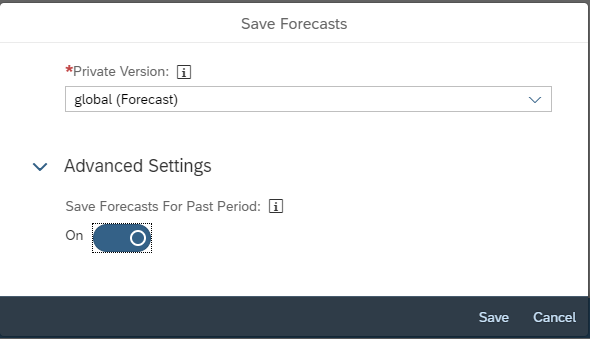
Writing these past forecasts is the purpose of the new “Save Forecasts For Past Period” option.
The two tables below, compare the output you get when the option is not enabled and when it’s enabled.
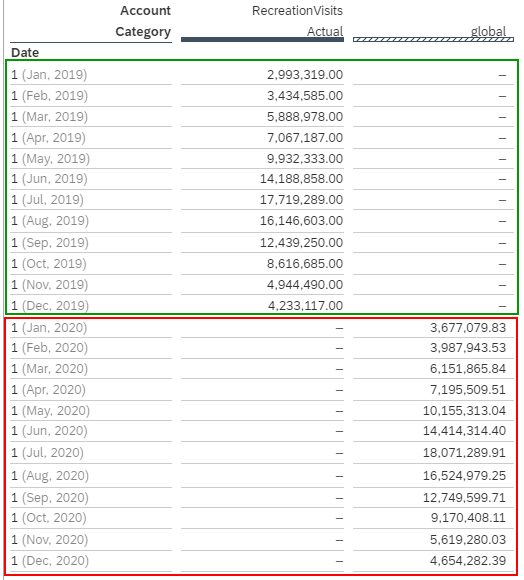
“Save Forecasts For Past Period” Not Enabled (default)
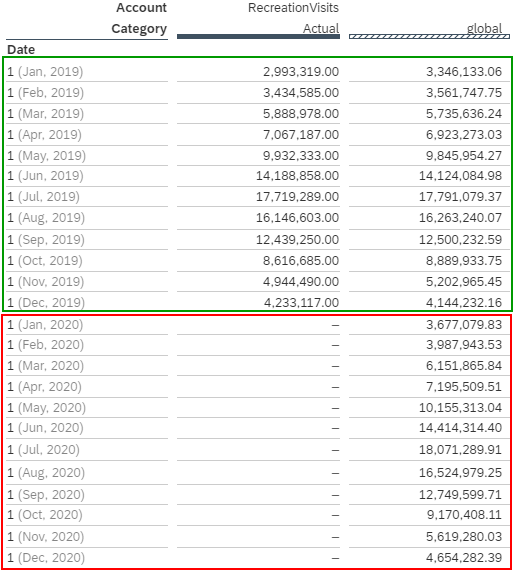
“Save Forecasts For Past Period” Enabled
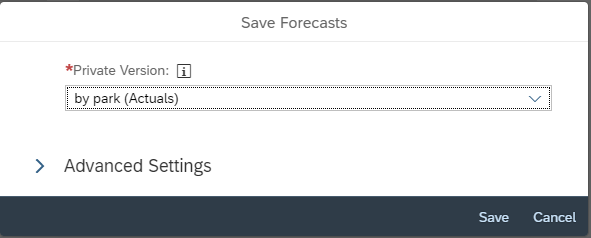
Select the “global” model, then click the “Save Forecasts” button (button with a factory like icon).
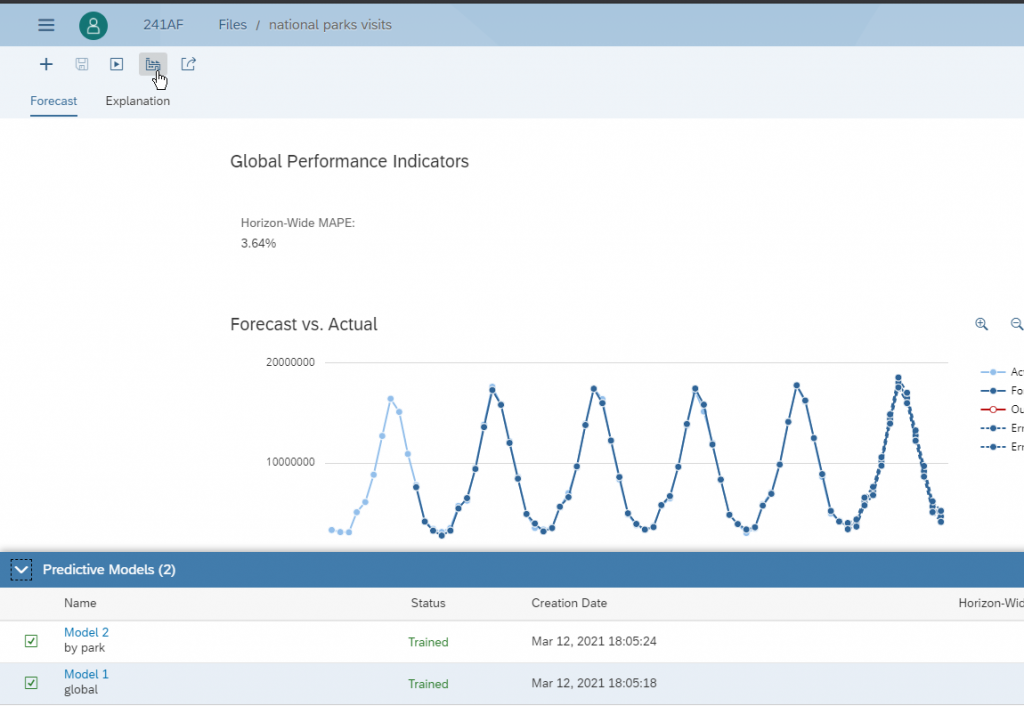
Select the “global” model, then click the “Save Forecasts” button (button with a factory like icon).
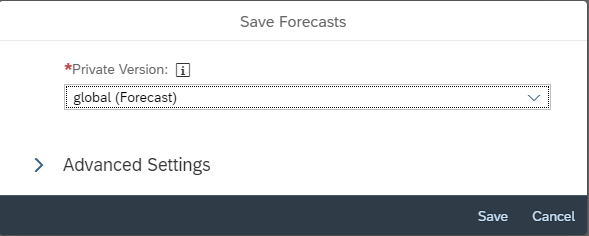
Expand the “Advanced Settings” section and enable the “Save Forecasts For Past Period” option.
Finally, click save to save the predictions to the “global” version.
Now do the same for the “by park” model.
Select the “by park” model, then click the “Save Forecasts” button (button with a factory like icon).
In the “Save Forecasts” dialog, select the “by park” version you have created previously as private output version.
Expand the “Advanced Settings” section and enable the “Save Forecasts For Past Period” option.
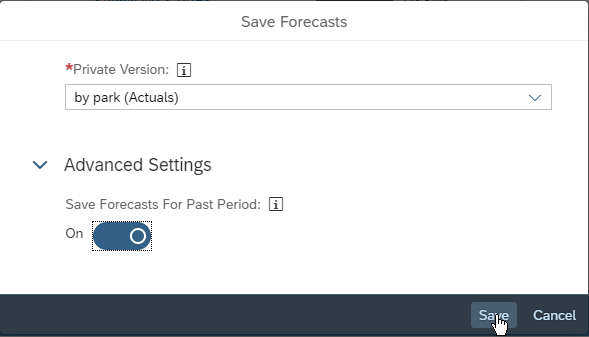
Finally, click save to save the predictions to the “by park” version.
Prepare the Story
We want to compare the total forecasts as provided by the “global” model to the total forecasts as provided by the “by park” model using the Mean Absolute Error metric (MAE).
So, in term of story calculation, we need to:
- Calculate the absolute difference between the predicted RecreationVisits and the actual RecreationVisits.
- Get the average of this value over the “past period”.
Add a Temporal Filter
Start by creating a table in the story. This table will be used to display the comparison of the predictive model performances.
The actuals for the future are obviously unknown, so it’s not possible to compute the error (actual – prediction) for the dates in this period. Since we want to compute some aggregated performance indicator, it’s important to exclude this period when calculating the error and the average of the error.
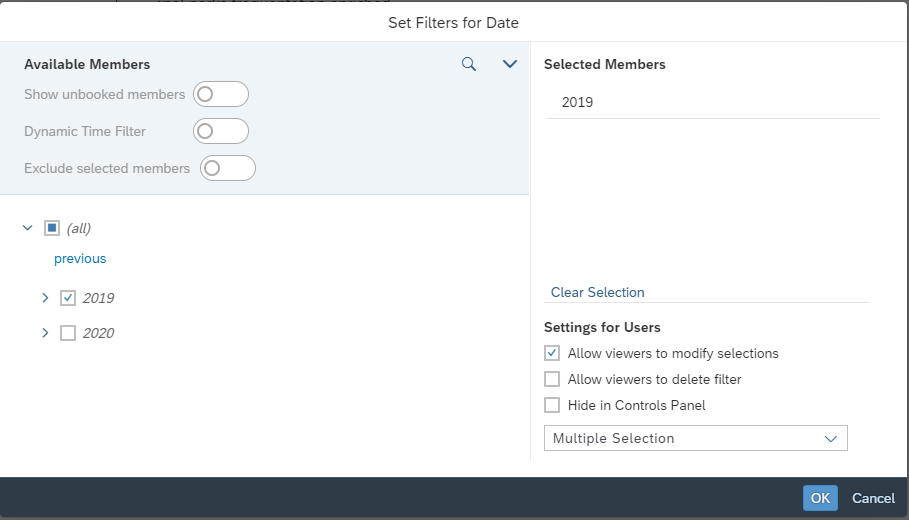
For this blog post we will compute the MAE for the 1-year period from January 2019 to December 2019, immediately preceding the forecast period.
- Create a table in the story.
- In the left settings panel click “Add Filter” then “Date (Member)”.
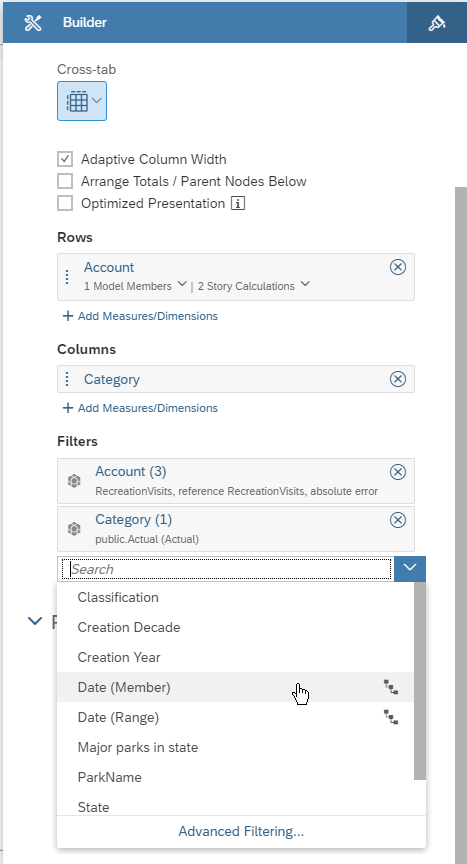
- Select the 2019 value only.
Calculating the Absolute Difference Between the Predictions and the Actuals
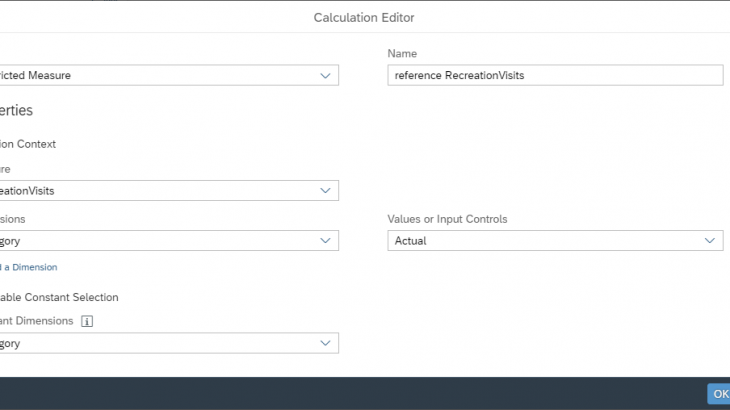
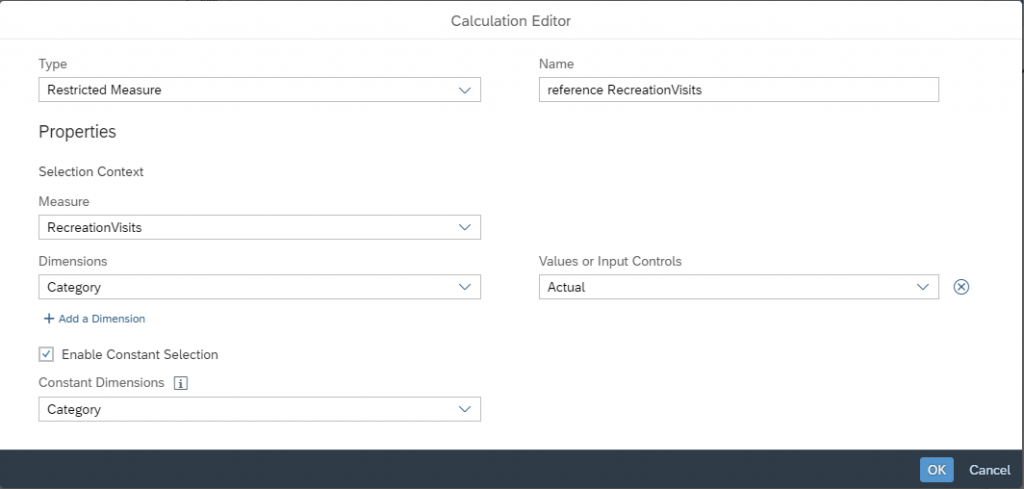
The first problem we must solve, is how to calculate the difference Actual.RecreationVisits – Predicted.RecreationVisits. This is not something that can be calculated directly using the formula editor. The trick is to use a “Restricted Measure” in order to “isolate” to duplicate the values for Actual.RecreationVisits into another measure.
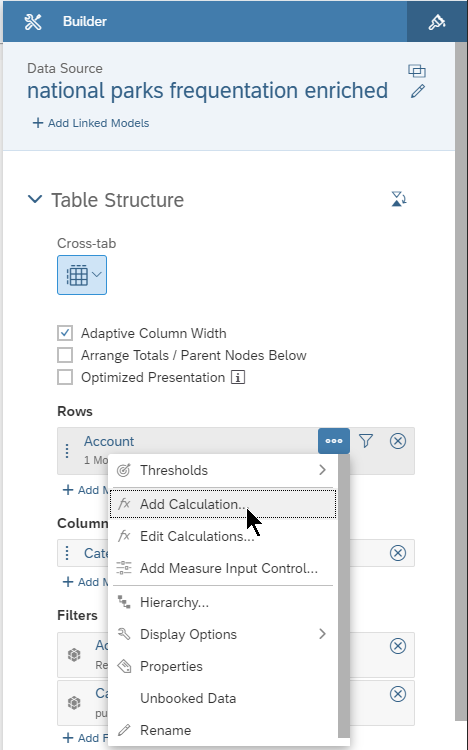
- Create a new calculation.

- Select the type “Restricted Measure” for your calculation.
- Name it “reference RecreationVisits”.
- Select “RecreationVisits” as measure to be copied.
- Copy only the values for “Category = Actual”.
- Select the “Enable Constant Selection” checkbox, otherwise the previous settings will be ignored.
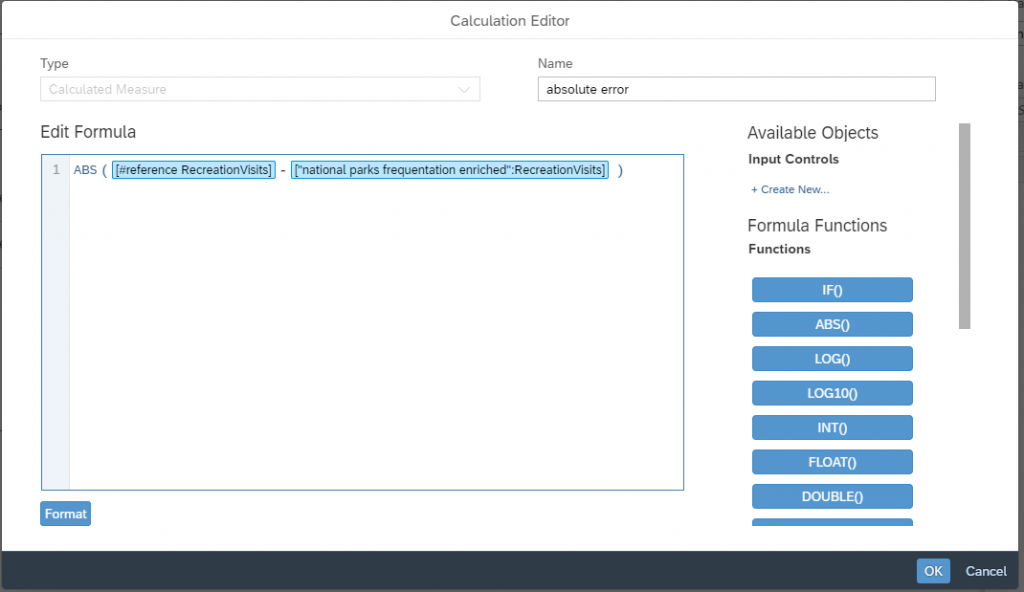
Now let’s calculate the absolute error.
- Create a new calculation
- Select the type “Calculated Measure” for your calculation.
- Name it “absolute error”.
- Enter the formula ABS([#reference RecreationVisits]-[“national parks frequentation enriched”:RecreationVisits] )
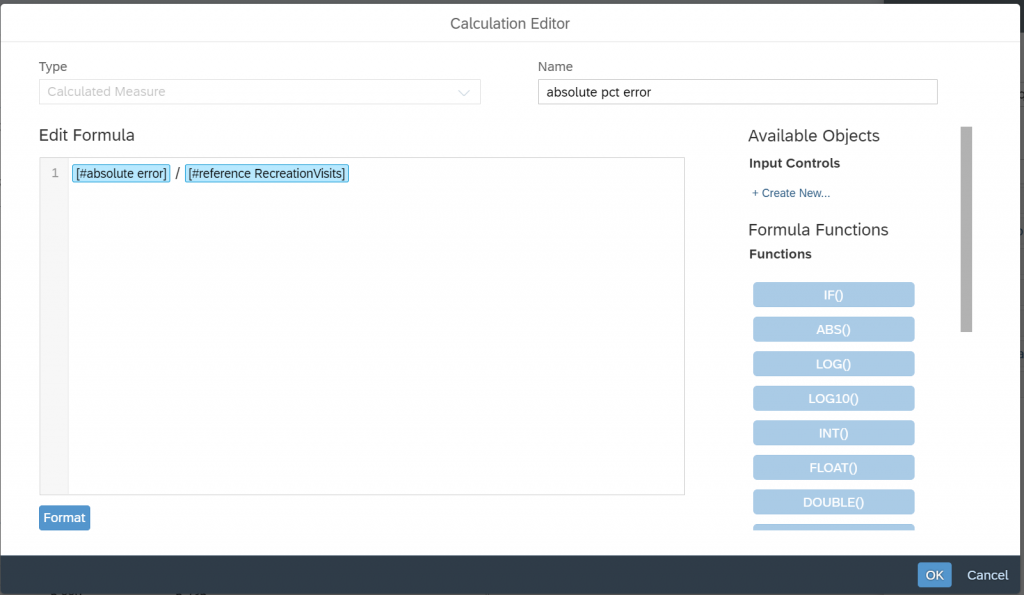
To get a better understanding of the overall forecast error, we will also represent the total error as a percentage. To do so, we just need to divide the total absolute error by the actual value.
At this stage with the proper table configuration, you should get something like this:
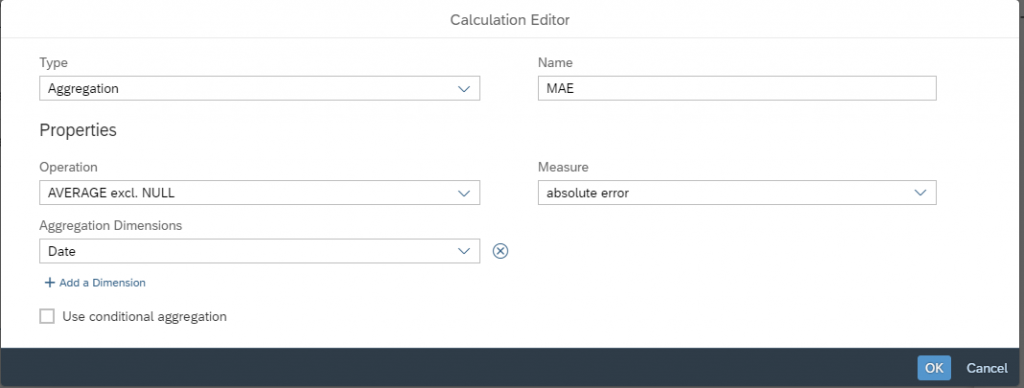
Calculating the Error Average Per Date
- Create a new calculation

- Choose the “Aggregation” type for the calculation
- Call the calculation MAE
- Compute the AVERAGE excl. NULL of the absolute error measure/
- Select the Date as aggregation dimension.
You now have all the calculated measures you need to build the table below.

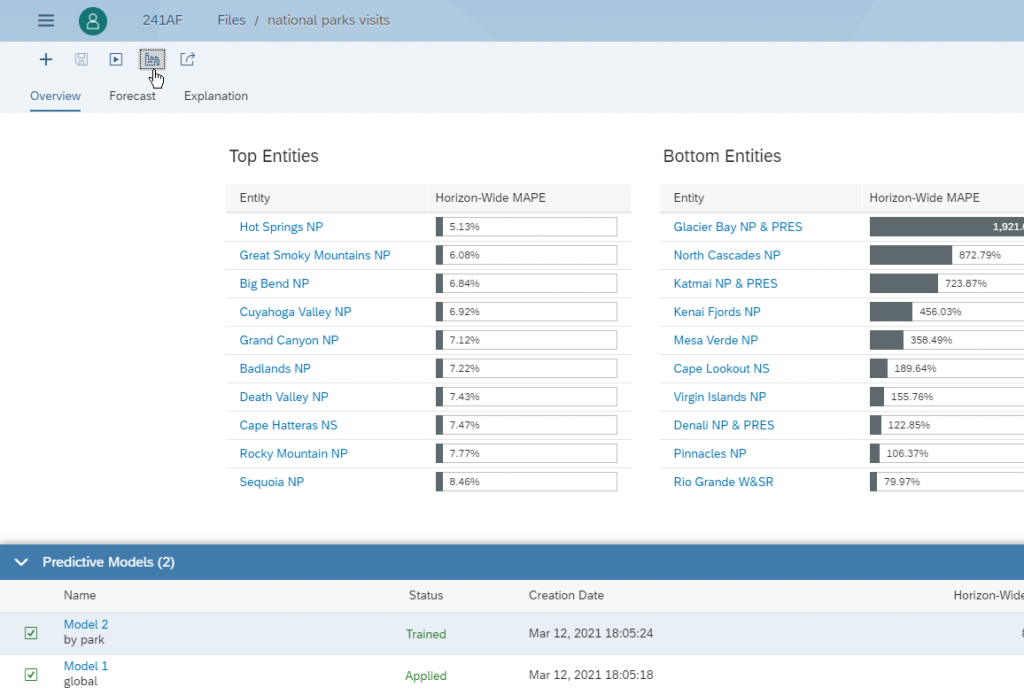
If you goal is only to predict accurately the total visits and you are not interested in consuming the forecast at the park level, then the “global” predictive model is the one that should be used. If you care about having accurate total forecast but also need drill at the park level, then the “by park” model the right model to use.


