ABAP Debugging using ADT (Eclipse/HANA Studio)
In ABAP on SAP HANA Part II, we made ourselves comfortable with the HANA Studio screen, icons and buttons. In this article, we will get exposed to Breakpoints and Debugging in ADT. If you have been working as an ABAPer for some time, it would not take much time for you to get familiar with the Debugger in ADT (Eclipse/HANA Studio). It the same wine in new bottle. ABAP debugger is completely integrated with Eclipse from Kernel 7.21, SAP Basis 7.31 SP4.
All the standard debugging features which were earlier available in GUI editor are also available in eclipse. Such as:
i) Set breakpoints
ii) Step through the code
iii) Display and change variable values
iv) View internal tables
v) Monitor the call stacks
Salient Properties of ADT breakpoints:
The breakpoints in ADT are User External breakpoints, so:
i) They are valid in your ABAP project
ii) Programs running under your ABAP user
iii) On all App servers in the backend system
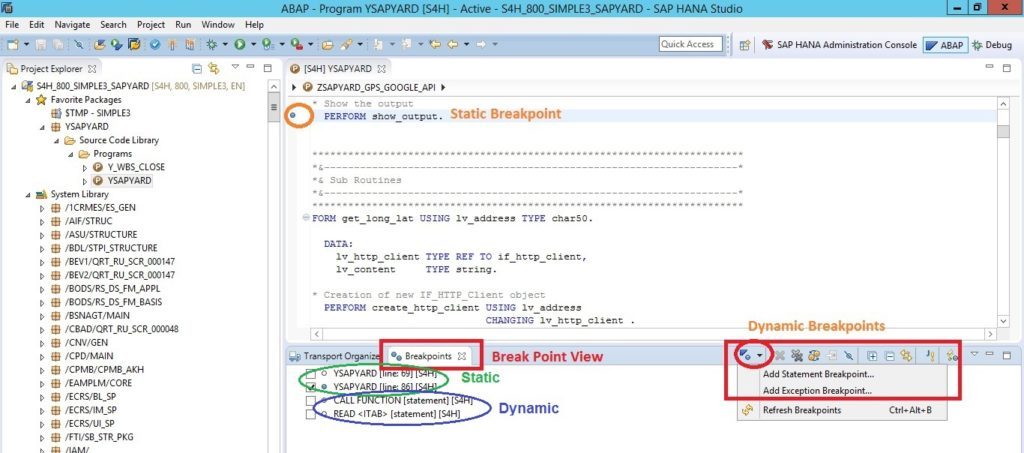
Two types of breakpoints in ADT:
- Static Breakpoint
Static breakpoints are set at a particular line of the code. A static breakpoint stays with the line of code at which you set it. If you delete code lines above the breakpoint, it slides along with the relocated code at that particular line. - Dynamic Breakpoint
Dynamic breakpoints are determined at run time. They are triggered when the running program reaches a particular ABAP statement e.g. loop, perform, select, calls, submits etc.
Please note: Dynamic breakpoints take effect for all programs that run under your user. You need to be careful to remove the dynamic breakpoint once you have finished your analysis. Or else, it would stop for any application where the dynamic breakpoint condition is found. And we are sure, you do not want speed breakers in a highway. We can always limit the scope of dynamic breakpoints to the scope of the debugger.
Advantage of ADT debugger:
One feature of the debugger in ADT is that you can work with the source code in debug mode as you work in ABAP perspective. That means, when you see a bug in the code during debugging, you can correct your code in the same editor in the same screen. Unlike traditional GUI debugger, where you need to go to SE38/SE37/SE80 etc in a separate session to change the code.
Hands On Section:
Enough of preaching!! Well, above are the theories and I am sure you would be more interested in looking at the actual screens. Let us have a quick look at the Debugger screen and substantiate our understanding.
- Check the icons/buttons which you can see during debugging:
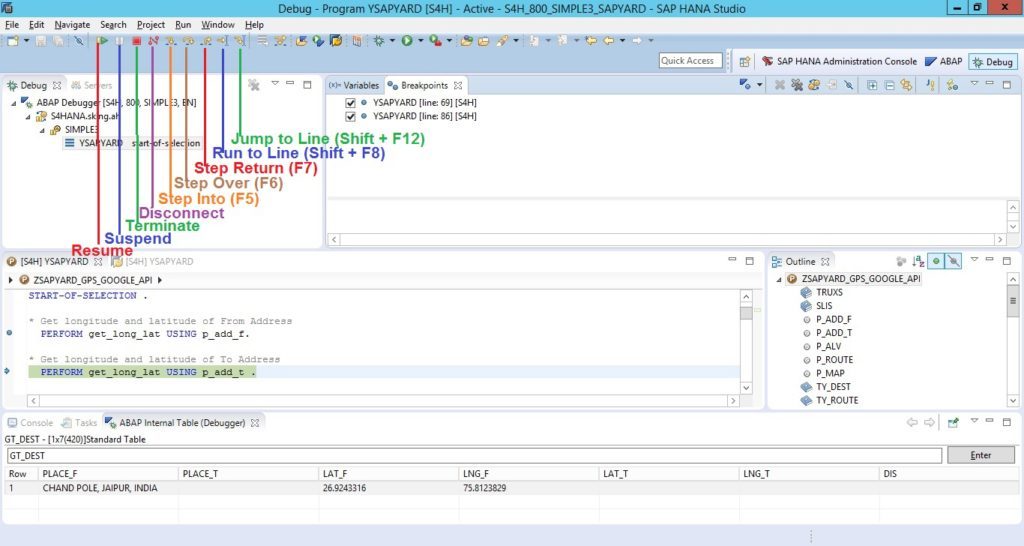
All the buttons are self-explanatory.
Resume button : Run to the next breakpoint or to the end of the program.
Terminate button : Abort the execution of the program in the debugger. Program execution ends.
Disconnect button : Run to the end of the program, ignoring any intervening breakpoints.
Step Into (F5) button : Execute the next single ABAP instruction in the program in the debugger.
Step Over (F6) button : Execute the next ABAP statement. If the next step is a procedure call, run the entire procedure.
Step Return (F7) button : Run until the current procedure returns to its caller or until the program ends.
Run to Line (Shift F8) button : Run to the statement on which the cursor is positioned. Breakpoints in between will be respected or not is set in Windows->Preferences->ABAP Development->Debug.
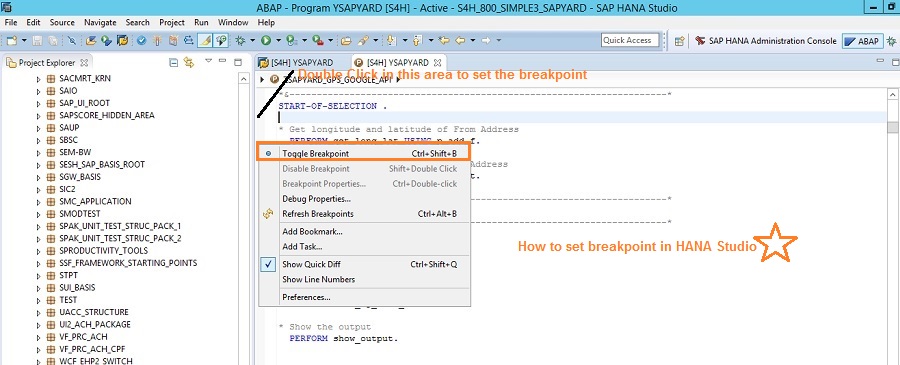
2. Put Static Breakpoint
Double click on the area shown below or right click and choose Toggle Breakpoint or press Ctrl + Shift + B.
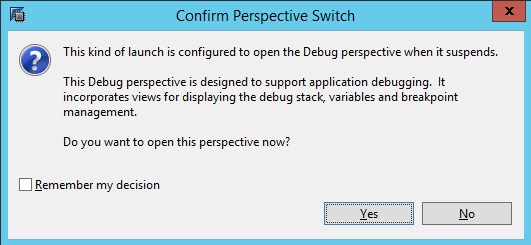
3. Execute the program
You would get this pop-up. Select OK and continue. The debugger stops at the breakpoint.
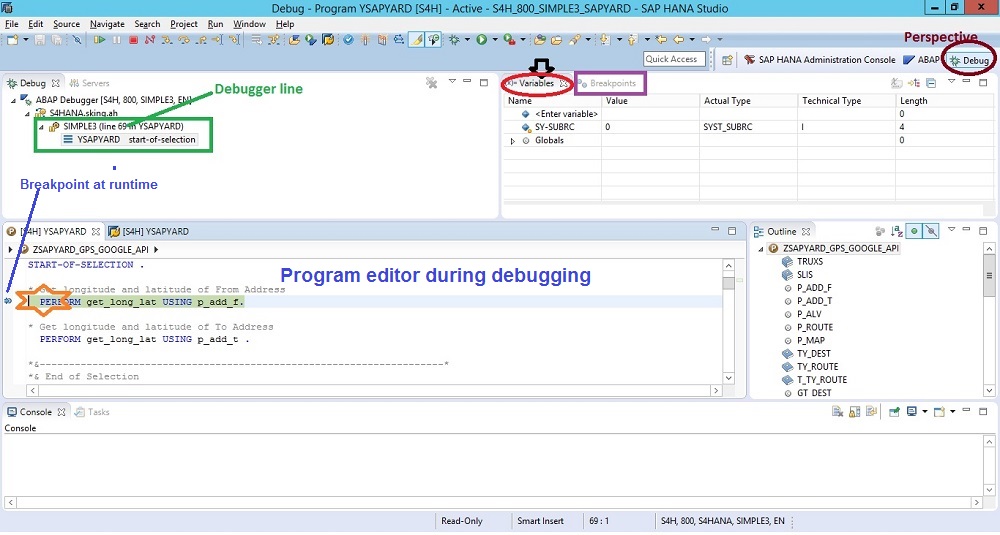
4. Check the Variables view, Debugger editor, Breakpoints view, Debug perspective etc
You can change the values of variables at the run time as you used to do in ABAP GUI debugger. You can also move the cursor over the variable to display its value.
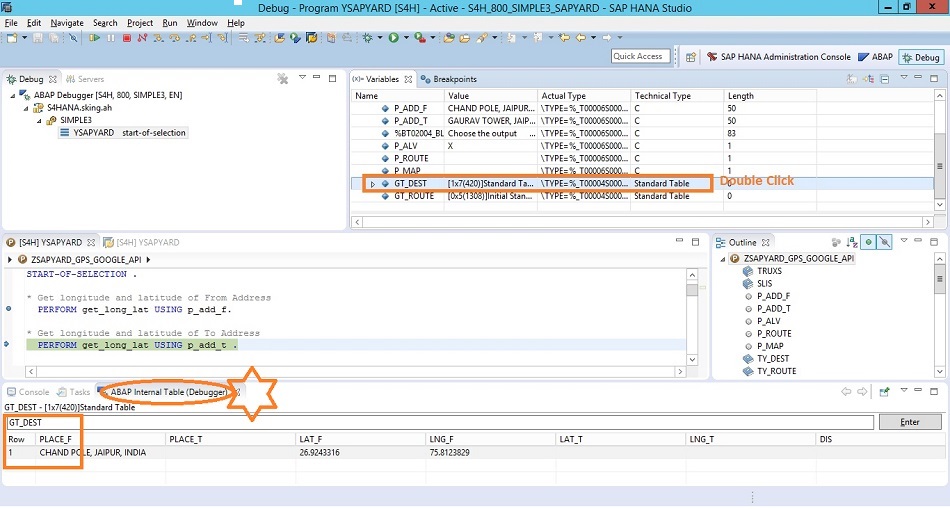
5. Check the ABAP Internal Table (Debugger) view
Double click on the internal table name and see the values in the internal table view.
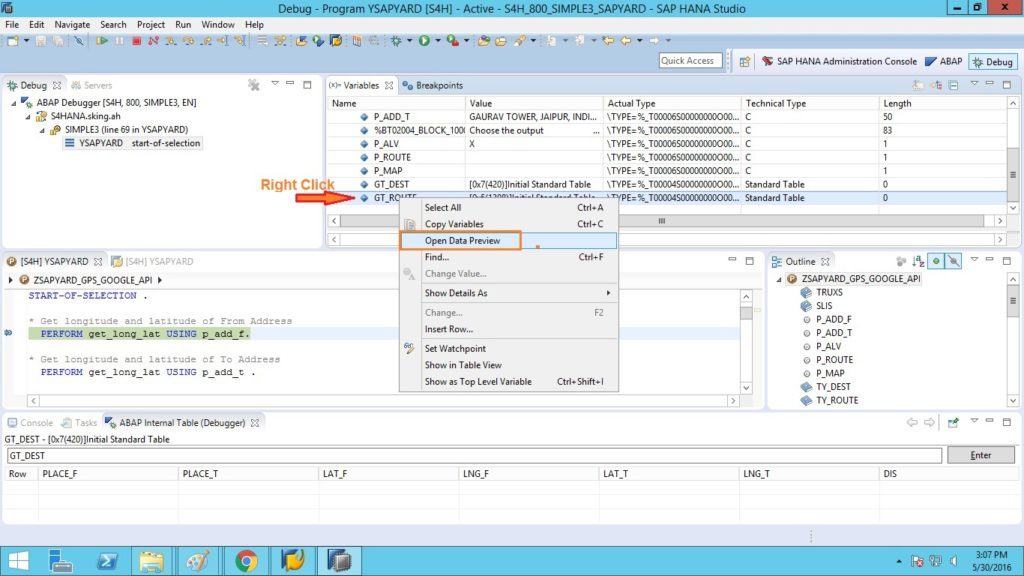
You can also right click on the internal table name and choose Open Data Preview to see the values of the internal table.
6. Let’s set a Dynamic Breakpoint
Go to the Breakpoints View and Add dynamic breakpoints at the statements you need. Type the statment in the search area and get your dynamic statements.
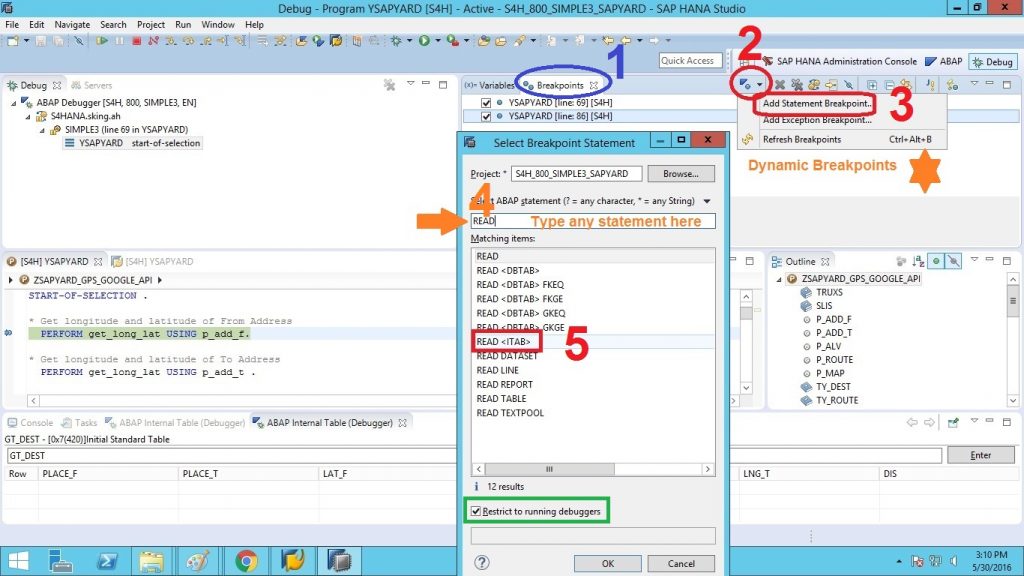
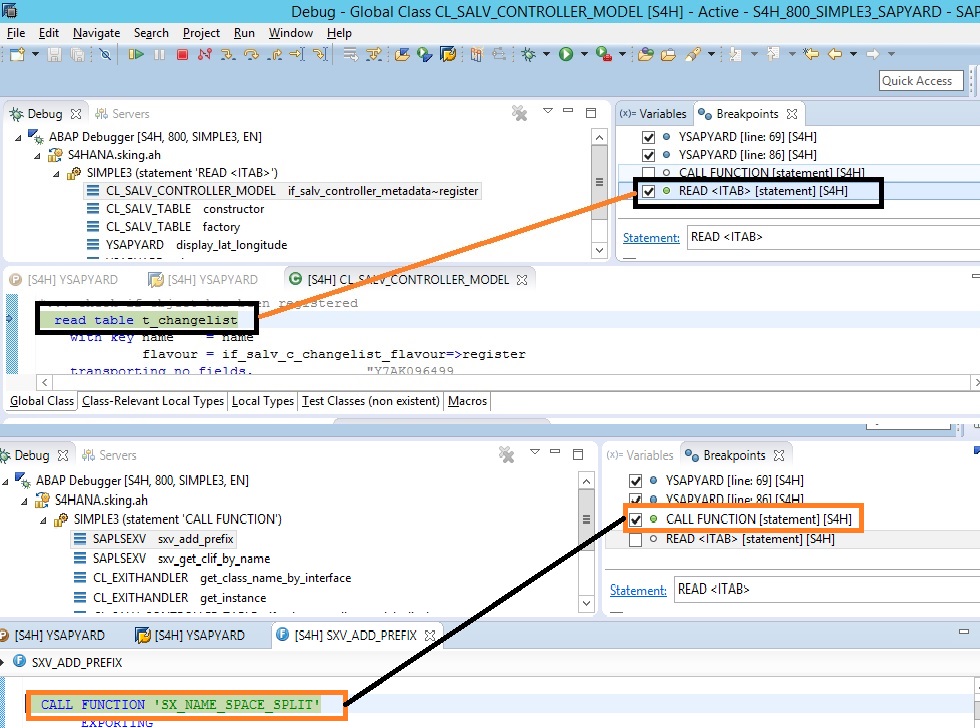
See two examples of dynamic breakpoint below.
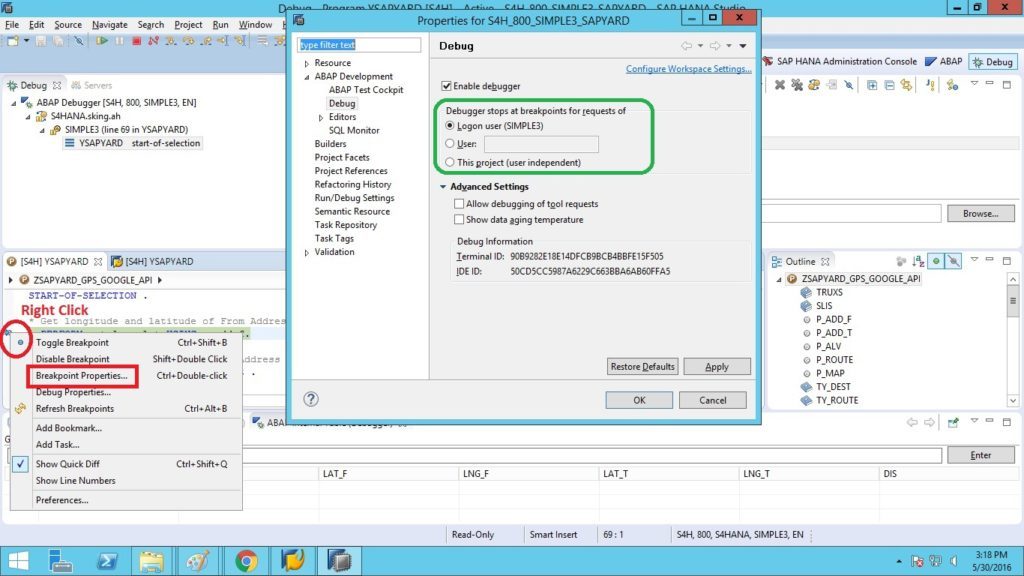
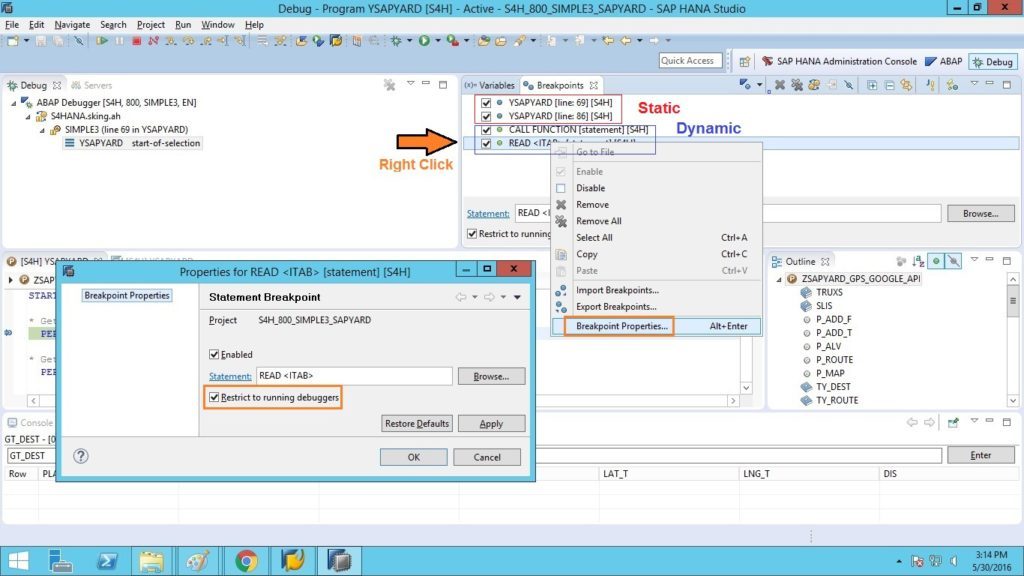
7. Manage the Breakpoint Properties of a particular breakpoint
Manage breakpoints using Breakpoints View. Right click on the breakpoint and choose the Breakpoint Properties and choose the restriction you want.
8. Manage the Debug Properties for the user/session
You can change the user for which external breakpoints are effective. Breakpoints cab also be effective for the entire project independent of the users.